Contents
- Kaspersky Anti Targeted Attack Platform Help
- Kaspersky Anti Targeted Attack Platform
- What's new
- About Kaspersky Threat Intelligence Portal
- Distribution kit
- Hardware and software requirements
- Compatibility of Kaspersky Endpoint Agent for Windows versions with Kaspersky Anti Targeted Attack Platform versions
- Compatibility of Kaspersky Endpoint Agent for Windows versions with EPP applications
- Compatibility of Kaspersky Endpoint Security for Windows versions with Kaspersky Anti Targeted Attack Platform versions
- Compatibility of Kaspersky Endpoint Security for Linux versions with Kaspersky Anti Targeted Attack Platform versions
- Compatibility of Kaspersky Endpoint Security for Mac with Kaspersky Anti Targeted Attack Platform versions
- Compatibility of KUMA versions with versions of Kaspersky Anti Targeted Attack Platform
- Compatibility of XDR versions with versions of Kaspersky Anti Targeted Attack Platform
- Compatibility of KPSN versions with versions of Kaspersky Anti Targeted Attack Platform
- Compatibility of Kaspersky Anti Targeted Attack Platform with VK Cloud
- Limitations
- Data provision
- Service data of the application
- Data of the Central Node and Sensor components
- Sandbox component data
- Data transmitted between application components
- Data contained in application trace files
- Data of Kaspersky Endpoint Agent for Windows
- Kaspersky Endpoint Security for Windows data
- Kaspersky Endpoint Security for Linux data
- Kaspersky Endpoint Security for Mac data
- Application licensing
- About the End User License Agreement
- About the license certificate
- About the license
- About the license key
- About the key file
- About the activation code
- About the subscription
- Adding a license key
- Replacing the license key
- Removing a license key
- Viewing information about added license keys in the web interface of the Central Node
- Viewing the text of the End User License Agreement in the web interface of the Central Node
- Viewing the text of the Privacy Policy in the web interface of the Central Node
- Viewing information about the third-party code used in the application
- Viewing the text of the End User License Agreement in the web interface of the Sandbox
- Viewing the text of the End User License Agreement for the Endpoint Agent component
- Application modes based on the license
- Architecture of the application
- Operating principle of the application
- Distributed solution and multitenancy
- Distributed solution and multitenancy mode transition scenario
- Modifications of application settings for the distributed solution and multitenancy mode
- Assigning the PCN role to a server
- Assigning the SCN role to a server
- Viewing information about tenants, PCN and SCN servers
- Adding a tenant to the PCN server
- Deleting a tenant from the PCN server
- Renaming a tenant on the PCN server
- Disconnecting an SCN from PCN
- Modifications of application settings for disconnecting an SCN from PCN
- Sizing Guide
- Installing and performing initial configuration of the application
- Preparing for installing application components
- Preparing the IT infrastructure for installing application components
- Preparing the IT infrastructure for integration with a mail server used for receiving messages via POP3
- Preparing the IT infrastructure for integration with a mail server used for receiving messages via SMTP
- Preparing the virtual machine for installing the Sandbox component
- Preparing an installation disk image with the Central Node, Sensor, and Sandbox components
- Procedure for installing and configuring application components
- Installing the Sandbox component
- Step 1. Viewing the End User License Agreement and Privacy Policy
- Step 2. Selecting a disk for installing the Sandbox component
- Step 3. Assigning the host name
- Step 4. Selecting the controlling network interface in the list
- Step 5. Assigning the address and network mask of the controlling interface
- Step 6. Adding DNS server addresses
- Step 7. Configuring a static network route
- Step 8. Configuring the minimum password length for the Sandbox administrator password
- Step 9. Creating the Sandbox administrator account
- Deploying the Central Node component with Embedded Sensor as a cluster
- Deploying a storage server
- Step 1. Viewing the End User License Agreement and Privacy Policy
- Step 2. Selecting a server role
- Step 3. Selecting the deployment mode
- Step 4. Selecting a disk for installing the component
- Step 5. Selecting a network mask for server addressing
- Step 6. Selecting a network mask for addressing of application components
- Step 7. Selecting the cluster network interface
- Step 8. Selecting the external network interface
- Step 9. Selecting the method of obtaining IP addresses for network interfaces
- Step 10. Creating an administrator account and authenticating the server in the cluster
- Step 11. Adding DNS server addresses
- Step 12. Configuring time synchronization with an NTP server
- Step 13. Selecting disks for the Ceph storage
- Deploying the processing server
- Step 1. Viewing the End User License Agreement and Privacy Policy
- Step 2. Selecting a server role
- Step 3. Selecting a disk for installing the component
- Step 4. Selecting a network mask for cluster server addressing
- Step 5. Selecting a network mask for addressing of application components
- Step 6. Selecting the cluster network interface
- Step 7. Selecting the external network interface
- Step 8. Selecting the method of obtaining IP addresses for network interfaces
- Step 9. Authenticating the server in the cluster
- Step 10. Selecting the localization language for the NDR functionality and configuring the receipt of mirrored traffic from SPAN ports
- Purging hard disks on storage servers
- Deploying a storage server
- Installing the Central Node component with Embedded Sensor on a server
- Step 1. Viewing the End User License Agreement and Privacy Policy
- Step 2. Selecting a server role
- Step 3. Selecting a disk for installing the component
- Step 4. Allocating the disk for the Targeted Attack Analyzer component's database
- Step 5. Selecting a network mask for server addressing
- Step 6. Selecting a network mask for addressing of application components
- Step 7. Selecting the external network interface
- Step 8. Selecting the method of obtaining IP addresses for network interfaces
- Step 9. Creating the administrator account
- Step 10. Selecting the localization language for the NDR functionality
- Step 11. Adding DNS server addresses
- Step 12. Configuring time synchronization with an NTP server
- Step 13. Configuring receipt of mirrored traffic from SPAN ports
- Installing the Sensor component on a standalone server
- Step 1. Viewing the End User License Agreement and Privacy Policy
- Step 2. Selecting a server role
- Step 3. Selecting a disk for installing the component
- Step 4. Selecting a network mask for server addressing
- Step 5. Selecting a network mask for addressing of application components
- Step 6. Selecting the external network interface
- Step 7. Selecting the method of obtaining IP addresses for network interfaces
- Step 8. Creating the administrator account
- Step 9. Adding DNS server addresses
- Step 10. Configuring time synchronization with an NTP server
- Step 11. Configuring receipt of mirrored traffic from SPAN ports
- Optimization of network interface settings for the Sensor component
- Connecting and configuring external storage for the Sensor component
- Preparing for installing application components
- Configuring the sizing settings of the application
- Configuring firewall rules
- Ports used on computers with Kaspersky Anti Targeted Attack Platform components
- Ports used by Kaspersky Anti Targeted Attack Platform services in a cluster configuration
- Ports used by services of a Central Node deployed as a server
- Ports used by services in a configuration with the Sensor component installed on a standalone server
- Ports for communication between network traffic analysis services
- Configuring integration of the Endpoint Agent component with the KEDR functional block
- Configuring a trusted connection with Kaspersky Endpoint Agent
- Configuring the validation of the Kaspersky Endpoint Agent TLS certificate by the Central Node server and uploading a crypto container to Kaspersky Endpoint Agent
- Uploading a TLS certificate of the Central Node server or Sensor to Kaspersky Endpoint Agent
- Configuring the integration and trusted connection with Kaspersky Anti Targeted Attack Platform on the Kaspersky Endpoint Agent side
- Configuring a trusted connection with Kaspersky Endpoint Security
- Downloading the TLS certificate of the Central Node server
- Generating a TLS certificate for the Central Node server in the web interface of Kaspersky Anti Targeted Attack Platform
- Uploading an independently prepared TLS certificate for the Central Node server using the web interface of Kaspersky Anti Targeted Attack Platform
- Enabling the validation of the TLS certificate of the Endpoint Agent component in the web interface of Kaspersky Anti Targeted Attack Platform
- Generating a TLS certificate of the Endpoint Agent component in the web interface of Kaspersky Anti Targeted Attack Platform and downloading a crypto container
- Uploading an independently prepared TLS certificate of the Endpoint Agent component using the web interface of Kaspersky Anti Targeted Attack Platform
- Viewing the table of TLS certificates of the Endpoint Agent component in the web interface of Kaspersky Anti Targeted Attack Platform
- Filtering and searching TLS certificates of the Endpoint Agent component in the web interface of Kaspersky Anti Targeted Attack Platform
- Deleting TLS certificates of the Endpoint Agent component in the web interface of Kaspersky Anti Targeted Attack Platform
- Configuring traffic redirection from the Endpoint Agent component to the Sensor server
- Configuring a trusted connection with Kaspersky Endpoint Agent
- Configuring integration of the Endpoint Agent component with the NDR functional block
- Integration servers table
- Scenario for preparing to receive data from the Endpoint Agent component
- Adding an integration server
- Creating a communication data package for clients of an integration server
- Enabling or disabling an integration server
- Editing integration server settings
- Removing an integration server
- Getting started with the application
- Managing accounts of application administrators and users
- Creating an administrator account for the application web interface
- Creating a user account for the application web interface
- Configuring user account table display
- Viewing the user account table
- Filtering user accounts
- Clearing the account filter
- Changing access rights of an application web interface user account
- Enabling and disabling an administrator account or user account of the application web interface
- Changing the password of an application administrator or user account
- Changing the password of your account
- Authentication using domain accounts
- Participation in Kaspersky Security Network and use of Kaspersky Private Security Network
- Managing the Sandbox component through the web interface
- Updating the Sandbox component databases
- Configuring connection between the Sandbox and Central Node components
- Configuring the Sandbox component network interfaces
- Setting the Sandbox system date and time
- Installing and configuring images of operating systems and applications required for the operation of the Sandbox component
- Managing operating system and application images in the Sandbox Storage
- Managing virtual machine templates
- Managing virtual machines
- Setting the maximum number of simultaneously running virtual machines
- Changing the number of license keys for a virtual machine with a custom operating system image
- Downloading the Sandbox system log to the hard drive
- Exporting Sandbox settings
- Importing Sandbox settings
- Restarting the Sandbox server
- Powering off the Sandbox server
- Changing the Sandbox administrator account password
- For administrators: Getting started with the application web interface
- Kaspersky Anti Targeted Attack Platform Interface
- Monitoring the performance of the application
- About widgets and layouts
- Selecting a tenant and a server to manage in the Dashboard section
- Adding a widget to the current layout
- Moving a widget in the current layout
- Changing the display of information in NDR widgets
- Removing a widget from the current layout
- Saving a layout to PDF
- Configuring the data display period in widgets
- Monitoring the receipt and processing of incoming data
- Monitoring the queues for data processing by application modules and components
- Monitoring the processing of data by the Sandbox component
- Viewing the working condition of modules and components of the application
- Managing Central Node or Sensor server information
- Managing Central Node, PCN, or SCN servers using the application web interface
- Changing the server name
- Configuring the date and time on the server
- Generating or uploading a TLS certificate of the server
- Downloading the TLS certificate of the server
- Assigning a server DNS name
- Configuring DNS settings
- Configuring settings of the network interface
- Configuring the default network route
- Configuring proxy server connection settings
- Configuring the mail server connection
- Managing traffic saving settings
- Managing the settings for saving traffic dump files
- Selecting operating systems to use when scanning objects in Sandbox
- Password policies
- Managing the Sensor component
- Connecting the Sensor component to the Central Node
- Managing the certificate of the Sensor component
- Logging in to the web interface of the Sensor component
- Changing the server name
- Managing monitoring points
- Configuring the maximum size of a scanned file
- Configuring HTTP packet body dumping
- Configuring integration with a mail server via SMTP
- Configuring integration with a proxy server via ICAP
- Configuring recording of mirrored traffic from SPAN ports
- Configuring integration with a mail server via POP3
- Managing the cluster
- Notifications about the maximum allowed CPU and RAM load for the Central Node and Sensor servers
- Configuring the SNMP protocol connection
- Managing Endpoint Agent host information
- Selecting a tenant to manage in the Endpoint Agents section
- Viewing the table of hosts with the Endpoint Agent component on a standalone Central Node server
- Viewing information about a host
- Filtering and searching hosts with the Endpoint Agent component by host name
- Filtering and searching hosts with the Endpoint Agent component that have been isolated from the network
- Filtering and searching hosts with the Endpoint Agent component by PCN and SCN server names
- Filtering and searching hosts with the Endpoint Agent component by computer IP address
- Filtering and searching hosts with the Endpoint Agent component by operating system version on the computer
- Filtering and searching hosts with the Endpoint Agent component by component version
- Filtering and searching hosts with the Endpoint Agent component by their activity
- Quickly creating a filter for hosts with the Endpoint Agent component
- Resetting the filter for hosts with the Endpoint Agent component
- Configuring activity indicators of the Endpoint Agent component
- Removing hosts with the Endpoint Agent component
- Automatic removal of inactive hosts
- Supported interpreters and processes
- Configuring integration with the Sandbox component
- Manually sending files from Endpoint Agent hosts to be scanned by Sandbox
- Configuring integration with external systems
- Configuring integration with Kaspersky Managed Detection and Response
- Configuring integration with an SIEM system
- Renewing the certificate for connecting to the Central Node using the API
- Managing connectors
- Managed and unmanaged connectors
- Sending events, application messages, and audit records to third-party systems
- Automatic network access control for devices via Cisco Switch connectors
- Adding a connector
- Viewing the table of connectors
- Enabling or disabling a connector
- Editing connector settings
- Creating a new communication data package for a connector
- Deleting a connector
- Adding and deleting connector types
- Managing account credentials secrets for remote connections
- Updating application databases
- Creating a list of passwords for archives
- Configuring integration with ArtX TLSproxy
- For security officers: Getting started with the application web interface
- Kaspersky Anti Targeted Attack Platform Interface
- Selecting a tenant to manage in the web interface of the application
- Monitoring the performance of the application
- About widgets and layouts
- Adding a widget to the current layout
- Moving a widget in the current layout
- Changing the display of information in NDR widgets
- Removing a widget from the current layout
- Saving a layout to PDF
- Configuring the data display period in widgets
- Configuring the widget display scale
- Basics of managing "Alerts" type widgets
- Information in the Devices widget
- Information in the Events widget
- Viewing the working condition of modules and components of the application
- Managing technologies
- Viewing the alert table
- Configuring the alert table display
- Filtering, sorting, and searching alerts
- Filtering alerts by VIP status
- Filtering and searching alerts by time
- Filtering alerts by level of importance
- Filtering and searching alerts by categories of objects detected
- Filtering and searching alerts by obtained information
- Filtering and searching alerts by source address
- Filtering and searching alerts by destination address
- Filtering and searching alerts by server name
- Filtering and searching alerts by technology name
- Filtering and searching alerts by the status of their processing by the user
- Filtering and searching alerts by the name of the user to which they are assigned
- Sorting alerts in the table
- Quickly creating an alert filter
- Saving filters
- Resetting the alert filter
- Recommendations for processing alerts
- Recommendations for processing AM alerts
- Recommendations for processing TAA alerts
- Recommendations for processing SB alerts
- Recommendations for processing IOC alerts
- Recommendations for processing YARA alerts
- Recommendations for processing IDS alerts
- Recommendations for processing NDR:IDS and NDR:EA alerts
- Viewing alerts
- Viewing alert details
- General information about an alert of any type
- Information in the Object information section
- Information in the Alert details section
- Information in the Information about scanning using NDR technologies section
- Information in the Scan results section
- Information in the IDS rule section
- Information in the URL section
- Information in the IP addresses of detection-related devices section
- Information in the Network event section
- Scan results in Sandbox
- IOC scan results
- Information in the Hosts section
- Information in the Change log section
- Sending alert data
- Viewing alert relations
- User actions performed on alerts
- Monitoring network traffic events
- NDR event scores and severity levels
- NDR event registration technologies
- NDR event statuses
- Table of registered NDR events
- Configuring the table of registered events
- Viewing events nested inside an aggregate event
- Viewing details of an NDR event
- Changing the status of an NDR event
- Adding markers
- Copying NDR events to a text editor
- Downloading traffic for events
- Creating a directory for exporting events to a network share
- Events database threat hunting
- Searching for events in builder mode
- Searching for events in source code mode
- Converting a builder query for searching events in source code mode
- Event search criteria
- Operators
- Sorting events in the table
- Changing the event search conditions
- Searching for events by processing results in EPP applications
- Searching for events using conditions specified in an IOC or YAML file
- Creating a TAA (IOA) rule based on event search conditions
- Event information
- Recommendations for processing events
- Information about events in the tree of events
- Viewing the table of events
- Configuring the event table display
- Viewing information about an event
- Information about the "Process started" event
- Information about the "Process terminated" event
- Information about the "Module loaded" event
- Information about the "Remote connection" event
- Information about the "Prevention rule" event
- Information about the "Document blocked" event
- Information about the "File modified" event
- Information about the "System event log" event
- Information about the "Changes in the registry" event
- Information about the "Port listened" event
- Information about the "Driver loaded" event
- Information about the "DNS" event
- Information about the "LDAP" event
- Information about the "Named pipe" event
- Information about the "WMI" event
- Information about the "Alert" event
- Information about the "Alert processing result" event
- Information about the "Interpreted file run" event
- Information about the "AMSI scan" event
- Information about the "Interactive command input at the console" event
- Information about the "Code injection" event
- Information about the "Process access" event
- Event chain scanning by Kaspersky TAA (IOA) rules
- Managing assets
- Viewing the table of devices
- Viewing device information
- Automatically adding and updating devices
- Manually adding devices
- Automatically assigning device status
- Automatically grouping devices based on a criterion
- Manually arranging devices into groups
- Moving servers with components and groups to other groups on the network interactions map
- Device group tree
- Manually editing the device group tree
- Adding and removing device labels
- Group response
- Monitoring users on devices
- Monitoring file execution on devices
- Active device polling jobs
- Configuring address spaces
- Working with the network interactions map
- Nodes on the network interactions map
- Device groups on the network interactions map
- Links on the network interactions map
- Viewing object details
- Zooming the network interactions map
- Positioning the network map
- Pinning and unpinning nodes and groups
- Manually rearranging nodes and groups
- Automatically arranging nodes and groups
- Searching for nodes on the network interactions map
- Filtering objects on the network interactions map
- Saving and loading the display settings of the network interactions map
- Adding a new view and saving the current display settings of the network interactions map
- Refreshing a view while keeping the current display settings of the network interactions map
- Renaming a network interactions map view
- Deleting a network interactions map view
- Applying settings saved in the view to the network interactions map
- Monitoring network sessions
- Monitoring risks
- Configuring NDR event types
- Viewing the table of event types
- Editing the settings of a system event type
- Configuring automatic saving of traffic for system event types
- Configuring the forwarding of events through connectors
- Common substitution variables in Kaspersky Anti Targeted Attack Platform
- NDR event registration technologies
- System event types in Kaspersky Anti Targeted Attack Platform
- Configuring risk types
- System event types in Kaspersky Anti Targeted Attack Platform
- Managing Endpoint Agent host information
- Viewing the table of hosts with the Endpoint Agent component
- Configuring the display of the table of hosts with the Endpoint Agent component
- Viewing information about a host
- Filtering and searching hosts with the Endpoint Agent component by host name
- Filtering and searching hosts with the Endpoint Agent component that have been isolated from the network
- Filtering and searching hosts with the Endpoint Agent component by PCN and SCN server names
- Filtering and searching hosts with the Endpoint Agent component by computer IP address
- Filtering and searching hosts with the Endpoint Agent component by operating system version on the computer
- Filtering and searching hosts with the Endpoint Agent component by component version
- Filtering and searching hosts with the Endpoint Agent component by their activity
- Quickly creating a filter for hosts with the Endpoint Agent component
- Resetting the filter for hosts with the Endpoint Agent component
- Removing hosts with the Endpoint Agent component
- Configuring activity indicators of the Endpoint Agent component
- Supported interpreters and processes
- Network isolation of hosts with the Endpoint Agent component
- Automatically sending files from Kaspersky Endpoint Agent hosts to be scanned by the Sandbox component in accordance with Kaspersky TAA (IOA) rules
- Selecting operating systems to use when scanning objects in Sandbox
- Managing tasks
- Viewing the task table
- Viewing information about a task
- Creating a get file task
- Creating a forensic collection task
- Creating a registry key retrieval task
- Creating an NTFS metafile retrieval task
- Creating a process memory dump retrieval task
- Creating a disk image retrieval task
- Creating a RAM dump retrieval task
- Creating a process termination task
- Creating a task to scan hosts using YARA rules
- Creating a service management task
- Creating an application execution task
- Creating a file deletion task
- Creating a file quarantine task
- Creating a quarantined file recovery task
- Creating a copy of a task
- Deleting tasks
- Filtering tasks by creation time
- Filtering tasks by type
- Filtering tasks by name
- Filtering tasks by file name and path
- Filtering tasks by description
- Filtering tasks by server name
- Filtering tasks based on the name of the user that created the task
- Filtering tasks by processing status
- Clearing a task filter
- Managing policies (prevention rules)
- Viewing the prevention rule table
- Configuring prevention rule table display
- Viewing a prevention rule
- Creating a prevention rule
- Importing prevention rules
- Enabling and disabling a prevention rule
- Enabling and disabling presets
- Deleting prevention rules
- Filtering prevention rules by name
- Filtering prevention rules by type
- Filtering prevention rules by file hash
- Filtering prevention rules by server name
- Clearing a prevention rule filter
- Managing user-defined rules
- Using indicators of compromise (IOC) and attack (IOA) for Threat Hunting
- Managing user-defined TAA (IOA) rules
- Viewing the TAA (IOA) rule table
- Creating a TAA (IOA) rule based on event search conditions
- Importing TAA (IOA) rules
- Viewing custom TAA (IOA) rule details
- Searching for alerts and events in which TAA (IOA) rules were triggered
- Filtering and searching TAA (IOA) rules
- Resetting the TAA (IOA) rule filter
- Enabling and disabling TAA (IOA) rules
- Modifying a TAA (IOA) rule
- Deleting TAA (IOA) rules
- Managing user-defined IOC rules
- Viewing the table of IOC files
- Viewing information about an IOC file
- Uploading an IOC file
- Downloading an IOC file to a computer
- Enabling and disabling the automatic use of an IOC file when scanning hosts
- Deleting an IOC file
- Searching for alerts in IOC scan results
- Searching for events using an IOC file
- Filtering and searching IOC files
- Clearing an IOC file filter
- Configuring an IOC scan schedule
- Managing user-defined Intrusion Detection rules
- Managing user-defined YARA rules
- Managing objects in Storage and Quarantine
- Viewing the table of objects that were placed in Storage
- Viewing information about an object manually placed in Storage using the web interface
- Viewing information about an object placed in Storage by a get file task
- Viewing information about an object placed in Storage by a get data task
- Downloading objects from Storage
- Uploading objects to Storage
- Sending objects in Storage for scanning
- Deleting objects from Storage
- Filtering objects in Storage by object type
- Filtering objects in Storage by object description
- Filtering objects in Storage based on scan results
- Filtering objects in Storage based on the name of Central Node, PCN, or SCN server
- Filtering objects in Storage by object source
- Filtering objects based on the time they were placed in Storage
- Clearing a Storage objects filter
- Viewing the table of objects quarantined on computers with the Kaspersky Endpoint Agent component
- Viewing information about a quarantined object
- Restoring an object from quarantine
- Obtaining a copy of a quarantined object on a Kaspersky Anti Targeted Attack Platform server
- Removing information about the quarantined object from the table
- Filtering information about quarantined objects by object type
- Filtering information about quarantined objects by object description
- Filtering information about quarantined objects by host name
- Filtering information about quarantined objects by time
- Resetting the filter for information about quarantined objects
- Managing reports
- Managing common reports
- Viewing the table of templates and reports
- Creating a template
- Creating a report based on a template
- Viewing a report
- Downloading a report to a local computer
- Editing a template
- Filtering templates by name
- Filtering templates based on the name of the user that created the template
- Filtering templates by creation time
- Clearing a template filter
- Deleting a template
- Filtering reports by creation time
- Filtering reports by name
- Filtering reports by the name of the server with the Central Node component
- Filtering reports based on the name of the user that created the report
- Clearing a report filter
- Deleting a report
- Managing NDR reports
- Viewing the table of NDR report templates
- Viewing NDR report template details
- Viewing the table of NDR reports
- Manually generating an NDR report based on a template
- Duplicating an NDR report template
- Editing an NDR report template
- Exporting an NDR report to a file
- Deleting an NDR report template
- Deleting an NDR report
- Canceling NDR report generation
- Managing the settings for storing report files
- Managing common reports
- Managing rules for assigning the VIP status to alerts
- Viewing the table of VIP status assignment rules
- Creating a VIP status assignment rule
- Deleting a VIP status assignment rule
- Modifying a VIP status assignment rule
- Importing a list of VIP status assignment rules
- Exporting the list of data excluded from the scan
- Filtering and searching by type of VIP status assignment rule
- Filtering and searching by value of VIP status assignment rule
- Filtering and searching by description of VIP status assignment rule
- Clearing a VIP status assignment rule filter
- Managing allow rules for NDR events
- Managing the list of scan exclusions
- Viewing the table of data excluded from the scan
- Adding a scan exclusion rule
- Deleting a scan exclusion rule
- Editing a rule added to scan exclusions
- Exporting the list of data excluded from the scan
- Filtering rules in the scan exclusion list by criterion
- Searching for rules in the scan exclusion list by value
- Resetting the rule filter in the scan exclusion list
- Managing Intrusion Detection rule exclusions
- Managing TAA exclusions
- Managing ICAP exclusions
- Viewing the ICAP exclusion table
- Adding a rule to ICAP exclusions
- Removing rules from ICAP exclusions
- Editing or disabling a rule in the ICAP exclusion list
- Filtering rules in the ICAP exclusion list by criterion
- Filtering rules in the ICAP exclusion list by value
- Filtering rules in the ICAP exclusion list by state
- Clearing rule filter conditions in the ICAP exclusion list
- Managing mirrored traffic from SPAN ports
- Creating a list of passwords for archives
- Managing Central Node or Sensor server information
- Viewing server settings
- Viewing the table of servers with the Sandbox component
- Viewing the settings of the set of operating systems used for scanning objects in Sandbox
- Viewing the table of external systems
- Managing user-defined Sandbox rules
- Viewing the table of user-defined Sandbox rules
- Configuring the Sandbox rule table display
- Filtering and searching Sandbox rules
- Clearing a Sandbox rule filter
- Viewing the information of a user-defined Sandbox rule
- Creating a user-defined Sandbox rule for scanning files
- Creating a user-defined Sandbox rule for URL scanning
- Copying a user-defined Sandbox rule
- Importing user-defined Sandbox rules for file scanning
- Editing a user-defined Sandbox rule
- Enabling or disabling user-disabling Sandbox rules
- Exporting user-defined Sandbox rules for file scanning
- Deleting user-defined Sandbox rules
- List of extensions for file categories
- Sending notifications
- Viewing the table of rules for sending notifications
- Creating a rule for sending notifications about alerts
- Creating a rule for sending notifications about the operation of application components
- Enabling and disabling a rule for sending notifications
- Modifying a rule for sending notifications
- Deleting a rule for sending notifications
- Filtering and searching notification forwarding rules by rule type
- Filtering and searching notification forwarding rules based on the notification subject
- Filtering and searching notification forwarding rules by email address
- Filtering and searching notification forwarding rules based on their state
- Clearing a notification forwarding rule filter
- Managing logs
- Viewing application messages
- Viewing information about files that have been sent for scanning to the Kaspersky Anti Targeted Attack Platform
- Managing Kaspersky Endpoint Agent for Windows
- Managing Kaspersky Endpoint Security for Windows
- Managing Kaspersky Endpoint Security for Linux
- Managing Kaspersky Endpoint Security for Mac
- Backing up and restoring data
- Upgrading Kaspersky Anti Targeted Attack Platform
- Upgrading Central Node installed on a server from version 6.1 to 7.0.3
- Upgrading Central Node installed as a cluster from version 6.1 to version 7.0.3
- Preparing to install the upgrade in distributed solution and multitenancy mode
- Upgrading Sensor installed on a standalone server
- Contents and amount of information kept when upgrading the Kaspersky Anti Targeted Attack Platform
- Updating Kaspersky Anti Targeted Attack Platform from version 7.0 to version 7.0.1
- Updating Kaspersky Anti Targeted Attack Platform from version 7.0.1 to version 7.0.3
- Using Kaspersky Anti Targeted Attack Platform API KATA and KEDR
- Integrating an external system with Kaspersky Anti Targeted Attack Platform
- API for scanning objects of external systems
- API that external systems can use to receive information about application alerts
- API that external systems can use to receive information about application events
- API for managing Threat Response actions
- Request for getting the list of hosts with the Endpoint Agent component
- Request for information about network isolation and the existence of prevention rules for hosts with the Kaspersky Endpoint Agent component
- Host network isolation management
- Managing prevention rules
- Managing the application run task
- Using Kaspersky Anti Targeted Attack Platform API NDR
- Sources of information about the application
- Contacting the Technical Support Service
- Glossary
- Advanced persistent threat (APT)
- Alert
- Alternate data stream
- Anti-Malware Engine
- Backdoor program
- Central Node
- Communication channel bandwidth
- CSRF attack
- Detection
- Distributed solution
- Dump
- End User License Agreement
- Endpoint Agent component
- ICAP client
- ICAP data
- Intrusion Detection System
- IOA
- IOC
- IOC file
- Kaspersky Anti Targeted Attack Platform
- Kaspersky Private Security Network
- Kaspersky Secure Mail Gateway
- Kaspersky Security Network (KSN)
- Kaspersky Threat Intelligence Portal
- KATA
- KEDR
- Kerberos authentication
- Keytab file
- Local reputation database of KPSN
- Malicious web addresses
- MIB (Management Information Base)
- Mirrored traffic
- MITM attack
- MITRE technique
- Multitenancy
- New generation threats
- NTP server
- OpenIOC
- Phishing URL addresses
- Sandbox
- Sensor
- Service principal name (SPN)
- SIEM system
- Signature
- SPAN
- Syslog
- TAA (IOA) rule
- Targeted attack
- Targeted Attack Analyzer
- Tenant
- TLS encryption
- Tracing
- VIP status
- YARA
- YARA rules
- Zero-day attack
- Zero-day vulnerability
- Information about third-party code
- Trademark notices
Kaspersky Anti Targeted Attack Platform Help
 New functions
 Hardware and software requirements
- Hardware and software requirements
- Compatibility of the Kaspersky Anti Targeted Attack Platform with the Kaspersky Endpoint Agent for Windows
- Compatibility of the Kaspersky Anti Targeted Attack Platform with the Kaspersky Endpoint Security for Windows, Linux, and Mac
 Licensing
 Getting started
- Distributed solution and multitenancy
- Sizing the Kaspersky Anti Targeted Attack Platform
- Installation and initial configuration of the Kaspersky Anti Targeted Attack Platform
- Configuring the integration of Kaspersky Anti Targeted Attack Platform with the Kaspersky Endpoint Agent component
 Getting started in the Kaspersky Anti Targeted Attack Platform web interface
- Getting started with the application web interface — For administrators
- Getting started with the application web interface — For security officers
 Additional features
 Update
 Contacting the Technical Support Service
Page top
Kaspersky Anti Targeted Attack Platform
Kaspersky Anti Targeted Attack Platform (hereinafter also referred to as "the application") is a solution designed for the protection of a corporate IT infrastructure and timely detection of threats such as zero-day attacks, targeted attacks, and complex targeted attacks known as advanced persistent threats (hereinafter also referred to as "APT"). The solution is developed for corporate users.
The Kaspersky Anti Targeted Attack Platform solution includes three functional blocks:
- Kaspersky Anti Targeted Attack (hereinafter also referred to as "KATA"), which provides perimeter security for the enterprise IT infrastructure.
- Kaspersky Endpoint Detection and Response (hereinafter also referred to as "KEDR"), which provides protection for the local area network of the organization.
- Network Detection and Response (hereinafter also referred to as "NDR"), which provides protection of the corporate LAN.
The solution can receive and process data in the following ways:
- Integrate into the local area network, receive and process mirrored , and extract objects and metadata from the HTTP, HTTP2, FTP, SMTP, DNS, SMB, and NFS protocols.
- Connect to the proxy server via the ICAP protocol, receive and process data of HTTP, HTTP2, and FTP traffic, as well as HTTPS traffic if the administrator has configured SSL certificate replacement on the proxy server.
- Connect to the mail server via the POP3 (S) and SMTP protocols, receive and process copies of e-mail messages.
- Integrate with Kaspersky Secure Mail Gateway and Kaspersky Security for Linux Mail Server, receive, and process copies of email messages.
- Receive and process copies of network traffic obtained from a remote location using the Kaspersky SD-WAN application. This functionality improves the flexibility of detecting and monitoring network activity, allowing you to analyze traffic from different points on the network and take appropriate action to ensure network security.
For detailed information on Kaspersky Secure Mail Gateway, Kaspersky Security for Linux Mail Server and Kaspersky SD-WAN, please refer to the documentation of these applications.
- Integrate with Kaspersky Endpoint Agent and Kaspersky Endpoint Security and receive data (events) from individual computers running Microsoft Windows, Linux, and Mac operating systems in the corporate IT infrastructure. These applications continuously monitor processes running on those computers, active network connections, and files that are modified.
- Integrate with external systems with the use of the REST API interface and scan files on these systems.

The solution uses the following means of Threat Intelligence:
- Infrastructure of Kaspersky Security Network (also referred to as "KSN") cloud services that provides access to the online Knowledge Base of Kaspersky, which contains information about the reputation of files, web resources, and software. The use of data from Kaspersky Security Network ensures faster responses by Kaspersky applications to threats, improves the performance of some protection components, and reduces the likelihood of false alarms.
- Integration with Kaspersky Private Security Network (KPSN) to access the reputation databases of Kaspersky Security Network and other statistical data without sending data from user computers to Kaspersky Security Network.
- Integration with the Kaspersky information system known as Kaspersky Threat Intelligence Portal, which contains and displays information about the reputation of files and URLs.
- IOC (Indicators of Compromise). Kaspersky Anti Targeted Attack Platform uses IOC files conforming to the OpenIOC standard, which is an open standard for describing indicators of compromise. IOC files contain a set of indicators that are compared to the indicators of an event. If the compared indicators match, the application considers the event to be an alert.
- IOA (Indicators of Attack). Kaspersky Anti Targeted Attack Platform scans the Events database of the application and marks events or event chains that match behaviors described by TAA (IOA) rules.
The solution can detect the following events that occur within the corporate IT infrastructure:
- A file has been downloaded or an attempt was made to download a file to a corporate LAN computer.
- A file has been sent to the email address of a user on the corporate LAN.
- A website link was opened on a corporate LAN computer.
- Network activity has occurred in which the IP address or domain name of a corporate LAN computer was detected.
- Processes have been started on a corporate LAN computer.
The application can provide the results of its operation and Threat Intelligence to the user in the following ways:
- Display the results of work done in the web interface of the Central Node, Primary Central Node (hereinafter also PCN) or Secondary Central Node (hereinafter also SCN) servers.
- Publish alerts to a SIEM system already being used in your organization via the Syslog protocol.
- Integrate with external systems via the REST API and send information on alerts generated by the solution to external systems on demand.
- Publish information on Sandbox component alerts in the local reputation database of Kaspersky Private Security Network.
Users with the Senior security officer or Security officer role can perform the following actions in the application:
- Monitor the components of the solution.
- View the table of detected signs of targeted attacks and intrusions into the corporate IT infrastructure, filter and search alerts, view and manage each alert, and follow recommendations for evaluating and investigating incidents.
- Look through the table of events occurring on computers and servers of the corporate IT infrastructure, search for threats, filter, view and manage each event, follow recommendations for evaluating and investigating incidents.
- Run tasks on computers with Kaspersky Endpoint Agent and Kaspersky Endpoint Security: run applications and stop processes, download and delete files, quarantine objects on computers with Kaspersky Endpoint Agent and Kaspersky Endpoint Security, place copies of files in Storage of Kaspersky Anti Targeted Attack Platform, and restore files from quarantine.
- Set up policies for preventing the running of files and processes that they consider to be unsafe on selected computers with Kaspersky Endpoint Agent and Kaspersky Endpoint Security.
- Isolate individual computers with Kaspersky Endpoint Agent and Kaspersky Endpoint Security from the network.
- Work with TAA (IOA) rules to classify and analyze events.
- Manage user-defined Targeted Attack Analyzer TAA (IOA), Intrusion Detection System (IDS), and YARA rules — upload rules to be used for scanning events and creating alerts.
- Work with OpenIOC compliant files (IOC files) to search for signs of targeted attacks, infected and probably infected objects on hosts with the Endpoint Agent component and in the Alerts database.
- Exclude TAA (IOA) rules and IDS rules defined by Kaspersky from scanning.
- Manage objects in quarantine and copies of objects in Storage.
- Manage reports about application performance and alerts.
- Configure the sending of notifications about alerts and problems encountered by the application to email addresses of users.
- Manage the list of VIP alerts and the list of data excluded from the scan, and populate the local reputation database of KPSN.
- Store and download copies of raw network traffic for analysis in external systems.
Users with the Security auditor role can perform the following actions in the application:
- Monitor the components of the solution.
- View the table of detected signs of targeted attacks and intrusions into the enterprise IT infrastructure, filter and search alerts, and view the data of each alert.
- Look through the table of events occurring on the computers and servers of the enterprise IT infrastructure, search for threats, filter and view each event.
- View the list of hosts with the Endpoint Agent component and information about selected hosts.
- View user-defined rules for Targeted Attack Analyzer TAA (IOA), Intrusion Detection System (IDS), and YARA.
- View the scan-excluded TAA (IOA) rules and IDS rules defined by Kaspersky experts.
- View reports about application performance and alerts.
- View the list of VIP alerts and the list of data excluded from the scan.
- View all settings made in the application web interface.
- Store and download copies of raw network traffic for analysis in external systems.
Users with the Administrator role can perform the following actions in the application:
- Edit application settings.
- Configure servers for the distributed solution and multitenancy mode.
- Set up the integration of the application with other applications and systems.
- Manage TLS certificates and set up trusted connections between the Central Node server and the Sandbox server, between Kaspersky Anti Targeted Attack Platform servers and the Endpoint Agent component, and with external systems.
- Manage accounts of application users.
- Monitor application health.
What's new
Kaspersky Anti Targeted Attack Platform 7.0.3 introduces the following new features:
- Improved performance of Kaspersky Anti Targeted Attack Platform
- Fixed errors when displaying information about network sessions.
- Fixed errors that occurred when installing or upgrading Kaspersky Anti Targeted Attack Platform.
- Fixed vulnerabilities in the Suricata module.
- Optimized rules for combining events.
- Fixed the unstable display of virtual machine status.
- Fixed the single sign-on (SSO) authentication error.
- Fixed an error when registering events in network traffic.
- Fixed an error when a user with the Security officer role tries to gain access to sections of custom rules.
- Fixed the display of information about mirrored traffic from SPAN ports in the Dashboard section of the web interface.
Kaspersky Anti Targeted Attack Platform 7.0.1 now has the following new features:
- A download of mirrored traffic is completed correctly even if the next download request arrives before the previous request has completed.
- When searching for network packets for the last hour, all records that match the search criteria are displayed.
- In a cluster configuration, when integrated with a mail server, the error when sending email messages is now fixed.
- Fixed the error of the Embedded Sensor component that occurred after upgrading the Central Node component, which was used in distributed solution or multitenancy mode, to version 7.0.
- Now, when deploying a cluster, you can select the localization language for the NDR functionality.
Kaspersky Anti Targeted Attack Platform 7.0 now has the following new features:
- Now you can connect up to 150 SCN servers to a single PCN server in distributed solution and multitenancy mode.
- Now you can deploy the application in the following virtualization systems: "Brest" virtualization software, "RED Virtualization", zVirt Node.
- Now you can use the following localizations in custom operating system images with no impact on object scanning quality: Chinese (simplified), Arabic, and Spanish (Mexico).
- Now you can manually send files for scanning in Sandbox from hosts on which Kaspersky Endpoint Security for Windows and Kaspersky Endpoint Security for Linux are used in the role of the Endpoint Agent component.
- Now you can create a TAA (IOA) rule based on event search conditions from a YAML file with a Sigma rule.
- Expanded list of fields available for event search in source code mode in the Threat Hunting section.
- Expanded functionality for the Endpoint Agent represented by Kaspersky Endpoint Security for Windows 12.7:
- New event types supported: Code injection, Named pipe, WMI, LDAP, DNS, Process access.
- New subtypes of the File modified event: File read, Hard link created, Symbolic link created.
- New subtypes of the Registry modified event: Registry key renamed, Registry key saved.
- New fields for the Module loaded and Connection to remote host events.
- Expanded functionality for the Endpoint Agent represented by Kaspersky Endpoint Security for Linux 12.2:
- New event types: Connection to remote host, Port listened, Module loaded, DNS, Process access.
- New subtype of the File modified event: File read.
- Now you can quarantine an object.
- Now you can create prevention rules.
- Now you can enforce the user account password change.
- Scanning of encrypted archives downloaded from an URL in an email message is now supported.
- Now you can apply response actions to multiple devices.
- Expanded NDR functionality:
- Now you can view events in network traffic.
- The table of alerts now displays External Analysis alerts.
- Added an inventory of devices on the local network of the organization.
- Now you can view the following device information:
- User accounts registered in the operating systems of the devices.
- File execution on devices.
- Address spaces of devices.
- Now you can display risks associated with devices.
- Dynamic IP addressing of devices is now supported.
- Now you can monitor the network activity of devices on the network map.
- Devices can now be actively polled to enrich information in the list of devices and build the network topology map.
- Added the ability to analyze network sessions.
- Now you can identify the name of the transport protocol that was used in a network session.
- Now you can identify the name of the application-layer protocol that was used in a network session.
- Now you can find sessions by network packets in the traffic storage, as well as download the data of individual network packets and sessions to a file.
- New types of reports.
- Updated logic for managing custom IDS rules.
- Different ports are now used for the interaction between the Central Node and Sensor components:
- For the Central Node server, inbound connections must be allowed to TCP ports 13520 and 7423.
- For the Sensor server, outbound connections to TCP ports 13520 and 7423 and inbound connections to TCP port 9443 must be allowed.
- In the distributed solution and multitenancy mode, you must enable inbound and outbound connections for TCP ports 11000:11006 on PCN and SCN servers.
Changes in Kaspersky Endpoint Agent 3.16 for Windows:
You can view the list of changes in Kaspersky Endpoint Agent 3.16 for Windows in the Kaspersky Endpoint Agent for Windows Online Help.
Changes in Kaspersky Endpoint Security 12.7 for Windows:
You can view the list of changes in Kaspersky Endpoint Security 12.5 for Windows in the Kaspersky Endpoint Security for Windows Online Help.
Changes in Kaspersky Endpoint Security 12.2 for Linux:
You can view the list of changes in Kaspersky Endpoint Security 12 for Linux in the Kaspersky Endpoint Security for Linux Online Help.
About Kaspersky Threat Intelligence Portal
For additional information about files that you consider to be suspicious, you can go to the website of the Kaspersky application Kaspersky Threat Intelligence Portal, which analyzes each file for malicious code and shows information about the reputation of the file.
Access to the Kaspersky Threat Intelligence application is provided for a fee. Authorization on the application website requires that an application access certificate is installed in the certificate storage on your computer. In addition, you must have a user name and password for access to the application.
For more details about the Kaspersky Threat Intelligence Portal, please visit the Kaspersky website.
Distribution kit
The Kaspersky Anti Targeted Attack Platform distribution kit includes the following files:
- Disk image (file with the iso extension) containing the installation files for the Ubuntu Server 22.04 operating system and for the Sensor, Central Node, Sandbox components.
- Archive (.tar.gz file) of the Sensor, Central Node components for creating an iso image based on Astra Linux Special Edition 1.7.5.
- Archive (.tar.gz file) of the Sandbox component for creating an iso image based on Astra Linux Special Edition 1.7.5.
- Disk images (.iso files) of operating systems in which the Sandbox component runs files.
- Utility (.tar file) for creating an iso image based on Astra Linux Special Edition 1.7.5.
- Update package for the Central Node component based on the Ubuntu and Astra Linux operating systems.
- File with information about third-party code used in Kaspersky Anti Targeted Attack Platform.
The Kaspersky Endpoint Agent distribution kit includes the following files:
Kaspersky Endpoint Agent distribution kit
File |
Description |
|---|---|
|
Kaspersky Endpoint Agent installation package. |
|
File for creating Kaspersky Endpoint Agent installation package using Kaspersky Security Center. |
|
Installation package for Kaspersky Endpoint Agent Management administration plug-in for Kaspersky Security Center. |
|
Configuration file required for creating installation package for English version of Kaspersky Endpoint Agent using Kaspersky Security Center. |
|
Configuration file required for creating installation package for Russian version of Kaspersky Endpoint Agent using Kaspersky Security Center. |
|
File with the text of the terms of participation in Kaspersky Security Network in English. |
|
File with the text of the End User License Agreement and the Privacy Policy in English. |
|
File with the text of the Release Notes for Kaspersky Endpoint Agent in English. |
|
File with the text of the terms of participation in Kaspersky Security Network in Russian. |
|
File with the text of the End User License Agreement and the Privacy Policy in Russian. |
|
File with the text of the Release Notes for Kaspersky Endpoint Agent in Russian. |
Hardware and software requirements
Software requirements for virtual platforms for installing Kaspersky Anti Targeted Attack Platform
You can deploy the application on the following virtual platforms:
- VMware ESXi 6.7.0 or 7.0
- "Brest" 3.3 virtualization software
- "RED Virtualization" 7.3
- zVirt Node 4.2
When deploying the application on a VMware ESXI virtual platform, you must install the current update package for the hypervisor.
If you want to deploy the application on the Astra Linux operating system in a VMware ESXI hypervisor, you need to ensure that the server hardware you are using is compatible with the Astra Linux operating system. For a full list of supported server hardware, please refer to the Astra Linux developer website.
When deploying the application on the "Brest", zVirt Node, and "RED Virtualization" virtual platforms, the following limitations apply:
- If you want to use the Sandbox component on the "Brest" virtual platform, zVirt Node, or "RED Virtualization", you must additionally configure the time for scanning objects using the component to increase the probability of detection. To configure it, please contact Technical Support.
- High availability deployment of the application is not supported on zVirt Node or "RED Virtualization" virtual platforms.
For the Central Node, Sensor and Sandbox hardware requirements see the Sizing Guide.
Hardware and software requirements for installing the Endpoint Agent component
The hardware and software requirements of the Endpoint Agent component reflect the hardware and software requirements of the applications that act as the Endpoint Agent component, and are described in the documentation of these applications:
- Kaspersky Endpoint Agent for Windows.
- Kaspersky Endpoint Security for Windows.
- Kaspersky Endpoint Security for Linux.
- Kaspersky Endpoint Security for Mac.
Hardware and software requirements for using the web interface of Kaspersky Anti Targeted Attack Platform
One of the following browsers must be installed on the computers in order to configure and manage the application using the web interface:
- Mozilla Firefox for Linux.
- Mozilla Firefox for Windows.
- Google Chrome for Windows.
- Google Chrome for Linux.
- Edge (Windows).
- Safari (Mac).
Minimum screen resolution to use web interface: 1366x768.
Compatibility of Kaspersky Endpoint Agent for Windows versions with Kaspersky Anti Targeted Attack Platform versions
The Kaspersky Endpoint Agent application uses predefined settings that determine the impact that it has on the performance of the local computer under scenarios of information retrieval and interaction with the Central Node component.
If the version of Kaspersky Anti Targeted Attack Platform installed on Central Node servers is incompatible with the version of Kaspersky Endpoint Agent installed on computers on the corporate LAN, the functionality of Kaspersky Anti Targeted Attack Platform may be limited.
Information about the compatibility of Kaspersky Endpoint Agent component versions with Kaspersky Anti Targeted Attack Platform versions is listed in the table below.
Compatibility of Kaspersky Endpoint Agent for Windows versions with Kaspersky Anti Targeted Attack Platform versions
Version of |
Type |
Compatibility |
Compatibility |
Compatibility |
Compatibility |
Compatibility |
Compatibility |
Compatibility |
|---|---|---|---|---|---|---|---|---|
Endpoint Agent |
Standalone installation |
Yes |
There are limitations |
There are limitations |
There are limitations |
There are limitations |
There are limitations |
There are limitations |
Endpoint Agent |
Standalone installation |
There are limitations |
Yes |
There are limitations |
There are limitations |
There are limitations |
There are limitations |
There are limitations |
Endpoint Agent |
Standalone installation |
There are limitations |
There are limitations |
Yes |
Yes |
Yes |
There are limitations |
There are limitations |
Endpoint Agent |
Standalone installation |
No |
No |
Yes |
Yes |
Yes |
There are limitations |
There are limitations |
Endpoint Agent |
Standalone installation |
No |
No |
No |
No |
Yes |
Yes |
There are limitations |
Endpoint Agent |
Standalone installation |
No |
No |
No |
No |
No |
Yes |
There are limitations |
Limited compatibility of Kaspersky Endpoint Agent for Windows versions with Kaspersky Anti Targeted Attack Platform versions
- Integration of Kaspersky Endpoint Agent 3.12 with Kaspersky Anti Targeted Attack Platform 4.1.
The scope of data sent by Kaspersky Endpoint Agent is limited:
- Scanning autorun points using the Start YARA scan task is not supported.
- The tasks Get NTFS metafiles, Get process memory dump, Get registry key are not supported.
- Integration of Kaspersky Endpoint Agent 3.12 with Kaspersky Anti Targeted Attack Platform 5.0–6.1.
The scope of data sent by Kaspersky Endpoint Agent is limited:
- Scanning autorun points using the Start YARA scan task is not supported.
- The following tasks are not supported: Get NTFS metafiles, Get process memory dump, Get registry key, Get disk image, Get memory dump.
- Event information is not transmitted for the Process terminated event.
- Integration of Kaspersky Endpoint Agent 3.12 with Kaspersky Anti Targeted Attack Platform 7.0.
The scope of data sent by Kaspersky Endpoint Agent is limited:
- Scanning autorun points using the Start YARA scan task is not supported.
- The following tasks are not supported: Get NTFS metafiles, Get process memory dump, Get registry key, Get disk image, Get memory dump.
- Information about the following events is not transmitted: Process terminated, Named pipe, WMI, LDAP, DNS, Process access.
- For the File modified event, information about the following subtypes is not transmitted: File read, Hard link created, Symbolic link created.
- For the Registry modified event, information about the following subtypes is not transmitted: Registry key renamed, Registry key saved.
- Integration of Kaspersky Endpoint Agent 3.13 with Kaspersky Anti Targeted Attack Platform 4.0.
A server of this Kaspersky Anti Targeted Attack Platform version can receive a limited scope of data from the Kaspersky Endpoint Agent application: Get NTFS metafiles, Get process memory dump, Get registry key tasks cannot be created in the web interface of the application.
- Integration of Kaspersky Endpoint Agent 3.13 with Kaspersky Anti Targeted Attack Platform 4.1–6.1.
Kaspersky Endpoint Agent does not support the creation of the following tasks: Get disk image, Get memory dump.
- Integration of Kaspersky Endpoint Agent 3.14 with Kaspersky Anti Targeted Attack Platform 4.0.
The server of this Kaspersky Anti Targeted Attack Platform version can receive a limited scope of data from the Kaspersky Endpoint Agent application: creation of Get NTFS metafiles, Get process memory dump, Get registry key, Get disk image, Get memory dump tasks is not available in the web interface of the application.
- Integration of Kaspersky Endpoint Agent 3.14 with Kaspersky Anti Targeted Attack Platform 4.1.
A server of this Kaspersky Anti Targeted Attack Platform version can receive a limited scope of data from the Kaspersky Endpoint Agent application: the tasks Get disk image and Get memory dump cannot be created in the web interface of the application.
- Integration of Kaspersky Endpoint Agent 3.12–4.0 with Kaspersky Anti Targeted Attack Platform 7.0.
The scope of data sent by Kaspersky Endpoint Agent is limited:
- Information about the following events is not transmitted: Named pipe, WMI, LDAP, DNS, Process access.
- For the File modified event, information about the following subtypes is not transmitted: File read, Hard link created, Symbolic link created.
- For the Registry modified event, information about the following subtypes is not transmitted: Registry key renamed, Registry key saved.
Compatibility of Kaspersky Endpoint Agent for Windows versions with EPP applications
If you want to use the Kaspersky Endpoint Agent application as the Endpoint Agent component, you can install just the Kaspersky Endpoint Agent, or configure the integration of Kaspersky Endpoint Agent with workstation protection applications (Endpoint Protection Platform, hereinafter also "EPP"), Kaspersky Endpoint Security for Windows, Kaspersky Security for Windows Server, and Kaspersky Security for Virtualization Light Agent. If the integration of applications is configured, Kaspersky Endpoint Agent also sends the information about threats detected by EPP applications and their processing results to the Central Node server.
The integration scenarios described above do not work when Kaspersky Endpoint Agent is installed on a virtual desktop in Virtual Desktop Infrastructure.
Integration of Kaspersky Endpoint Agent with Kaspersky Endpoint Security for Windows and Kaspersky Security for Windows Server requires installing Kaspersky Endpoint Agent as part of those applications.
Compatibility of Kaspersky Endpoint Agent for Windows with versions of Kaspersky Security for Windows Server
You can install the following versions of Kaspersky Endpoint Agent as part of Kaspersky Security for Windows Server:
- Kaspersky Endpoint Agent 3.9 as part of Kaspersky Security 11 for Windows Server.
- Kaspersky Endpoint Agent 3.10 as part of Kaspersky Security 11.0.1 for Windows Server.
When you install Kaspersky Endpoint Agent as part of Kaspersky Security for Windows Server, the standalone Kaspersky Endpoint Agent of the same or earlier version is removed. If Kaspersky Endpoint Agent installed as part of Kaspersky Security for Windows Server has an earlier version, it will not be installed. In this case, you must first remove the standalone Kaspersky Endpoint Agent application.
If necessary, you can upgrade the Kaspersky Endpoint Agent application that is already installed as part of Kaspersky Security for Windows Server. Integration between compatible versions of the applications is maintained both when Kaspersky Endpoint Agent is upgraded and when Kaspersky Security for Windows Server is upgraded.
Information about the compatibility of Kaspersky Endpoint Agent versions with Kaspersky Security for Windows Server versions is listed in the table below.
Compatibility of Kaspersky Endpoint Agent versions with Kaspersky Security for Windows Server versions
Kaspersky Security for Windows Server version |
Compatibility with Endpoint Agent 3.8, 3.9, 3.10 |
Compatibility with Endpoint Agent 3.11, 3.12 |
Compatibility with Endpoint Agent 3.13, 3.14, 3.15, 3.16 |
|---|---|---|---|
|
Yes |
No |
No |
|
Yes |
Yes |
No |
|
No |
Yes |
There are limitations |
When integrating with Kaspersky Endpoint Agent 3.13–3.16, Kaspersky Security for Windows Server does not transmit event information of the AMSI scan event.
For more details about installing Kaspersky Security for Windows Server, see Kaspersky Security for Windows Server Help.
Compatibility of Kaspersky Endpoint Agent for Windows with versions of Kaspersky Endpoint Security for Windows
You can install the following versions of Kaspersky Endpoint Agent (Endpoint Sensors) as part of Kaspersky Endpoint Security for Windows:
- Kaspersky Endpoint Agent 3.7 or Kaspersky Endpoint Agent (Endpoint Sensors) 3.6.1 as part of Kaspersky Endpoint Security 11.2, 11.3 for Windows.
Kaspersky Endpoint Agent (Endpoint Sensors) 3.6.1 is not compatible with Kaspersky Anti Targeted Attack Platform version 4.1 or higher.
Kaspersky Endpoint Agent 3.7 is not compatible with all versions of Kaspersky Anti Targeted Attack Platform.
- Kaspersky Endpoint Agent 3.9 as part of Kaspersky Endpoint Security 11.4, 11.5.
- Kaspersky Endpoint Agent 3.10 as part of Kaspersky Endpoint Security 11.6.
- Kaspersky Endpoint Agent 3.11 as part of Kaspersky Endpoint Security 11.7, 11.8.
When you install Kaspersky Endpoint Agent 3.10 or later as part of Kaspersky Endpoint Security for Windows, the standalone Kaspersky Endpoint Agent application of the same or earlier version is removed. If the separately installed Kaspersky Endpoint Agent has a later version, the application bundled with Kaspersky Endpoint Security for Windows is not installed. In this case, you must first remove the standalone Kaspersky Endpoint Agent application.
If necessary, you can upgrade the Kaspersky Endpoint Agent application that is already installed as part of Kaspersky Endpoint Security for Windows. Integration between compatible versions of the applications is maintained both when Kaspersky Endpoint Agent is upgraded and when Kaspersky Endpoint Security for Windows is upgraded. You can upgrade a previous version of Kaspersky Endpoint Agent to version 3.14 only for Kaspersky Endpoint Agent version 3.7 or higher.
Information about the compatibility of Kaspersky Endpoint Agent versions with Kaspersky Endpoint Security for Windows versions is listed in the table below.
Compatibility of Kaspersky Endpoint Agent versions with Kaspersky Endpoint Security for Windows versions
Kaspersky Endpoint Security version |
Compatibility with Endpoint Agent 3.8, 3.9 |
Compatibility with Endpoint Agent 3.10, 3.12 |
Compatibility with Endpoint Agent 3.11 |
Compatibility with Endpoint Agent 3.13, 3.14, 3.15, 3.16 |
|---|---|---|---|---|
|
No |
No |
No |
No |
|
Yes |
No |
No |
No |
|
No |
No |
No |
No |
|
Yes |
No |
No |
No |
|
Yes |
Yes |
No |
No |
|
Yes |
Yes |
Yes |
No |
|
Yes |
Yes |
Yes |
No |
|
Yes |
Yes |
Yes |
Yes |
|
No |
No |
No |
No |
For more details about installing Kaspersky Endpoint Security, see Kaspersky Endpoint Security for Windows Help.
Compatibility of Kaspersky Endpoint Agent with versions of Kaspersky Security for Virtualization Light Agent
You can configure the integration of separately installed Kaspersky Endpoint Agent and Kaspersky Security for Virtualization Light Agent.
Information about the compatibility of Kaspersky Endpoint Agent versions with Kaspersky Security for Virtualization Light Agent versions is listed in the table below.
Compatibility of Kaspersky Endpoint Agent versions and Kaspersky Security for Virtualization Light Agent versions
Kaspersky Security for Virtualization Light Agent version |
Compatibility with Endpoint Agent 3.8, 3.9, 3.10 |
Compatibility with Endpoint Agent 3.12 |
Compatibility with Endpoint Agent 3.11, 3.13, 3.14 |
Compatibility with Endpoint Agent 3.15 |
Compatibility with Endpoint Agent 3.16 |
|---|---|---|---|---|---|
|
Yes |
Yes |
No |
No |
No |
|
Yes |
No |
No |
No |
No |
|
No |
Yes |
Yes |
Yes |
Yes |
|
No |
Yes |
Yes |
Yes |
No |
Kaspersky Endpoint Agent and Kaspersky Security for Virtualization Light Agent installed on a virtual machine generate the same load on the Central Node server as Kaspersky Endpoint Agent and Kaspersky Security for Virtualization Light Agent installed on the host.
For more details about enabling the integration of Kaspersky Endpoint Agent with Kaspersky Security for Virtualization Light Agent, see Kaspersky Security for Virtualization Light Agent Help.
Compatibility of Kaspersky Endpoint Agent with versions of Kaspersky Industrial CyberSecurity for Nodes
You can install Kaspersky Endpoint Agent on a device with Kaspersky Industrial CyberSecurity for Nodes installed. The applications are integrated automatically.
Compatibility of Kaspersky Endpoint Agent versions with versions of Kaspersky Industrial CyberSecurity for Nodes
Kaspersky Industrial CyberSecurity for Nodes version |
Compatibility with Endpoint Agent 3.11, 3.12 |
Compatibility with Endpoint Agent 3.13, 3.14, 3.15 |
Compatibility with Endpoint Agent 3.16 |
|---|---|---|---|
|
Yes |
Yes |
Yes |
|
No |
Yes |
Yes |
|
No |
No |
Yes |
To integrate with Kaspersky Industrial CyberSecurity for Nodes, the corresponding license key must be installed in the Kaspersky Endpoint Agent.
For detailed information, you can contact your account manager.
Page top
Compatibility of Kaspersky Endpoint Security for Windows versions with Kaspersky Anti Targeted Attack Platform versions
You can use Kaspersky Endpoint Security as the Endpoint Agent component.
Information about the compatibility of Kaspersky Endpoint Security versions with Kaspersky Anti Targeted Attack Platform versions is listed in the table below.
Compatibility of Kaspersky Endpoint Security for Windows versions with Kaspersky Anti Targeted Attack Platform versions
Kaspersky Endpoint Security |
Compatibility |
Compatibility |
Compatibility |
Compatibility |
Compatibility |
Compatibility |
Compatibility |
|---|---|---|---|---|---|---|---|
Kaspersky Endpoint Security |
No |
Yes |
Yes |
Yes |
Yes |
No |
There are limitations |
Kaspersky Endpoint Security |
No |
Yes |
Yes |
Yes |
Yes |
Yes |
There are limitations |
Kaspersky Endpoint Security |
No |
No |
Yes |
Yes |
Yes |
Yes |
There are limitations |
Kaspersky Endpoint Security |
No |
No |
There are limitations |
There are limitations |
There are limitations |
There are limitations |
Yes |
To integrate Kaspersky Endpoint Security 12.1 or later with Kaspersky Anti Targeted Attack Platform, you do not need to install Kaspersky Endpoint Agent.
Starting from version 12.8, Kaspersky Endpoint Security for Windows can be used as the Light Agent for Windows component for the Kaspersky Security for Virtualization application. For more details about the integration, see Kaspersky Security for Virtualization Light Agent Help.
Limited compatibility of Kaspersky Endpoint Security for Windows versions with Kaspersky Anti Targeted Attack Platform versions
- Integration of Kaspersky Endpoint Security 12.1–12.6 with Kaspersky Anti Targeted Attack Platform 7.0.
The scope of data sent by Kaspersky Endpoint Security is limited:
- Information about the following events is not transmitted: DNS, Code injection, Named pipe, WMI, LDAP.
- For the File modified event, information about the following subtypes is not processed: File read, Hard link created, Symbolic link created.
- For the Registry modified event, information about the following subtypes is not processed: Registry key renamed, Registry key saved.
- New fields are not available for the Module loaded and Connection to remote host events.
- Integration of Kaspersky Endpoint Security 12.7–12.8 with Kaspersky Anti Targeted Attack Platform 5.1–6.1.
The server of these Kaspersky Anti Targeted Attack Platform versions can receive a limited scope of data from the Kaspersky Endpoint Security application:
- Information about the following events is not processed: Named pipe, WMI, LDAP, DNS, Code injection.
- For the File modified event, information about the following subtypes is not processed: File read, Hard link created, Symbolic link created.
- For the Registry modified event, information about the following subtypes is not processed: Registry key renamed, Registry key saved.
- New fields are not available for the Module loaded and Connection to remote host events.
Compatibility of Kaspersky Endpoint Security for Linux versions with Kaspersky Anti Targeted Attack Platform versions
You can use Kaspersky Endpoint Security as the Endpoint Agent component.
Information about the compatibility of Kaspersky Endpoint Security versions with Kaspersky Anti Targeted Attack Platform versions is listed in the table below.
Compatibility of Kaspersky Endpoint Security for Linux versions with Kaspersky Anti Targeted Attack Platform versions
Kaspersky Endpoint Security |
Compatibility |
Compatibility |
Compatibility |
Compatibility |
Compatibility |
Compatibility |
Compatibility |
|---|---|---|---|---|---|---|---|
Kaspersky Endpoint Security |
No |
No |
No |
There are limitations |
There are limitations |
There are limitations |
There are limitations |
Kaspersky Endpoint Security |
No |
No |
There are limitations |
There are limitations |
There are limitations |
There are limitations |
There are limitations |
Kaspersky Endpoint Security |
No |
No |
No |
There are limitations |
There are limitations |
There are limitations |
There are limitations |
Kaspersky Endpoint Security |
No |
No |
No |
No |
There are limitations |
There are limitations |
There are limitations |
To integrate Kaspersky Endpoint Security with Kaspersky Anti Targeted Attack Platform, you do not need to install the Kaspersky Endpoint Agent.
Starting from version 12, Kaspersky Endpoint Security for Linux can be used as the Light Agent for Linux component for the Kaspersky Security for Virtualization application. For more details about the integration, see Kaspersky Security for Virtualization Light Agent Help.
When Kaspersky Endpoint Security for Linux is used as the Light Agent for Linux component, the integration of Kaspersky Endpoint Security for Linux with Kaspersky Anti Targeted Attack Platform is retained.
Limited compatibility of Kaspersky Endpoint Security for Linux versions with Kaspersky Anti Targeted Attack Platform versions
- Integration of Kaspersky Endpoint Security 11.4 with Kaspersky Anti Targeted Attack Platform 5.1–6.1.
The scope of data sent by Kaspersky Endpoint Security is limited:
- Creation of network isolation rules is not supported.
- Creation of prevention rules is not supported.
- Searching for indicators of compromise on computers using IOC files is not supported.
- Event information is not transmitted for the following events: Process terminated, Module loaded, Connection to remote host, Blocked application (prevention rule), Document blocked, Registry modified, Port listened, Driver loaded, Process: interpreted file run, Process: console interactive input, AMSI scan.
- Creation of the following tasks is not supported: Kill process, Get forensics, Start YARA scan, Delete file, Quarantine file, Restore file from quarantine, Manage services, Get disk image, Get memory dump.
- Integration of Kaspersky Endpoint Security 12, 12.1, 12.2 with Kaspersky Anti Targeted Attack Platform 6.0–6.1.
The scope of data sent by Kaspersky Endpoint Security is limited:
- Event information is not transmitted for the following events: Process terminated, Module loaded, Connection to remote host, Blocked application (prevention rule), Document blocked, Registry modified, Port listened, Driver loaded, Process: interpreted file run, Process: console interactive input, AMSI scan.
- Creation of the following tasks is not supported: Get forensics, Start YARA scan, Quarantine file, Restore file from quarantine, Manage services, Get disk image, Get memory dump.
- Integration of Kaspersky Endpoint Security 12.1 with Kaspersky Anti Targeted Attack Platform 5.1.
The scope of data sent by Kaspersky Endpoint Security is limited:
- Creation of prevention rules is not supported.
- Event information is not transmitted for the following events: Process terminated, Module loaded, Connection to remote host, Blocked application (prevention rule), Document blocked, Registry modified, Port listened, Driver loaded, Process: interpreted file run, Process: console interactive input, AMSI scan.
- Creation of the following tasks is not supported: Get forensics, Get registry key, Get NTFS metafiles, Get process memory dump, Get disk image, Get memory dump, Kill process, Start YARA scan, Manage services, Quarantine file, Restore file from quarantine.
- Integration of Kaspersky Endpoint Security 11.4 with Kaspersky Anti Targeted Attack Platform 7.0.
The scope of data sent by Kaspersky Endpoint Security is limited:
- Creation of network isolation rules is not supported.
- Creation of prevention rules is not supported.
- Searching for indicators of compromise on computers using IOC files is not supported.
- Event information is not transmitted for the following events: Process terminated, Module loaded, Connection to remote host, Blocked application (prevention rule), Document blocked, Registry modified, Port listened, Driver loaded, Process: interpreted file run, Process: console interactive input, AMSI scan, Named pipe, WMI, LDAP.
- Creation of the following tasks is not supported: Kill process, Get forensics, Start YARA scan, Delete file, Quarantine file, Restore file from quarantine, Manage services, Get disk image, Get memory dump.
- Integration of Kaspersky Endpoint Security 12, 12.1, 12.2 with Kaspersky Anti Targeted Attack Platform 7.0.
The scope of data sent by Kaspersky Endpoint Security is limited:
- Event information is not transmitted for the following events: Process terminated, Module loaded, Connection to remote host, Blocked application (prevention rule), Document blocked, Registry modified, Port listened, Driver loaded, Process: interpreted file run, Process: console interactive input, AMSI scan, Named pipe, WMI, LDAP.
- Creation of the following tasks is not supported: Get forensics, Start YARA scan, Quarantine file, Restore file from quarantine, Manage services, Get disk image, Get memory dump.
Compatibility of Kaspersky Endpoint Security for Mac with Kaspersky Anti Targeted Attack Platform versions
You can use Kaspersky Endpoint Security for Mac as the Endpoint Agent component.
Information about the compatibility of Kaspersky Endpoint Security for Mac versions with Kaspersky Anti Targeted Attack Platform versions is listed in the table below.
Compatibility of Kaspersky Endpoint Security for Mac with Kaspersky Anti Targeted Attack Platform versions
Kaspersky Endpoint Security |
Compatibility |
Compatibility |
Compatibility |
Compatibility |
Compatibility |
Compatibility |
Compatibility |
|---|---|---|---|---|---|---|---|
Kaspersky Endpoint Security |
No |
No |
No |
No |
There are limitations |
There are limitations |
There are limitations |
Kaspersky Endpoint Security |
No |
No |
No |
No |
There are limitations |
There are limitations |
There are limitations |
Limited compatibility of Kaspersky Endpoint Security for Mac versions with Kaspersky Anti Targeted Attack Platform versions
- Integration of Kaspersky Endpoint Security 12–12.1 with Kaspersky Anti Targeted Attack Platform 6.0–6.1.
- Creation of network isolation rules is not supported.
- Creation of prevention rules is not supported.
- Searching for indicators of compromise on computers using IOC files is not supported.
- Event information is not transmitted for the following events: Process terminated, Module loaded, Connection to remote host, Blocked application (prevention rule), Document blocked, Registry modified, Port listened, Driver loaded, Process: interpreted file run, Process: console interactive input, AMSI scan.
- Creation of the following tasks is not supported: Kill process, Get forensics, Start YARA scan, Delete file, Quarantine file, Restore file from quarantine, Manage services, Get disk image, Get memory dump.
- Integration of Kaspersky Endpoint Security 12–12.1 with Kaspersky Anti Targeted Attack Platform 7.0.
The scope of data sent by Kaspersky Endpoint Security is limited:
- Creation of network isolation rules is not supported.
- Creation of prevention rules is not supported.
- Searching for indicators of compromise on computers using IOC files is not supported.
- Event information is not transmitted for the following events: Module loaded, Connection to remote host, Blocked application (prevention rule), Document blocked, Registry modified, Port listened, Driver loaded, Process: interpreted file run, Process: console interactive input, AMSI scan, DNS, Code injection, Named pipe, WMI, LDAP.
- Creation of the following tasks is not supported: Kill process, Get forensics, Start YARA scan, Delete file, Quarantine file, Restore file from quarantine, Manage services, Get disk image, Get memory dump.
Compatibility of KUMA versions with versions of Kaspersky Anti Targeted Attack Platform
You can use KUMA as a SIEM system.
Information about the compatibility of KUMA versions with Kaspersky Anti Targeted Attack Platform versions is listed in the table below.
Compatibility of KUMA versions with versions of Kaspersky Anti Targeted Attack Platform
KUMA |
Compatibility |
Compatibility |
Compatibility |
Compatibility |
Compatibility |
Compatibility |
|---|---|---|---|---|---|---|
KUMA 2.0 |
Yes |
Yes |
No |
No |
No |
No |
KUMA 2.1 |
No |
Yes |
Yes |
Yes |
No |
No |
KUMA 3.0.2 |
No |
No |
No |
Yes |
Yes |
No |
KUMA 3.0.3 |
No |
No |
No |
Yes |
Yes |
No |
KUMA 3.2 |
No |
No |
No |
Yes |
Yes |
No |
KUMA 3.3 |
No |
No |
No |
No |
No |
Yes |
KUMA 3.4 |
No |
No |
No |
No |
No |
Yes |
Compatibility of XDR versions with versions of Kaspersky Anti Targeted Attack Platform
You can use XDR as a SIEM system.
Information about the compatibility of XDR versions with Kaspersky Anti Targeted Attack Platform versions is listed in the table below.
Compatibility of XDR versions with versions of Kaspersky Anti Targeted Attack Platform
XDR |
Compatibility |
Compatibility |
Compatibility |
Compatibility |
Compatibility |
Compatibility |
|---|---|---|---|---|---|---|
XDR |
No |
No |
Yes |
Yes |
Yes |
No |
XDR |
No |
No |
No |
No |
Yes |
Yes |
Compatibility of KPSN versions with versions of Kaspersky Anti Targeted Attack Platform
You can use Kaspersky Private Security Network (KPSN) instead of Kaspersky Security Network (KSN) to avoid sending your organization's data beyond the corporate LAN.
Information about the compatibility of KPSN versions with Kaspersky Anti Targeted Attack Platform versions is listed in the table below.
Compatibility of KPSN versions with versions of Kaspersky Anti Targeted Attack Platform
KPSN |
Compatibility |
Compatibility |
Compatibility |
Compatibility |
Compatibility |
Compatibility |
|---|---|---|---|---|---|---|
KPSN |
Yes |
Yes |
Yes |
Yes |
Yes |
No |
KPSN |
No |
No |
No |
Yes |
Yes |
Yes |
KPSN |
No |
No |
No |
No |
Yes |
Yes |
Compatibility of Kaspersky Anti Targeted Attack Platform with VK Cloud
Kaspersky Anti Targeted Attack Platform supports deployment on the VK Cloud platform.
When deploying the application, you can connect Sandbox components to the Central Node component.
The following restrictions apply when deploying Kaspersky Anti Targeted Attack Platform for integration with VK Cloud:
- Only the KATA functional block is supported.
- Only the certified version of the application based on Astra Linux is supported.
- Only the non-high-availability version of the application is supported.
- You can configure integration only with an external KSMG system. For more details on integration, see KSMG Help.
- You can use the distributed solution mode only if you are using the KSMG integration.
For the Sandbox component to work, the following requirements must be met:
- Nested virtualization must be enabled for the virtual machine.
- The network interface settings must be correctly configured to provide Internet access to objects being processed.
Windows images can only be activated if the network interface is configured correctly.
- The network interface used for Internet access of processed objects must be isolated from the local network of your organization.
- The network interface used by processed objects for Internet access must be connected to a subnet that is not the same as the subnet to which the control interface is connected.
- We do not recommend using a static public IP address for the network interface that handles Internet access of the objects being processed.
Limitations
Kaspersky Anti Targeted Attack Platform 7.0.3 has the following known limitations:
- Sigma rules relying on data sources other than System Monitor (Sysmon) and Windows Event Log are not supported.
- Correlation Sigma rules are not supported.
- As part of integration with the NDR functional block, up to 1000 Endpoint Agent components can be connected to a single Central Node component. If you want to connect more components, please contact Technical Support.
- In a file alert created based on the results of scanning a copy of web traffic, the User name field is empty if the user is authenticated on the proxy server with basic authentication.
- Information about the Endpoint Agent component is not displayed in the Processed widget on the Dashboard.
- After upgrading Central Node deployed as a cluster, the alerts table may not display new alerts generated by the IDS technology. You can check whether the limitation applies to you and take steps to fix it, if necessary. For details, see the Updating Kaspersky Anti Targeted Attack Platform from version 7.0.1 to version 7.0.3 section
- Upgrading the Central Node component from version 6.1 fails if processing of mirrored SPAN traffic is disabled in the version of the component that is being upgraded. To fix this limitation, we strongly recommend following steps 1 of the Updating Central Node installed as a cluster and 4 of the Upgrading a Central Node installed on a server instructions.
- In rare cases, upgrading from version 7.0.1 to version 7.0.3 of Central Node deployed as a cluster based on the Astra Linux operating system may fail with the error "Upgrade has failed on task UpdateSizing".
Resolving the "Upgrade has failed on task UpdateSizing" error
- After upgrading from version 6.1 to version 7.0.3 of Central Node deployed as a cluster based on the Astra Linux operating system, telemetry search in the Threat Hunting section may not work.
Resolving an "Internal error" that occurs when searching for event data
- When installing the Central Node component of version 7.0.3 on the server, Kaspersky Anti Targeted Attack Platform may refuse email messages received via SMTP. The sender may get a "Connection refused" error. You can remove this limitation. For details, see the Configuring integration with a mail server via SMTP section.
Kaspersky Anti Targeted Attack Platform 7.0 has the following known limitations:
- Sigma rules relying on data sources other than System Monitor (Sysmon) and Windows Event Log are not supported.
- Correlation Sigma rules are not supported.
- As part of integration with the NDR functional block, up to 1000 Endpoint Agent components can be connected to a single Central Node component. If you want to connect more components, please contact Technical Support.
- An error may occur when downloading mirrored traffic if the user has not waited for an already started download process to end.
- When searching network packets for the last hour, no more than 200 records are displayed, even if the system has more matching records. We recommend refining the search query to get a selection with fewer sessions.
Limitations do not apply to traffic dump downloading.
- For a cluster configuration, when integrated with a mail server, an error may occur when sending an email message: "451 4.3.0 Error: queue file write error". For information on how to remove the limitation, see the Configuring integration with a mail server via SMTP section.
- Embedded Sensor may be missing after upgrading to version 7.0 a Central Node component that had been used in the distributed solution or multitenancy mode. For information on how to remove the limitation, see the Upgrading Central Node installed on a server section.
- In a file alert created based on the results of scanning a copy of web traffic, the User name field is empty if the user is authenticated on the proxy server with basic authentication.
- No connection is established between the Endpoint Agent components and the PCN if the Sensor component installed on a standalone server is being used as the proxy server.
- The Ignore MAC addresses for NIC rules toggle switch has no effect on the application.
- If the Endpoint Agent host is running Windows Server 2016 or earlier, Endpoint Agent does not send information about the Code injection event. The component sends information about this event only if the host is running Windows Server 2019 or later.
Limitations that apply when deploying the Central Node component as a cluster:
- A Central Node cluster must include at least 4 servers: 2 storage servers and 2 processing servers. You can scale the cluster to increase the amount of traffic handled or the number of connected hosts in accordance with the Sizing Guide.
- It is recommended to add servers with the same hardware configuration to the cluster. Otherwise, a proportional increase in performance is not guaranteed.
- Adding an extra server to the cluster does not speed up the processing of objects that are already in the scan queue.
- The web interface of the application can be temporarily unavailable if the server on which it is hosted fails.
- If the processing server fails, you may lose ICAP, POP3, and SMTP traffic data as well as the copies of emails that are waiting to be processed and the detections associated with them.
- If the processing server is configured to receive mirrored traffic from SPAN ports, then SPAN traffic is not processed if this server fails.
- If one of the cluster servers fails or the connection between the server and the Endpoint Agent component is temporarily lost, data in the event database can temporarily become desynchronized.
- If the configuration of the cluster servers is changed, processing of traffic and events from computers with the Endpoint Agent component may be temporarily slowed down.
- When installing Kaspersky Anti Targeted Attack Platform as a cluster or when updating a cluster configuration, it may happen that the Embedded Sensor does not start.
In this case, we recommend doing the following:
- If the Sensor is not connected, remove it using the web interface, then in Technical Support Mode, run the
kata-sensor-tool fix-cluster-sensorcommand. - If Sensor is not running, in Technical Support Mode, run the
kata-sensor-tool fix-cluster-sensorcommand.
After some time, the Sensor should appear in the web interface.
- If the Sensor is not connected, remove it using the web interface, then in Technical Support Mode, run the
- Delays are possible when receiving email over SMTP. To solve this problem, we recommend the following steps:
- Connect to the Central Node or Sensor in Technical Support Mode.
- Enable the
DEBUGlogging level for the SMTP integration with the following command:console-settings-updater set --merge /kata/configuration/product/preprocessor_smtp '{"logging":{"level":{"root":"DEBUG"}}}' - Wait approximately 30 seconds for the settings to synchronize.
- Go back to the
ERRORlogging level for the SMTP integration with the following command:console-settings-updater set --merge /kata/configuration/product/preprocessor_smtp '{"logging":{"level":{"root":"ERROR"}}}'
Limitations that apply when using the application in distributed solution and multitenancy mode:
- On a PCN server, the Assets → Devices tab displays only hosts that are connected to that PCN server.
- User account passwords can be changed only on the PCN server.
Limitations that apply to the Sensor component:
- Only Sensor components installed on standalone servers can be used to capture network traffic at the maximum speed of 10 Gbps.
- Capturing FTP traffic at the maximum speed of 10 Gbps can result in a high level of loss.
- If you add or remove network interfaces that send SPAN traffic to Kaspersky Anti Targeted Attack Platform, raw network traffic dumps may be downloaded from a network interface that is different from the one you selected.
Limitations that apply to the Sandbox component:
- The following versions of operating systems are supported for custom images:
- Windows 7
- Windows 8.1 64-bit
- Windows 10 64-bit (up to version 1909)
- Only English and Russian localizations are fully supported for custom operating system images.
- License keys for activating the operating systems and software are not provided.
- If some of the operating systems selected in the set of operating systems on the Central Node server are not installed on the Sandbox server, Kaspersky Anti Targeted Attack Platform does not send objects to the Sandbox component for scanning. If multiple servers with the Sandbox component are connected to the server with the Central Node component, the application sends objects to those servers whose installed operating systems match the set selected on the Central Node.
Limitations that apply when integrating with Kaspersky Endpoint Agent for Windows and Kaspersky Endpoint Security for Windows:
- Tasks for getting RAM dumps and disk images can only be assigned to computers with Kaspersky Endpoint Agent 3.14 or later for Windows and Kaspersky Endpoint Security 12.1 or later for Windows.
- Tasks for getting process memory dumps, NTFS metafiles, and registry keys can only be assigned to computers with Kaspersky Endpoint Agent 3.14 or later for Windows or Kaspersky Endpoint Security 12.1 or later for Windows.
- The task of scanning hosts using YARA rules can only be assigned to computers with Kaspersky Endpoint Agent 3.14 or later for Windows and Kaspersky Endpoint Security 12.1 or later for Windows. If you simultaneously assign a task to computers with Kaspersky Endpoint Agent version 3.14 or later, and to computers with earlier versions of that application, the task runs only on computers with Kaspersky Endpoint Agent 3.14 or later.
- If autorun points are selected as the scan scope, the task runs only on computers with Kaspersky Endpoint Agent 3.14 or later and Kaspersky Endpoint Security 12.1 or later for Windows.
- The Code injection, Named pipe, WMI, LDAP, DNS, Process access events are available only when integrating with Kaspersky Endpoint Security for Windows 12.7 or a later version.
Limitations that apply when integrating with Kaspersky Endpoint Security for Linux:
- The following functionality is not available for computers running Kaspersky Endpoint Security for Linux 11.4:
- Network isolation of a host.
- Creating a prevention rule.
No notifications are created about the unsuccessful application of a prevention rule on computers with Kaspersky Endpoint Security 11.4 for Linux applications.
- Finding indicators of compromise on computers using IOC files.
No notifications are created about the unsuccessful search of indicators of compromise on computers with Kaspersky Endpoint Security 11.4 for Linux applications.
- The following functionality is not available for computers running Kaspersky Endpoint Security for Linux 12:
- Creating a prevention rule.
No notifications are created about the unsuccessful application of a prevention rule on computers with Kaspersky Endpoint Security 12 for Linux applications.
- Creating a prevention rule.
- The list of events that Kaspersky Endpoint Security 11.4 or 12 for Linux logs in the event database is limited to the following types:
- The list of tasks that you can create on computers running Kaspersky Endpoint Security 11.4 for Linux is limited to the following types:
- Get file
When you create the task, the application does not attempt to verify the path to the executable file or the file that you want to retrieve.
- Run application
- Get file
- The list of tasks that you can create on computers running Kaspersky Endpoint Security 12 for Linux is limited to the following types:
- Get file
When you create the task, the application does not attempt to verify the path to the executable file or the file that you want to retrieve.
- Run application
- Delete file
- Kill process
- Get file
- The list of tasks that you can create on computers running Kaspersky Endpoint Security 12.2 for Linux is limited to the following types:
- Get file
When you create the task, the application does not attempt to verify the path to the executable file or the file that you want to retrieve.
- Run application
- Delete file
- Kill process
- Quarantine file
- Get file
- In information about events registered in the event database by Kaspersky Endpoint Security 11.4 or 12 for Linux, the Time created field displays file modification time.
- The Connection to remote host, Port listened, Module loaded, DNS, Process access events are available when integrated with Kaspersky Endpoint Security 12.2 or later for Linux.
Limitations that apply when integrating with Kaspersky Endpoint Security 12 for Mac:
- The following functionality is not available for computers running Kaspersky Endpoint Security 12 for Mac:
- Network isolation of a host.
- Creating a prevention rule.
No notifications are created about the unsuccessful application of a prevention rule on computers with Kaspersky Endpoint Security 12 for Mac applications.
- Finding indicators of compromise on computers using IOC files.
No notifications are created about the unsuccessful search of indicators of compromise on computers with Kaspersky Endpoint Security 12 for Mac applications.
- The list of events that Kaspersky Endpoint Security 12 for Mac logs in the event database is limited to the following types:
- The list of tasks that you can create on computers running Kaspersky Endpoint Security 12 for Mac is limited to the following types:
- Get file
When you create the task, the application does not attempt to verify the path to the executable file or the file that you want to retrieve.
- Run application
- Get file
- In information about events registered in the event database by Kaspersky Endpoint Security 12 for Mac, the Time created field displays file modification time.
Limitations of Kaspersky Endpoint Agent 3.16 for Windows:
You can view the list of limitations of Kaspersky Endpoint Agent 3.16 for Windows in the Kaspersky Endpoint Agent for Windows Online Help.
Limitations of Kaspersky Endpoint Security 12.5 for Windows:
You can view the list of limitations of Kaspersky Endpoint Security 12.5 for Windows in the Kaspersky Endpoint Security for Windows Online Help.
Limitations of Kaspersky Endpoint Security 12 for Linux:
You can view the list of limitations of Kaspersky Endpoint Security 12 for Linux in the Kaspersky Endpoint Security for Linux Release Notes.
Limitations of Kaspersky Endpoint Security 12 for Mac:
You can view the list of limitations of Kaspersky Endpoint Security 12 for Mac in the Kaspersky Endpoint Security for Mac Online Help.
Data provision
The operation of certain components of Kaspersky Anti Targeted Attack Platform requires data processing on the Kaspersky side. Components do not send data without the consent of the administrator of Kaspersky Anti Targeted Attack Platform.
You can view the list of data and the terms on which it is used as well as give consent to data processing in the following agreements between your organization and Kaspersky:
- In the End User License Agreement (for example, during installation of the application).
According to the terms of the End User License Agreement, you agree to automatically send Kaspersky the information listed in the End User License Agreement under Data Provision. The End User License Agreement is included in the application distribution kit.
- In the KSN Statement (for example, during installation of the application or in the administrator menu after installation).
When you participate in Kaspersky Security Network, information obtained as a result of Kaspersky Anti Targeted Attack Platform operation is automatically sent to Kaspersky. The list of transmitted data is specified in the KSN Statement. The Kaspersky Anti Targeted Attack Platform user independently decides on his/her participation in KSN. The KSN Statement is included in the application distribution kit.
Before KSN statistics are sent to Kaspersky, they are accumulated in the cache on servers hosting Kaspersky Anti Targeted Attack Platform components.
Kaspersky protects any information received in this way as prescribed by law and applicable rules of Kaspersky. Data is sent over encrypted communication channels.
When using Kaspersky Private Security Network, Kaspersky is not sent information about the operation of Kaspersky Anti Targeted Attack Platform. However, KSN statistical data is accumulated in the cache on servers hosting Kaspersky Anti Targeted Attack Platform components to the same extent as when using Kaspersky Security Network. This accumulated KSN statistical data may be transmitted beyond the perimeter of your organization if a server with the Kaspersky Private Security Network application is located outside of your organization.
The Kaspersky Private Security Network administrator must personally ensure the security of such data.
Service data of the application
Kaspersky Anti Targeted Attack Platform resources provide no capability to restrict the rights of the users of servers and operating systems to which the Central Node component is installed. The administrator is advised to use any system resources at their own discretion to control how the users of servers and operating systems with the application installed may be granted access to the personal data of other users.
Information about the service data of Kaspersky Anti Targeted Attack Platform is provided in the table below.
Service data of Kaspersky Anti Targeted Attack Platform
Data type |
Location and duration of storage |
|---|---|
|
Data is stored indefinitely on the server hosting the Central Node component in the |
System event log |
OS log files are stored indefinitely in the |
Log with information about the application operation. |
The log file is stored indefinitely in the /data directory on the server hosting the Central Node component, if the component is installed on the server. When the Central Node component is installed on a cluster, data is stored on storage servers indefinitely. |
File scan queue. |
Files are stored on the server hosting the Central Node component in the /data directory if the component is installed on the server. When the Central Node component is installed on a cluster, data is stored on storage servers. The data is retained until the scan is completed. |
Files received from computers with the Endpoint Agent component. |
Files are stored on the server hosting the Central Node component in the /data directory if the component is installed on the server. When the Central Node component is installed on a cluster, data is stored on storage servers. Data is rotated when disk space becomes full. |
Files with YARA and IDS rules (user-defined and from Kaspersky). |
Files are stored indefinitely in the /data directory on the server hosting the Central Node component, if the component is installed on the server. When the Central Node component is installed on a cluster, data is stored on storage servers indefinitely.
|
Files with data about detections sent to external systems. |
Files are stored indefinitely on the server hosting the Central Node component in the /data directory if the component is installed on the server. When the Central Node component is installed on a cluster, data is stored on storage servers indefinitely.
|
Artifacts of the Sandbox component. |
Files are stored on the server hosting the Central Node component in the /data directory if the component is installed on the server. When the Central Node component is installed on a cluster, data is stored on storage servers. Data is rotated when disk space becomes full. |
Files for which detections were created by the Sandbox component. |
Files are stored on the server hosting the Central Node component in the /data directory if the component is installed on the server. When the Central Node component is installed on a cluster, data is stored on storage servers. Data is rotated when disk space becomes full. |
Certificate files used for the authentication of application components. |
Files are stored indefinitely in the /data directory on the server hosting the Central Node, PCN, SCN, Sensor component or on the computer with the Endpoint Agent component. |
Encryption keys that are transmitted between application components. |
Files are stored indefinitely in the /data directory on the server hosting the Central Node, PCN, SCN, Sensor component or on the computer with the Endpoint Agent component.
|
Copies of mirrored traffic from SPAN ports. |
Files are stored in storage mounted on the server with the Sensor component. Data is deleted as disk space becomes full. |
ICAP exclusion filters. |
Files are stored indefinitely on the server hosting the Central Node component in the /data directory if the component is installed on the server. When the Central Node component is installed on a cluster, data is stored on storage servers indefinitely. |
|
The data is stored on the Central Node server in the /data/storage/volumes/nta_database directory. Data is rotated as disk space becomes filled. |
|
Files are stored indefinitely on the server hosting the Central Node component in the /data directory if the component is installed on the server. When the Central Node component is installed on a cluster, data is stored on storage servers indefinitely. |
|
|
|
|
|
|
|
|
|
|
|
|
User name of the user account that uploaded the file with user-defined IDS rules.
|
|
|
|
|
|
|
|
|
|
|
|
|
|
|
|
Virtual machine configuration information:
|
|
Data on user accounts:
|
The data is stored on the Central Node server in the /data/storage/volumes/nta_database directory. Data is rotated as disk space becomes filled. |
Network session information:
|
|
Information about devices registered in the application:
|
|
Data saved when integrated with the Endpoint Agent component as part of the NDR functionality:
|
|
Information about network traffic events: IP and MAC addresses of devices. |
|
Information about executable files on Endpoint Agent computers connected as part of the NDR functionality:
|
|
Traffic dump data related to logged network sessions and events:
|
Data of the Central Node and Sensor components
This section contains the following information about user data that is stored on the server with the Central Node component and on the server with the Sensor component:
- Contents of stored data
- Storage location
- Storage duration
- User access to data
Traffic data of the Sensor component
Traffic data of the Sensor component is stored on the server with the Sensor component or on the server with Sensor and Central Node components if Sensor and Central Node are installed on the same server or deployed as a cluster.
Traffic data is recorded and stored in sequentially created files. The application stops recording data in one file and starts logging data in the next file if:
- The maximum file size is reached (you can configure this setting)
- The configured time interval has elapsed (you can configure this setting)
- The traffic saving service or the entire Kaspersky Anti Targeted Attack Platform application is restarted
As traffic data accrues, Kaspersky Anti Targeted Attack Platform filters data and keeps only the following information:
- Information related to alerts generated as a result of scanning by the Targeted Attack Analyzer technology
- PCAP files in which:
- Source or destination IP address matches an IP address from the detection
- Traffic data belongs to the time period within 15 minutes from the detection time
Filtered traffic data is moved to a separate section. The rest of the traffic data (that do not satisfy filtering criteria) is deleted.
Filtered traffic data is saved in sequentially created files. The application stops recording data in one file and starts logging data in the next file if:
- The maximum file size is reached
- The configured time interval has elapsed
Filtered data traffic is stored for the last 24 hours. Older data is deleted.
Data in detections
Kaspersky Anti Targeted Attack Platform resources provide no capability to restrict the rights of the users of servers and operating systems to which the Central Node component is installed. The administrator is advised to use any system resources at their own discretion to control how the users of servers and operating systems with the application installed may be granted access to the personal data of other users.
Information about the data that may be stored when creating
is listed in the table below.Data in Kaspersky Anti Targeted Attack Platform detections
Data type |
Location and duration of storage |
|---|---|
The following data is stored on the server for all detections:
|
If the Central Node is installed on a server, detection information is stored on the Central Node server in the /data directory. If Central Node is installed as a cluster, detection information is stored in a ceph storage. Data is rotated when the number of detection records generated by an individual scanning technology reaches 1,000,000. |
When the alert associated with the detection is modified, the following information is stored on the server:
|
|
If the detection was created as a result of scanning a file, the following information may be stored on the server:
|
|
If the detection was created as a result of scanning FTP traffic, the following information may be stored on the server:
|
|
If the detection was created as a result of scanning HTTP traffic, the following information may be stored on the server:
|
|
If the detection was created as a result of scanning by the Intrusion Detection technology, the following information may be stored on the server:
|
|
If the detection was created as a result of scanning by the URL Reputation technology, the following information may be stored on the server:
|
|
If the detection was created as a result of scanning HTTP traffic, the following information may be stored on the server:
|
|
If the detection was created as a result of scanning by the Anti-Malware technology, the following information may be stored on the server:
|
|
If the detection was created as a result of a DNS activity detection, the following information may be stored on the server:
|
|
If the detection was created as a result of scanning in accordance with user-defined IOC or TAA (IOA) rules, the following information may be stored on the server:
|
|
If the detection was created using YARA rules, the following information can be stored on the server:
|
|
If the detection was created as a result of scanning a file, the following information may be stored on the server:
|
If the Central Node is installed on a server, detection information is stored on the Central Node server in the /data directory. If Central Node is installed as a cluster, detection information is stored in a ceph storage. The data is stored indefinitely. |
If the detection was created as a result of a rescan, the following information may be stored on the server:
|
Data in events
Events may contain user data. If Central Node is installed on a server, information about occurred events is stored in the /data directory. If Central Node is installed as a cluster, the information is stored in ceph storage.
Data is rotated as the disk becomes full.
Kaspersky Anti Targeted Attack Platform resources provide no capability to restrict the rights of the users of servers and operating systems to which the Central Node component is installed. The administrator is advised to use any system resources at their own discretion to control how the users of servers and operating systems with the application installed may be granted access to the personal data of other users.
Event data can contain information related to the following:
- Name of the computer where the event occurred.
- Unique ID of the computer with the Endpoint Agent component.
- Name of the user account under which the event occurred.
- Name of the group that the user belongs to.
- Event type.
- Event time.
- Information about the file for which the event was logged: name, path, full name.
- MD5 and SHA256 hash of the file.
- File creation time.
- File modification time.
- File access rights.
- Environment variables of the process.
- Command-line parameters.
- Text of the command entered into the command line.
- Local IP address of the adapter.
- Local port.
- Remote host name.
- Remote host IP address.
- Port on the remote host.
- URLs and IP addresses of visited websites, and links from these websites.
- Network connection protocol.
- HTTP request method.
- HTTP request header.
- Information about Windows registry variables: path to the variable, variable name, variable value.
- Contents of a script or binary file sent for AMSI scanning.
- Information about the event in the Windows log: event type, event type ID, event ID, user account under which the event was logged, full text of the event from the Windows Event Log in XML format.
Data in reports
If the Central Node component is installed on a server, report data is stored in the /data directory indefinitely. If Central Node is installed as a cluster, the information is stored in ceph storage indefinitely.
Kaspersky Anti Targeted Attack Platform resources provide no capability to restrict the rights of the users of servers and operating systems to which the Central Node component is installed. The administrator is advised to use any system resources at their own discretion to control how the users of servers and operating systems with the application installed may be granted access to the personal data of other users.
Reports may contain the following information:
- Report creation date.
- Time period covered in the report.
- ID of the user account that generated the report.
- Report status.
- Central Node components for which the report was generated.
- Text of the report as HTML code.
- Report description.
- Name of the template that the report was generated from.
- Tenant ID.
Data on objects in Storage and Quarantine
If the Central Node component is installed on a server, data about objects in storage and quarantine is stored in the /data directory indefinitely. If Central Node is installed as a cluster, the information is stored in ceph storage indefinitely.
Kaspersky Anti Targeted Attack Platform resources provide no capability to restrict the rights of the users of servers and operating systems to which the Central Node component is installed. The administrator is advised to use any system resources at their own discretion to control how the users of servers and operating systems with the application installed may be granted access to the personal data of other users.
Data on objects in Storage and quarantine may contain the following information:
- Name of the object.
- Path to the object on the computer with the Endpoint Agent component.
- MD5- and SHA256 hash of the file.
- File size.
- ID of the user that quarantined the object.
- ID of the user that placed the object in Storage.
- IP address of the computer on which the quarantined object is stored.
- Name of the computer on which the quarantined object is stored.
- Unique ID of the computer on which the quarantined object is stored in Storage.
- ID of the TAA (IOA) rule by which the detection was generated.
- Category of the detected object.
- Results for the object scanned using individual modules and technologies of the application.
- File download time.
- Metadata of scanned files and their sources.
- Resulting status of the object in Storage.
Sandbox component data
For the processing time, the body of the file sent by the Central Node component is saved in open form on the server hosting the Sandbox component. During processing, the server administrator can access the sent file in Technical Support Mode. The scanned file is deleted by a special script according to the schedule. Once every 60 minutes by default.
Information about the data stored on the server with the Sandbox component is provided in the table below.
Data stored on the server with the Sandbox component
Scope of data |
Storage location |
Storage duration |
Access to data |
|---|---|---|---|
Scanned files |
|
After the Central Node component receives the scan results or until automatic deletion, but no more than 24 hours. |
User access is defined by the administrator using operating system tools. |
File scan results |
|
After the Central Node component receives the scan results or until automatic deletion, but no more than 24 hours. |
User access is defined by the administrator using operating system tools. |
Task settings |
|
After the Central Node component receives the scan results or until automatic deletion, but no more than 24 hours in the directory Up to 90 days in the Sandbox component database. |
User access to the directory A password is required for user authentication in the database. Access to database files is granted only to users who started database processes and users with root privileges. Access is provided only over an encrypted IPSec channel. |
Trace files |
|
Up to 21 days. |
User access is defined by the administrator using operating system tools. Only authorized users can perform actions with trace files. Information about actions with trace files is saved in the application event log. |
Settings of the update source |
|
Until modified or deleted. |
User access is defined by the administrator using operating system tools. |
Minimum password length settings |
|
Until modified or deleted. |
User access is defined by the administrator using operating system tools. |
Virtual machines |
|
Until modified or deleted. |
User access is defined by the administrator using operating system tools. |
Downloaded images of operating systems and applications in iso format |
|
Until modified or deleted. |
User access is defined by the administrator using operating system tools. |
Data transmitted between application components
Central Node and the Endpoint Agent component
Application used in the role of the Endpoint Agent component send the following to the Central Node component: task completion reports, information on events and alerts that occurred on computers with these applications, and information about terminal sessions.
If there is no connection with the Central Node component, all pending information is accumulated until it is sent to the Central Node component or until the application that is being used in the role of the Endpoint Agent is removed from the computer, but no longer than 21 days.
General information for all events
If an event occurred on the user's computer, the applications send the following data to the events database:
- Event type.
- Event time.
- Event ID.
- Version of the event schema.
- Time when the event was processed by the Central Node server.
- User account for which the event was generated.
- Name of the host where the event occurred.
- IP address of the host.
- Type of the operating system installed on the host.
- OS family.
- OS name.
- OS version.
- The IP address of the network adapter that the application used in the role of the Endpoint Agent uses to connect to the Central Node or Sensor server.
- The version of the application that is being used in the role of the Endpoint Agent component.
- Date of the last update of the KBD databases.
- Date of the last update of the SW databases.
- Index date.
- When marking up events in accordance with TAA (IOA) rules, the following information is transmitted:
- ID of the triggered indicator of attack.
- Decision of the triggered indicator of attack.
- Source of the triggered indicator of attack.
- Version of the triggered attack indicator.
- MITRE technique code.
- MITRE tactic code.
- Alert importance depending on the security impact this alert may have on the computer or corporate LAN, based on Kaspersky experience.
- Confidence of the detection depending on the likelihood of false alarms caused by the rule.
Central Node and Kaspersky Endpoint Agent for Windows
If an event occurred on the user's computer, the application sends the following data to the events database:
- File creation event.
- Details of the process that created the file: process file name, and MD5- and SHA256 hash of the process file.
- File name.
- Path to the file.
- Full name of the file.
- MD5- and SHA256 hash of the file.
- Date of file creation and modification.
- File size.
- Registry monitoring event.
- Details of the process that modified the registry: Process ID, process file name, and MD5- and SHA256 hash of the process file.
- Path to the registry key.
- Registry value name.
- Registry value data.
- Registry value type.
- Previous path to the registry key.
- Previous registry value data.
- Previous registry value type.
- Driver loading event.
- File name.
- Path to the file.
- Full name of the file.
- MD5- and SHA256 hash of the file.
- File size.
- Date of file creation and modification.
- Listening port opening event.
- Details of the process that opened the listening port: process file name, and MD5- and SHA256 hash of the process file.
- Port number.
- Adapter IP address.
- Event in the operating system log.
- Time of the event, host on which the event occurred, and user account name.
- Event ID.
- Channel/log name.
- Event ID in the log.
- Provider name.
- Authentication event subtype.
- Domain name.
- Remote IP address.
- Event header fields: ProviderName, EventId, Version, Level, Task, Opcode, Keywords, TimeCreatedSystemTime, EventRecordId, CorellationActivityId, ExecutionProcessID, ThreadID, Channel, Computer.
- Event body fields: AccessList, AccessFiles mask, AccountExpires, AllowedToDelegateTo, Application, AuditPolicyChanges, AuthenticationPackageName, CategoryId, CommandLine, DisplayName, Dummy, ElevatedToken, EventCode, EventProcessingFailure, FailureReason, FilterRTID, HandleId, HomeDirectory, HomePath, ImpersonationLevel, IpAddress, IpPort, KeyLength, LayerName, LayerRTID, LmPackageName, LogonGuid, LogonHours, LogonProcessName, LogonType, MandatoryLabel, MemberName, MemberSid, NewProcessId, NewProcessName, NewUacValue, NewValue, NewValueType, ObjectName, ObjectServer, ObjectType, ObjectValueName, OldUacValue, OldValue, OldValueType, OperationType, PackageName, ParentProcessName, PasswordLastSet, PrimaryGroupId, PriviledgeList, ProcessId, ProcessName, ProfileChanged, ProfilePath, Protocol, PublisherId, ResourceAttributes, RestrictedAdminMode, SamAccountName, ScriptPath, ServiceAccount, ServiceFileName, ServiceName, ServiceStartType, ServiceType, SettingType, SettingValue, ShareLocalPath, ShareName, SidHistory, SourceAddress, SourcePort, Status, SubcategoryGuid, SubcategoryId, SubjectDomainName, SubjectLogonId, SubjectUserName, SubjectUserSid, SubStatus, TargetDomainName, TargetLinkedLogonId, TargetLogonId, TargetOutboundDomainName, TargetOutboundUserName, TargetUserName, TargetUserSid, TaskContent, TaskName, TokenElevationType, TransmittedServices, UserAccountControl, UserParameters, UserPrincipalName, UserWorkstations, VirtualAccount, Workstation, WorkstationName.
- Process start event.
- Information about the process file: file name, file path, MD5 or SHA256 hash of the file, file size, creation and modification date, name of the organization that issued the digital certificate of the file, digital signature verification result.
- UniquePID.
- Process start options.
- Process start time.
- Information about the parent process: file path, UniquePID, MD5 or SHA256 hash of the process file, process start options.
- Process stop event.
- Information about the file of the process: file name, file path, full name of the file, MD5 or SHA256 hash of the file, file size, and process end time.
- UniquePID.
- Process start options.
- Information about the parent process: file path, UniquePID, MD5 or SHA256 hash of the process file, process start options.
- Module loading event.
- Details of the file that loaded the module: UniquePID, file name, file path, full name of the file, MD5- and SHA256 hash of the file, and file size.
- DLL name.
- Path to DLL.
- DLL full name.
- MD5 or SHA256 hash of the DLL.
- DLL size.
- Date of DLL creation and modification.
- Name of the organization that issued the digital certificate of the DLL.
- DLL digital signature verification result.
- Process startup blocking event.
- Details of the file that attempted to run: file name, file path, full name of the file, MD5- and SHA256 hash of the file, file size, and date of file creation and modification.
- Command line parameters.
- File startup blocking event.
- Details of the file that attempted to open: file name, file path, full name of the file, MD5- and SHA256 hash of the file, type of checksum used for file size blocking (0 – MD5, !=0 – SHA256, not used for search).
- Details of the executable file: file name, file path, full name of the file, MD5- and SHA256 hash of the file, file size, and date of file creation and modification.
- Details of the parent process: file name, file path, full name of the file, MD5- and SHA256 hash of the file, PID, and UniquePID.
- Detection event and the result of its processing (when Kaspersky Endpoint Agent for Windows is integrated with Kaspersky Endpoint Security for Windows).
- Scan result.
- Name of the detected object.
- ID of the record in application databases.
- Release time of the application databases with which the detection was generated.
- Object processing mode.
- Category of the detected object (for example, name of a virus).
- MD5 hash of the detected object.
- SHA256 hash of the detected object.
- Unique ID of the process.
- Process PID displayed in the Windows Task Manager.
- Process start command line.
- Reason for the error when processing the object.
- Contents of the script scanned using AMSI.
- AMSI scan event.
- Contents of the script scanned using AMSI.
Central Node and Kaspersky Endpoint Security for Windows
If an event occurred on the user's computer, the application sends the following data to the events database:
- File modification event.
- Details of the process that created the file: process file name, and MD5- and SHA256 hash of the process file.
- Information about the created or modified file: name, path, full name, type, MD5 hash, SHA256 hash, creation date, modification date, attributes, attribute modification date, size, zone ID, application name of the file, vendor, name of the organization that issued the digital certificate, description, digital signature verification result, time of the digital signature, original name, name before modification, path before modification, full name before modification.
- Information about the file to which a link was created: MD5 hash, SHA256 hash, creation date, modification date, attributes, attribute modification date, size, type, zone ID, application name of the file, original name, name of the organization that issued the digital certificate, description, subject of the signature, digital signature verification result, time of the digital signature, full name of the link file.
- Registry monitoring event.
- Details of the process that modified the registry: Process ID, process file name, and MD5- and SHA256 hash of the process file.
- Path to the registry key.
- Registry value name.
- Registry value data.
- Registry value type.
- Previous path to the registry key.
- Previous registry value data.
- Previous registry value type.
- Type of the operation with the registry.
- Path to the file where the registry key was saved.
- Driver loading event.
- File name.
- Original file name.
- Path to the file.
- Full name of the file.
- MD5- and SHA256 hash of the file.
- File size.
- Date of file creation and modification.
- File attribute modification date.
- File size.
- File type.
- File attributes.
- File zone ID.
- File vendor.
- File description.
- Name of the organization that issued the digital certificate.
- Signature subject.
- Digital signature verification result.
- Time of digital signature.
- URL from which the file was retrieved.
- Metadata of the message from which the file was retrieved.
- Listening port opening event.
- Details of the process that opened the listening port: process file name, and MD5- and SHA256 hash of the process file.
- Port number.
- Adapter IP address.
- Operation status.
- Remote connection event.
- Information about the local computer: IP address, port number.
- Information about the remote computer: IP address, port number, FQDN.
- Information about TLS encryption of the connection: protocol version, SNI, encrypted SNI, MD5 hash of the certificate file, SHA1 hash of the certificate file, certificate issuer name, certificate serial number, certificate verification result, certificate expiration date, Ja3, Ja3s, MD5 hash of Ja3, MD5 hash of Ja3s, socket type.
- LANA number.
- HTTP method.
- URL that was followed.
- Process status.
- Connection direction.
- DNS lookup event.
- IPv4 address of the DNS server.
- Binary mask of the DNS query being performed.
- DNS response error code.
- DNS query type ID.
- Name of the domain for which the DNS record is to be resolved.
- Date of the DNS response.
- LDAP event.
- Search scope.
- Search query filter.
- Attributes specified in the query as attributes to be returned.
- Path to the LDAP container to be searched.
- Process start event.
Information about files of the parent and grandparent processes, loader processes, creator processes, running processes: name, path, full name, MD5 hash, SHA256 hash, creation date and time, modification date and time, attributes, attribute modification date and time, size, zone ID, vendor, name of the organization that issued the digital certificate, description, original name, digital signature subject, digital signature verification result, date and time of the digital signature, file version, logon type, login session ID, user account type, user name, user account ID, IP address of the computer from which the logon was made, integrity level, process ID, current directory.
- Process stop event.
- Information about the file of the process: file name, file path, full name of the file, MD5 or SHA256 hash of the file, file size, and process end time.
- Unique ID of the process.
- Process start options.
- Information about the parent process: file path, UniquePID, MD5 and SHA256 hash, command line options.
- Process access event.
- Operation type.
- Process access permissions.
- Call stack.
- Information about the file of the recipient process and the file of the process from which the handle was duplicated: name, path, full path, MD5 and SHA256 hash, creation date and time, modification date and time, attribute modification date and time, size, unique ID, system ID, command line options, URL from which the file was retrieved, metadata of the message from which the file was retrieved.
- Module loading event.
- Details of the file that loaded the module: UniquePID, file name, file path, full name of the file, MD5- and SHA256 hash of the file, and file size.
- DLL name.
- Path to DLL.
- DLL full name.
- MD5 or SHA256 hash of the DLL.
- DLL size.
- DLL attributes.
- DLL zone ID.
- DLL application name.
- Original DLL name.
- Date of DLL creation and modification.
- Name of the organization that issued the digital certificate of the DLL.
- DLL digital signature verification result.
- DLL digital signature date.
- Path to replaced DLL.
- DLL file type.
- URL from which the file was retrieved.
- Metadata of the message from which the file was retrieved.
- .NET assembly name.
- .NET assembly flags.
- .NET module flags.
- Process startup blocking event.
- Details of the file that attempted to run: file name, file path, full name of the file, MD5- and SHA256 hash of the file, file size, and date of file creation and modification.
- Command line parameters.
- File startup blocking event.
- Information about the file that was being opened: file name, file path, full file name, MD5 hash, SHA256 hash, type of checksum that triggered the blocking, (0 for MD5, !=0 for SHA256, not used for search), URL of the website from which the executable file was downloaded, metadata of the message to which the downloaded file was attached.
- Details of the executable file: file name, file path, full name of the file, MD5- and SHA256 hash of the file, file size, and date of file creation and modification.
- Details of the parent process: file name, file path, full name of the file, MD5- and SHA256 hash of the file, PID, and UniquePID.
- Event of named pipe being opened and connected to.
- File name of the process that created or connected to the named pipe.
- Pipe operation type.
- Threat detection event and detection processing result.
- Name of the detected object.
- MD5 hash of the detected object.
- SHA256 hash of the detected object.
- Type of detected object.
- Scan result.
- ID of the record in application databases.
- Version of the application databases used to generate the detection.
- Object processing mode.
- Category of the detected object (for example, name of a virus).
- Protocol.
- IPv4 or IPv6 address of the local computer.
- Local port number.
- IPv4 or IPv6 address of the remote computer.
- Remote port number.
- URL from which the file was retrieved.
- Email address of the sender if the file was obtained from an email message.
- Full name, MD5 hash, SHA256 hash of the file loader.
- Unique ID of the process.
- Process PID displayed in the Windows Task Manager.
- Process start command line.
- Reason for the error when processing the object.
- Contents and type of the script scanned using AMSI.
- WMI service start event.
- Operation type.
- Remote startup flag of the WMI service.
- Name of the computer on which the WMI service was started.
- Name of the user that started the WMI service.
- WMI namespace.
- Event consumer filter name.
- Name of the created event consumer.
- Event consumer source code.
- AMSI scan event.
- Contents of the script scanned using AMSI.
- Content type of the script sent for scanning.
- Name of the script sent for scanning.
- MD5 hash of the script file.
- SHA256 hash of the script file.
- Code injection event.
- Information about the recipient process: application name, full application name, path to the application, MD5 hash of the file, SHA256 hash of the file, URL from which the file was downloaded, metadata of the message to which the downloaded file was attached, unique ID of the application, system ID of the application, command line, name of the process DLL, path to the process DLL, address of the process in the address space.
- Injection method.
- Modified command line of the process.
- System call parameters.
- API call stack at the time of interception of the injection-related function.
- Interpreted file run event.
Information about the interpreted file: name, path, full name, MD5, SHA256, file creation date and time, file modification date and time, size, type, attributes, attribute modification date and time, original name, description, zone ID, name of organization that issued the digital certificate, result of digital signature verification, date and time of the digital signature, subject of the digital signature, URL from which the file was obtained, metadata of the message to which the downloaded file was attached.
- Event in the operating system log.
- Time of the event, host on which the event occurred, and user account name.
- Event ID.
- Channel/log name.
- Event ID in the log.
- Provider name.
- Authentication event subtype.
- Domain name.
- Remote IP address.
- Event header fields: ProviderName, EventId, Version, Level, Task, Opcode, Keywords, TimeCreatedSystemTime, EventRecordId, CorellationActivityId, ExecutionProcessID, ThreadID, Channel, Computer.
- Event body fields: AccessList, AccessFiles mask, AccountExpires, AllowedToDelegateTo, Application, AuditPolicyChanges, AuthenticationPackageName, CategoryId, CommandLine, DisplayName, Dummy, ElevatedToken, EventCode, EventProcessingFailure, FailureReason, FilterRTID, HandleId, HomeDirectory, HomePath, ImpersonationLevel, IpAddress, IpPort, KeyLength, LayerName, LayerRTID, LmPackageName, LogonGuid, LogonHours, LogonProcessName, LogonType, MandatoryLabel, MemberName, MemberSid, NewProcessId, NewProcessName, NewUacValue, NewValue, NewValueType, ObjectName, ObjectServer, ObjectType, ObjectValueName, OldUacValue, OldValue, OldValueType, OperationType, PackageName, ParentProcessName, PasswordLastSet, PrimaryGroupId, PriviledgeList, ProcessId, ProcessName, ProfileChanged, ProfilePath, Protocol, PublisherId, ResourceAttributes, RestrictedAdminMode, SamAccountName, ScriptPath, ServiceAccount, ServiceFileName, ServiceName, ServiceStartType, ServiceType, SettingType, SettingValue, ShareLocalPath, ShareName, SidHistory, SourceAddress, SourcePort, Status, SubcategoryGuid, SubcategoryId, SubjectDomainName, SubjectLogonId, SubjectUserName, SubjectUserSid, SubStatus, TargetDomainName, TargetLinkedLogonId, TargetLogonId, TargetOutboundDomainName, TargetOutboundUserName, TargetUserName, TargetUserSid, TaskContent, TaskName, TokenElevationType, TransmittedServices, UserAccountControl, UserParameters, UserPrincipalName, UserWorkstations, VirtualAccount, Workstation, WorkstationName, System, SystemProvider, SystemProviderName, SystemProviderGuid, SystemProviderEventSourceName, SystemEventID, SystemEventIDQualifiers, SystemEventRecordID, SystemChannel, SystemTask, SystemOpcode, SystemVersion, SystemLevel, SystemKeywords, SystemTimeCreated, SystemTimeCreatedSystemTime, SystemCorrelation, SystemCorrelationActivityID, SystemExecution, SystemExecutionProcessID, SystemExecutionThreadID, SystemComputer, SystemSecurity, SystemSecurityUserID, UserData, UserDataEventProcessingFailure, UserDataEventProcessingFailureError, UserDataEventProcessingFailureErrorCode, UserDataEventProcessingFailureEventID, UserDataEventProcessingFailurePublisherID, UserDataLogFileCleared, UserDataLogFileClearedSubjectUserSid, UserDataLogFileClearedSubjectUserName, UserDataLogFileClearedSubjectDomainName, UserDataLogFileClearedSubjectLogonId, UserDataFileIsFull, UserDataOperationStartedOperationalProviderName, UserDataOperationStartedOperationalCode, UserDataOperationStartedOperationalHostProcess, UserDataOperationStartedOperationalProcessID, UserDataOperationStartedOperationalProviderPath, UserDataServiceShutdown, UserDataOperationClientFailure, UserDataOperationClientFailureId, UserDataOperationClientFailureClientMachine, UserDataOperationClientFailureUser, UserDataOperationClientFailureClientProcessId, UserDataOperationClientFailureComponent, UserDataOperationClientFailureOperation, UserDataOperationClientFailureResultCode, UserDataOperationClientFailurePossibleCause, EventData, EventDataData, EventDataDataTaskName, EventDataDataPrivilegeList, EventDataDataAttributeLDAPDisplayName, EventDataDataOperationType, EventDataDataObjectClass, EventDataDataAttributeValue, EventDataDataObjectDN, EventDataDataRelativeTargetName, EventDataDataWorkstationName, EventDataDataServiceName, EventDataDataAllowedToDelegateTo, EventDataDataUserAccountControl, EventDataDataProfileChanged, EventDataDataRuleId, EventDataDataRuleName, EventDataDataSubjectUserSid, EventDataDataSubjectUserName, EventDataDataSubjectDomainName, EventDataDataSubjectLogonId, EventDataDataPreviousTime, EventDataDataNewTime, EventDataDataProcessId, EventDataDataProcessName, EventDataDataObjectType, EventDataDataObjectName, EventDataDataAccessList, EventDataDataAccessMask, EventDataDataServiceFileName, EventDataDataServiceType, EventDataDataServiceStartType, EventDataDataServiceAccount, EventDataDataDomainName, EventDataDataDomainSid, EventDataDataTdoType, EventDataDataTdoDirection, EventDataDataTdoAttributes, EventDataDataSidFilteringEnabled, EventDataDataTargetSid, EventDataDataAccessGranted, EventDataDataTargetUserName, EventDataDataTargetDomainName, EventDataDataSamAccountName, EventDataDataSidHistory, EventDataDataDomainPolicyChanged, EventDataDataMinPasswordAge, EventDataDataMaxPasswordAge, EventDataDataForceLogoff, EventDataDataLockoutThreshold, EventDataDataLockoutObservationWindow, EventDataDataLockoutDuration, EventDataDataProperties, EventDataDataPasswordProperties, EventDataDataMinPasswordLength, EventDataDataPasswordHistoryLength, EventDataDataMachineAccountQuota, EventDataDataMixedDomainMode, EventDataDataDomainBehaviorVersion, EventDataDataOemInformation, EventDataDataGroupTypeChange, EventDataDataLogonGuid, EventDataDataTargetUserSid, EventDataDataTargetLogonId, EventDataDataTargetLogonGuid, EventDataDataSidList, EventDataDataWorkstation, EventDataDataStatus, EventDataDataCallerProcessId, EventDataDataCallerProcessName, EventDataDataForestRoot, EventDataDataForestRootSid, EventDataDataOperationId, EventDataDataEntryType, EventDataDataFlags, EventDataDataTopLevelName, EventDataDataDnsName, EventDataDataNetbiosName, EventDataDataAuditSourceName, EventDataDataEventSourceId, EventDataDataErrorCode, EventDataDataGPOList, EventDataDataDestinationDRA, EventDataDataSourceDRA, EventDataDataSourceAddr, EventDataDataNamingContext, EventDataDataOptions, EventDataDataStatusCode, EventDataDataSessionID, EventDataDataStartUSN, EventDataDataPackageName, EventDataDataAuthenticationPackageName, EventDataDataFailureReason, EventDataDataSubStatus, EventDataDataCategoryId, EventDataDataSubcategoryGuid, EventDataDataAuditPolicyChanges, EventDataDataUserPrincipalName, EventDataDataHomeDirectory, EventDataDataHomePath, EventDataDataScriptPath, EventDataDataProfilePath, EventDataDataUserWorkstations, EventDataDataPasswordLastSet, EventDataDataAccountExpires, EventDataDataPrimaryGroupId, EventDataDataOldUacValue, EventDataDataNewUacValue, EventDataDataUserParameters, EventDataDataLogonHours, EventDataDataMemberName, EventDataDataMemberSid, EventDataDataServiceSid, EventDataDataTicketOptions, EventDataDataTicketEncryptionType, EventDataDataPreAuthType, EventDataDataCertIssuerName, EventDataDataCertSerialNumber, EventDataDataCertThumbprint, EventDataDataSettingType, EventDataDataSettingValue, EventDataDataShareName, EventDataDataShareLocalPath, EventDataDataApplication, EventDataDataSourceAddress, EventDataDataSourcePort, EventDataDataProtocol, EventDataDataFilterRTID, EventDataDataLayerName, EventDataDataLayerRTID, EventDataDataLogonType, EventDataDataLogonProcessName, EventDataDataTransmittedServices, EventDataDataLmPackageName, EventDataDataKeyLength, EventDataDataIpAddress, EventDataDataIpPort, EventDataDataImpersonationLevel, EventDataDataRestrictedAdminMode, EventDataDataTargetOutboundUserName, EventDataDataTargetOutboundDomainName, EventDataDataVirtualAccount, EventDataDataTargetLinkedLogonId, EventDataDataElevatedToken, EventDataDataTaskContentNew, EventDataDataTaskContentNewTask, EventDataDataTaskContentNewTaskRegistrationInfo, EventDataDataTaskContentNewTaskRegistrationInfoDate, EventDataDataTaskContentNewTaskRegistrationInfoAuthor, EventDataDataTaskContentNewTaskTriggers, EventDataDataTaskContentNewTaskPrincipals, EventDataDataTaskContentNewTaskPrincipalsPrincipal, EventDataDataTaskContentNewTaskPrincipalsPrincipalid, EventDataDataTaskContentNewTaskPrincipalsPrincipalRunLevel, EventDataDataTaskContentNewTaskPrincipalsPrincipalUserId, EventDataDataTaskContentNewTaskPrincipalsPrincipalLogonType, EventDataDataTaskContentNewTaskSettings, EventDataDataTaskContentNewTaskSettingsMultipleInstancesPolicy, EventDataDataTaskContentNewTaskSettingsDisallowStartIfOnBatteries, EventDataDataTaskContentNewTaskSettingsStopIfGoingOnBatteries, EventDataDataTaskContentNewTaskSettingsAllowHardTerminate, EventDataDataTaskContentNewTaskSettingsStartWhenAvailable, EventDataDataTaskContentNewTaskSettingsRunOnlyIfNetworkAvailable, EventDataDataTaskContentNewTaskSettingsIdleSettings, EventDataDataTaskContentNewTaskSettingsIdleSettingsStopOnIdleEnd, EventDataDataTaskContentNewTaskSettingsIdleSettingsRestartOnIdle, EventDataDataTaskContentNewTaskSettingsAllowStartOnDemand, EventDataDataTaskContentNewTaskSettingsEnabled, EventDataDataTaskContentNewTaskSettingsHidden, EventDataDataTaskContentNewTaskSettingsRunOnlyIfIdle, EventDataDataTaskContentNewTaskSettingsWakeToRun, EventDataDataTaskContentNewTaskSettingsExecutionTimeLimit, EventDataDataTaskContentNewTaskSettingsPriority, EventDataDataTaskContentNewTaskActions, EventDataDataTaskContentNewTaskActionsContext, EventDataDataTaskContentNewTaskActionsExec, EventDataDataTaskContentNewTaskActionsExecCommand, EventDataDataOldSd, EventDataDataNewSd, EventDataDataNotificationPackageName, EventDataDataSecurityPackageName, EventDataDataStopTime, EventDataDataContextInfo, EventDataDataUserData, EventDataDataPayload, EventDataDataOpCorrelationID, EventDataDataAppCorrelationID, EventDataDataDSName, EventDataDataDSType, EventDataDataObjectGUID, EventDataDataFileName, EventDataDataLinkName, EventDataDataTransactionId, EventDataDataOldObjectDN, EventDataDataNewObjectDN, EventDataDatabcdCCID, EventDataDatabMaxSlotIndex, EventDataDatabVoltageSupport, EventDataDatadwProtocols, EventDataDatadwDefaultClock, EventDataDatadwMaximumClock, EventDataDatabNumClockSupported, EventDataDatadwDataRate, EventDataDatadwMaxDataRate, EventDataDatabNumDataRateSupported, EventDataDatadwMaxIFSD, EventDataDatadwSyncProtocols, EventDataDatadwMechanical, EventDataDatadwFeatures, EventDataDataObjectValueName, EventDataDataHandleId, EventDataDataOldValueType, EventDataDataOldValue, EventDataDataNewValueType, EventDataDataNewValue, EventDataDataSubjectUserDomainName, EventDataDataObjectCollectionName, EventDataDataObjectIdentifyingProperties, EventDataDataObjectProperties, EventDataDataparam, EventDataDataCVEID, EventDataDataAdditionalDetails, EventDataDataObjectServer, EventDataDataTaskContent, EventDataDataTaskContentTask, EventDataDataTaskContentTaskRegistrationInfo, EventDataDataTaskContentTaskRegistrationInfoDate, EventDataDataTaskContentTaskRegistrationInfoAuthor, EventDataDataTaskContentTaskTriggers, EventDataDataTaskContentTaskPrincipals, EventDataDataTaskContentTaskPrincipalsPrincipal, EventDataDataTaskContentTaskPrincipalsPrincipalid, EventDataDataTaskContentTaskPrincipalsPrincipalRunLevel, EventDataDataTaskContentTaskPrincipalsPrincipalUserId, EventDataDataTaskContentTaskPrincipalsPrincipalLogonType, EventDataDataTaskContentTaskSettings, EventDataDataTaskContentTaskSettingsMultipleInstancesPolicy, EventDataDataTaskContentTaskSettingsDisallowStartIfOnBatteries, EventDataDataTaskContentTaskSettingsStopIfGoingOnBatteries, EventDataDataTaskContentTaskSettingsAllowHardTerminate, EventDataDataTaskContentTaskSettingsStartWhenAvailable, EventDataDataTaskContentTaskSettingsRunOnlyIfNetworkAvailable, EventDataDataTaskContentTaskSettingsIdleSettings, EventDataDataTaskContentTaskSettingsIdleSettingsStopOnIdleEnd, EventDataDataTaskContentTaskSettingsIdleSettingsRestartOnIdle, EventDataDataTaskContentTaskSettingsAllowStartOnDemand, EventDataDataTaskContentTaskSettingsEnabled, EventDataDataTaskContentTaskSettingsHidden, EventDataDataTaskContentTaskSettingsRunOnlyIfIdle, EventDataDataTaskContentTaskSettingsWakeToRun, EventDataDataTaskContentTaskSettingsExecutionTimeLimit, EventDataDataTaskContentTaskSettingsPriority, EventDataDataTaskContentTaskActions, EventDataDataTaskContentTaskActionsContext, EventDataDataTaskContentTaskActionsExec, EventDataDataTaskContentTaskActionsExecCommand, EventDataDataOldTargetUserName, EventDataDataNewTargetUserName, EventDataDataDeviceId, EventDataDataDeviceDescription, EventDataDataClassId, EventDataDataClassName, EventDataDataVendorIds, EventDataDataCompatibleIds, EventDataDataLocationInformation, EventDataDataAccountName, EventDataDataAccountDomain, EventDataDataLogonID, EventDataDataSessionName, EventDataDataClientName, EventDataDataClientAddress, EventDataDataMajorVersion, EventDataDataMinorVersion, EventDataDataBuildVersion, EventDataDataQfeVersion, EventDataDataServiceVersion, EventDataDataBootMode, EventDataDataStartTime, EventDataDataOldRemark, EventDataDataNewRemark, EventDataDataOldMaxUsers, EventDataDataNewMaxUsers, EventDataDataOldShareFlags, EventDataDataNewShareFlags, EventDataDataOldSD, EventDataDataNewSD, EventDataDataTreeDelete, EventDataDataPuaCount, EventDataDataPuaPolicyId, EventDataDataResourceAttributes, EventDataDataModifiedObjectProperties, EventDataDataDisplayName, EventDataDataDnsHostName, EventDataDataServicePrincipalNames, EventDataDataAttributeSyntaxOID, EventDataDataDummy, EventDataDataComputerAccountChange, EventDataDataMessageNumber, EventDataDataMessageTotal, EventDataDataScriptBlockText, EventDataDataScriptBlockId, EventDataDataPath, EventDataDataImagePath, EventDataDataStartType, EventDataDataAppName, EventDataDataAppVersion, EventDataDataTerminationTime, EventDataDataExeFileName, EventDataDataReportId, EventDataDataPackageFullName, EventDataDataPackageRelativeAppId, EventDataDataHangType, EventDataDataAccessReason, EventDataDataTargetServerName, EventDataDataTargetInfo, EventDataDataTargetProcessId, EventDataDataTargetProcessName, EventDataDataKerberosPolicyChange, EventDataDataSubcategoryId, EventDataBinary.
Central Node and Kaspersky Endpoint Security for Linux
If an event occurred on the user's computer, the application sends the following data to the events database:
- File modification event.
- Details of the process that created the file: process file name, and MD5- and SHA256 hash of the process file.
- Information about the created or modified file: name, path, full name, type, MD5 hash, SHA256 hash, creation date, modification date, attributes, attribute modification date, size, zone ID, application name of the file, vendor, name of the organization that issued the digital certificate, description, digital signature verification result, time of the digital signature, original name, name before modification, path before modification, full name before modification.
- Information about the file to which a link was created: MD5 hash, SHA256 hash, creation date, modification date, attributes, attribute modification date, size, type, zone ID, application name of the file, original name, name of the organization that issued the digital certificate, description, subject of the signature, digital signature verification result, time of the digital signature, full name of the link file.
- File type.
- Owner ID.
- Owner group ID.
- Owner user name.
- Owner group name.
- URL from which the file was retrieved.
- Metadata of the message from which the file was retrieved.
- Requested access flags.
- Indicator of file deletion after a restart.
- File access flags.
- Event in the operating system log.
- Event time.
- Event type.
- Event name.
- Result of the operation.
- Information about the parent process: file path, UniquePID, MD5 or SHA256 hash of the process file, command that was used to start the process.
- Process start event.
Information about files of the parent and grandparent processes, loader processes, creator processes, running processes: name, path, full name, MD5 hash, SHA256 hash, creation date and time, modification date and time, attributes, attribute modification date and time, size, zone ID, vendor, name of the organization that issued the digital certificate, description, original name, digital signature subject, digital signature verification result, date and time of the digital signature, file version, logon type, login session ID, user account type, user name, user account ID, IP address of the computer from which the logon was made, integrity level, process ID, current directory, owner ID, owner group ID, owner user name, owner group name, real user name, real group name, effective group name, effective user name, file access permission flags, URL from which the file was downloaded, metadata of the message from which the file was obtained, process environment variables, command line options, process type.
- Process stop event.
- Information about the file of the process: file name, file path, full name of the file, MD5 or SHA256 hash of the file, file size, and process end time.
- UniquePID.
- Process start options.
- Information about the parent process: file path, UniquePID, MD5 or SHA256 hash of the process file, process start options.
- Detection event and the result of its processing.
- Scan result.
- Name of the detected object.
- ID of the record in application databases.
- Release time of the application databases with which the detection was generated.
- Object processing mode.
- Category of the detected object (for example, name of a virus).
- MD5 hash of the detected object.
- SHA256 hash of the detected object.
- Unique ID of the process.
- PID of the process.
- Process start command line.
- Reason for the error when processing the object.
- DNS lookup event.
- IPv4 address of the DNS server.
- Binary mask of the DNS query being performed.
- DNS response error code.
- DNS query type ID.
- Name of the domain for which the DNS record is to be resolved.
- Date of the DNS response.
- Code injection event.
- Information about the recipient process: application name, full application name, path to the application, MD5 hash of the file, SHA256 hash of the file, URL from which the file was downloaded, metadata of the message to which the downloaded file was attached, unique ID of the application, system ID of the application, command line, name of the process DLL, path to the process DLL, address of the process in the address space.
- Injection method.
- Modified command line of the process.
- System call parameters.
- API call stack at the time of interception of the injection-related function.
Central Node and Kaspersky Endpoint Security for Mac
If an event occurred on the user's computer, the application sends the following data to the events database:
- File creation event.
- Details of the process that created the file: process file name, and MD5- and SHA256 hash of the process file.
- File name.
- Path to the file.
- Full name of the file.
- File type.
- MD5- and SHA256 hash of the file.
- Date of file creation and modification.
- File size.
- Process start event.
Information about files of the parent and grandparent processes, loader processes, creator processes, running processes: name, path, full name, MD5 hash, SHA256 hash, creation date and time, modification date and time, attributes, attribute modification date and time, size, zone ID, vendor, name of the organization that issued the digital certificate, description, original name, digital signature subject, digital signature verification result, date and time of the digital signature, file version, logon type, login session ID, user account type, user name, user account ID, IP address of the computer from which the logon was made, integrity level, process ID, current directory, owner ID, owner group ID, owner user name, owner group name, real user name, real group name, effective group name, effective user name, file access permission flags, URL from which the file was downloaded, metadata of the message from which the file was obtained, process environment variables, command line options, process type.
- Process stop event.
- Information about the file of the process: file name, file path, full name of the file, MD5 or SHA256 hash of the file, file size, and process end time.
- UniquePID.
- Process start options.
- Information about the parent process: file path, UniquePID, MD5 or SHA256 hash of the process file, process start options.
- Threat detection event and detection processing result.
- Scan result.
- Name of the detected object.
- ID of the record in application databases.
- Release time of the application databases with which the detection was generated.
- Object processing mode.
- Category of the detected object (for example, name of a virus).
- MD5 hash of the detected object.
- SHA256 hash of the detected object.
- Unique ID of the process.
- PID of the process.
- Process start command line.
- Reason for the error when processing the object.
Central Node and Sandbox
The Central Node component sends to the Sandbox component files and URLs extracted from the network and email traffic. The files are not changed in any way prior to sending. The Sandbox component sends scan results to the Central Node component.
Central Node and Sensor
The application may transmit the following data between Central Node and Sensor components:
- Files and email messages.
- Data on alerts generated by the Intrusion Detection System and URL Reputation technologies.
- License information.
- List of data excluded from the scan.
- Data of the Endpoint Sensors application, if integration with a proxy server has been configured.
- Application databases, if receiving database updates from the Central Node component is configured.
Servers with PCN and SCN roles
If the application is running in distributed solution mode, data about the following things is transmitted between the PCN and connected SCNs:
- Alerts.
- Events.
- Tasks.
- Policies.
- Scans using IOC, TAA (IOA), IDS, YARA user rules.
- Files in Storage.
- User accounts.
- The license.
- The list of computers with the Endpoint Agent component.
- Objects placed in Storage.
- Objects quarantined on computers with the Endpoint Agent component.
- Files attached to detections.
- IOC and YARA files.
Data contained in application trace files
Kaspersky Anti Targeted Attack Platform resources provide no capability to restrict the rights of the users of servers and operating systems to which the Central Node component is installed. The administrator is advised to use any system resources at their own discretion to control how the users of servers and operating systems with the application installed may be granted access to the personal data of other users.
Trace files can include any personal data of the user or confidential data of your organization. Files are stored in the /var/log/kaspersky directory indefinitely.
Data of Kaspersky Endpoint Agent for Windows
You can view detailed information about Kaspersky Endpoint Agent data that is stored and processed locally in the Online Help of the application:
- Data in requests to the KATA Central Node component.
- Service data.
- Data contained in trace files and dumps.
- Information about acceptance of the KSN Statement.
- Windows Event Log event data.
Data received from the Central Node component
Kaspersky Endpoint Agent saves the values of settings received from the Central Node component on the hard drive of the computer. Data is saved in open non-encrypted form in the folder C:\ProgramData\Kaspersky Lab\Endpoint Agent\protected\data.
By default, only users with System and Administrator permissions have read-access to files when Self-Defense is enabled. When Self-Defense is disabled, users with System and Administrator permissions can also delete the files, modify their contents, and modify the access rights to them. The Kaspersky Endpoint Agent application does not manage access permissions to this folder or any files in it. It is the system administrator who determines access permissions.
The data is deleted when Kaspersky Endpoint Agent is removed.
Data received from the Central Node component may contain the following information:
- Data on network connections.
- Data on the operating system that is installed on the server with the Central Node component.
- Data on operating system user accounts.
- Data on user sessions in the operating system.
- Data on Windows event log.
- About a RT_VERSION resource.
- About the contents of a PE file.
- About operating system services.
- Certificate of the server with the Central Node component.
- URL- and IP addresses of visited websites.
- HTTP protocol headers.
- Computer name.
- MD5 hashes of files.
- Unique ID of the computer with Kaspersky Endpoint Agent.
- Names and values of Windows registry keys.
- Paths to Windows registry keys.
- Names of Windows registry variables.
- Name of the local DNS cache entry.
- Address from the local DNS cache entry in IPv4 format.
- IP address or name of the requested host from the local DNS cache.
- Host of the local DNS cache element.
- Domain name of the local DNS cache element.
- Address of the ARP cache element in IPv4 format.
- Physical address of the ARP cache element.
- Serial number of the logical drive.
- Home folder of the local user.
- Name of the user account that started the process.
- Path to the script that is run when the user logs in to the system.
- Name of the user account under which the event occurred.
- Name of the computer where the event occurred.
- Full paths to files on computers with Kaspersky Endpoint Agent.
- Names of files on computers with Kaspersky Endpoint Agent.
- Masks of files on computers with Kaspersky Endpoint Agent.
- Full names of folders on computers with Kaspersky Endpoint Agent.
- Comments of the file publisher.
- Mask of the process file image.
- Path to the process file image that opened the port.
- Name of the process that opened the port.
- Local IP address of the port.
- Trusted public key of the digital signature of executable modules.
- Process name.
- Process segment name.
- Command-line parameters.
Data in alerts and events
Event data is saved in binary form in the folder C:\ProgramData\Kaspersky Lab\Endpoint Agent\protected\kata in open non-encrypted form.
Event data can contain information related to the following:
- Data on executable modules.
- Data on network connections.
- About the operating system that is installed on the computer with Kaspersky Endpoint Agent.
- Data on user sessions in the operating system.
- Data on operating system user accounts.
- Data on Windows event log.
- About alerts of Kaspersky Endpoint Security for Windows.
- About organizational units (OU) of Active Directory.
- HTTP protocol headers.
- Fully qualified domain name of the computer.
- MD5- and SHA256 hash of files and their fragments.
- Unique ID of the computer with Kaspersky Endpoint Agent.
- Unique IDs of certificates.
- Certificate publisher.
- Certificate subject.
- Name of the algorithm used to generate the certificate fingerprint.
- Address and port of the local network interface.
- Address and port of the remote network interface.
- Application vendor.
- Application name.
- Name of the Windows registry variable.
- Path to the Windows registry key.
- Windows registry variable data.
- Name of the detected object.
- Kaspersky Security Center Network Agent ID.
- Contents of the hosts file.
- Process start command line.
Data contained in task completion reports
Prior to being sent to the Central Node component, the reports and relevant files are temporarily saved on the hard drive of the computer with the Kaspersky Endpoint Agent application. The task completion reports are saved in archived non-encrypted form in the folder C:\ProgramData\Kaspersky Lab\Endpoint Agent\protected\kata\data_queue.
By default, only users with System and Administrator permissions have read-access to files when Self-Defense is enabled. When Self-Defense is disabled, users with System and Administrator permissions can also delete the files, modify their contents, and modify the access rights to them. The Kaspersky Endpoint Agent application does not manage access permissions to this folder or any files in it. It is the system administrator who determines access permissions.
Task completion reports contain the following information:
- Data on task output.
- Data on executable modules.
- Data on operating system processes.
- Data on user accounts.
- Data on user sessions.
- Fully qualified domain name of the computer.
- Unique ID of the computer with Kaspersky Endpoint Agent.
- Files of the computer with Kaspersky Endpoint Agent.
- Names of .
- Full paths to files on the computer with Kaspersky Endpoint Agent.
- Full names of folders on the computer with Kaspersky Endpoint Agent.
- Content of the process standard output.
- Content of the process standard error stream.
Data contained in an install log
The administrator can enable the Kaspersky Endpoint Agent installation log (using the msiexec standard procedure) during installation using the command line. The administrator shows the path to the file where the install log will be saved.
The log records installation process steps and the msiexec command line containing the address of the server hosting the Central Node component and the path to the install log file.
Data on files that are blocked from starting
Data on files that are blocked from starting is stored in open non-encrypted form in the folder C:\ProgramData\Kaspersky Lab\Endpoint Agent\protected\kata.
By default, only users with System and Administrator permissions have read-access to files when Self-Defense is enabled. When Self-Defense is disabled, users with System and Administrator permissions can also delete the files, modify their contents, and modify the access rights to them. The Kaspersky Endpoint Agent application does not manage access permissions to this folder or any files in it. It is the system administrator who determines access permissions.
Data on files that are blocked from starting may contain the following information:
- Full path to the blocked file.
- MD5 hash of the file.
- SHA256 hash of the file.
- Process start command.
Data related to the performance of tasks
When performing a task for placing a file in quarantine, the archive containing this file is temporarily saved in one of the following folders:
- C:\ProgramData\Kaspersky Lab\Endpoint Agent\protected\kata\temp for Kaspersky Endpoint Agent that is installed as part of Kaspersky Endpoint Security.
- C:\ProgramData\Kaspersky Lab\Endpoint Agent\protected\data\kata\temp for Kaspersky Endpoint Agent that is installed from the Kaspersky Anti Targeted Attack Platform distribution kit.
When performing an application run task on a host, Kaspersky Endpoint Agent locally stores the contents of standard output streams and errors of the running process in plain unencrypted form until the task completion report is sent to the Central Node component. Files are stored in one of the following folders:
C:\ProgramData\Kaspersky Lab\Endpoint Agent\protected\kata\tempfor Kaspersky Endpoint Agent that is installed as part of Kaspersky Endpoint Security.C:\ProgramData\Kaspersky Lab\Endpoint Agent\protected\data\kata\tempfor Kaspersky Endpoint Agent that is installed from the Kaspersky Anti Targeted Attack Platform distribution kit.
By default, only users with System and Administrator permissions have read-access to files when Self-Defense is enabled. When Self-Defense is disabled, users with System and Administrator permissions can also delete the files, modify their contents, and modify the access rights to them. The Kaspersky Endpoint Agent application does not manage access permissions to this folder or any files in it. It is the system administrator who determines access permissions.
Kaspersky Endpoint Security for Windows data
For detailed information about data transmitted by Kaspersky Endpoint Security, see the Online Help of the application:
- Provision of data under the End User License Agreement.
- Provision of data when Kaspersky Security Network is used.
- Compliance with European Union law (GDPR).
- Provision of data when using Detection and Response → Kaspersky Anti Targeted Attack Platform (EDR) solutions.
Kaspersky Endpoint Security for Linux data
For detailed information about data transmitted by Kaspersky Endpoint Security, see the Online Help of the application.
Page top
Kaspersky Endpoint Security for Mac data
For detailed information about data transmitted by Kaspersky Endpoint Security, see the Online Help of the application.
Page top
Application licensing
This section covers the main aspects of Kaspersky Anti Targeted Attack Platform licensing.
About the End User License Agreement
The End User License Agreement (EULA) is a binding agreement between you and AO Kaspersky Lab, stipulating the terms on which you may use the application.
Read through the terms of the End User License Agreement carefully before you start using the application.
You can view the terms of the End User License Agreement (EULA) in the following ways:
- During installation of Kaspersky Anti Targeted Attack Platform.
- By reading the text named /EULA/License.<language>.
This file is included in the application distribution kit.
- In the application web interface, in the Settings section, License subsection, by clicking the License Agreement button.
- In the web interface of the Sandbox component, in the
 menu, by clicking the End User License Agreement link.
By confirming that you agree with the End User License Agreement when installing the application, you signify your acceptance of the terms of the EULA. If you do not accept the terms of the End User License Agreement, you must abort application installation and must not use the application.
Page top
About the license certificate
The License Certificate is a document provided with the key file or activation code.
The License Certificate contains the following license information:
- License key or order number.
- Details of the license holder.
- Information about the application that can be activated using the license.
- Limitation on the number of licensing units (devices on which the application can be used under the license).
- License start date.
- License expiration date or license validity period.
- License type.
About the license
A license is a limited-time right to use Kaspersky Anti Targeted Attack Platform granted under the terms and conditions of the End User License Agreement (EULA).
The scope of services and application usage term depend on the type of license under which the application is activated.
Kaspersky Anti Targeted Attack Platform provides the following types of licenses:
- NFR (not for resale) is a free license for a set period, intended to familiarize the user with the application and to carry out test deployments.
- Commercial—Paid license that is provided when you buy the application.
When the license expires, the application continues to work but with limited functionality. To use the application full functionality, you must purchase a commercial license or renew a commercial license.
We recommend renewing your license no later than its expiration date to prevent interrupting the protection of your device against computer security threats.
The update functionality (including anti-virus signature updates and code base updates) may be unavailable in the territory of the USA.
In the current version of Kaspersky Anti Targeted Attack Platform, the available functionality of the application also depends on the type of the added license key.
Page top
About the license key
A license key is a sequence of bits used to activate and use the application in accordance with the End User License Agreement. A license key is generated by Kaspersky.
You can add a license key to the application by applying a key file or entering an activation code. After you add the license key to the application, it is displayed in the application interface as a unique alphanumeric sequence.
Kaspersky can block a license key over violations of the End User License Agreement. If a license key has been blocked, you must add a different license key to use the application.
In the current version of Kaspersky Anti Targeted Attack Platform, the available functionality of the application depends on the type of the added license key:
- KATA + NDR and KEDR license keys. Full functionality of the application.
- KEDR license key. Receiving and processing of data from network traffic and mail traffic is limited.
- KATA + NDR license key. The web interface sections Threat Hunting, Tasks, Prevention, Custom rules, Storage, and Assets have limited functionality.
- KATA license key. The functionality in the Threat Hunting, Tasks, Prevention, Custom rules, Storage, Assets sections of the web interface is limited, the functionality of saving and downloading network traffic in the SPAN traffic processing section is limited.
About the key file
A key file is a file with the .key extension that you receive from Kaspersky. Key files are designed to activate the application by adding a license key.
The key file is sent to the email address that you specified after purchasing Kaspersky Anti Targeted Attack Platform or after ordering Kaspersky Anti Targeted Attack Platform with the NFR license type.
You do not need to connect to Kaspersky activation servers in order to activate the application with a key file.
You can recover a key file if it is accidentally deleted. You may need a key file to register with Kaspersky CompanyAccount.
To recover a key file, you must do one of the following:
- Contact the vendor you bought the license from.
- Get a key file on the Kaspersky website using your activation code.
About the activation code
An activation code is a unique sequence of twenty Latin characters and numerals. You enter an activation code to add a license key that activates Kaspersky Anti Targeted Attack Platform. The activation code is sent to the email address that you specified after purchasing Kaspersky Anti Targeted Attack Platform or after ordering Kaspersky Anti Targeted Attack Platform with the NFR license type.
To activate the application using an activation code, you need internet access for connecting to Kaspersky activation servers.
If you lose your activation code after activating the application, contact the Kaspersky partner from which you purchased the license.
Page top
About the subscription
A subscription to Kaspersky Anti Targeted Attack Platform is an order for using a solution with the chosen parameters (expiration date of the subscription, number of protected devices).
The subscription is limited (for example, for one year). To continue using Kaspersky Anti Targeted Attack Platform after your limited subscription expires, you must renew the subscription. If the subscription is not renewed, Kaspersky Anti Targeted Attack Platform continues operating in limited functionality mode.
To use Kaspersky Anti Targeted Attack Platform under a subscription, you must enter an activation code. After applying the activation code, a license key is added that determines the license for using the application under the subscription. Information about the license key is displayed in the web interface of the Central Node server.
Activation codes purchased under subscription cannot be used to activate previous versions of Kaspersky Anti Targeted Attack Platform.
Page top
Adding a license key
In distributed solution mode, a key can be replaced only on the PCN server.
You can add a license key to Kaspersky Anti Targeted Attack Platform in one of the following ways:
- Enter an activation code.
- Upload a key file.
To add a license key to Kaspersky Anti Targeted Attack Platform using an activation code:
- In the window of the application web interface, select the Settings section, License subsection.
- Click Enter an activation code in the section of the functional block that you want to activate: KATA/NDR or KEDR.
This opens the activation window.
- In the field, enter the activation code that was sent to the email address that you provided.
- Carefully read the Kaspersky Security Network Statement and select one of the following options:
- I agree to participate in KSN, if you accept the terms of the KSN Statement and want to participate in KSN.
- I do not agree to participate in KSN, if you do not accept the terms of the KSN Statement and do not want to participate in KSN.
If you do not agree with the terms of the Statement, use of Kaspersky Security Network will not be enabled.
- Click Apply.
The license key is added to the application.
To add a license key to Kaspersky Anti Targeted Attack Platform using a key file:
- In the window of the application web interface, select the Settings section, License subsection.
- Click Upload a key file in the section of the functional block that you want to activate: KATA/NDR or KEDR.
This opens the activation window.
- Click Upload.
This opens the file selection window.
- Select a key file to download and click the Open button.
This closes the file selection window.
- Carefully read the Kaspersky Security Network Statement and select one of the following options:
- I agree to participate in KSN, if you accept the terms of the KSN Statement and want to participate in KSN.
- I do not agree to participate in KSN, if you do not accept the terms of the KSN Statement and do not want to participate in KSN.
If you do not agree with the terms of the Statement, use of Kaspersky Security Network will not be enabled.
- Click Apply.
The license key is added to the application.
Page top
Replacing the license key
In distributed solution mode, a key can be replaced only on the PCN server.
You can replace the license key of Kaspersky Anti Targeted Attack Platform with a different license key in one of the following ways:
- Replace with activation code.
- Replace with a key file.
To replace the current license key of Kaspersky Anti Targeted Attack Platform by entering an activation code:
- In the window of the application web interface, select the Settings section, License subsection.
- ClickReplace in the section of the functional block that you want to activate: KATA/NDR or KEDR. In the displayed drop-down list, select Replace using an activation code.
This opens the license key replacement window.
- In the field, enter the activation code that was sent to the email address that you provided.
- Carefully read the Kaspersky Security Network Statement and select one of the following options:
- I agree to participate in KSN, if you accept the terms of the KSN Statement and want to participate in KSN.
- I do not agree to participate in KSN, if you do not accept the terms of the KSN Statement and do not want to participate in KSN.
If you do not agree with the terms of the Statement, use of Kaspersky Security Network will not be enabled.
- Click Apply.
The license key is replaced.
To add a license key to Kaspersky Anti Targeted Attack Platform using a key file:
- In the window of the application web interface, select the Settings section, License subsection.
- Click Replace in the section of the functional block that you want to activate: KATA/NDR or KEDR. In the displayed drop-down list, select Replace using a key file.
This opens the license key replacement window.
- Click Upload.
This opens the file selection window.
- Select a key file to download and click the Open button.
This closes the file selection window.
- Carefully read the Kaspersky Security Network Statement and select one of the following options:
- I agree to participate in KSN, if you accept the terms of the KSN Statement and want to participate in KSN.
- I do not agree to participate in KSN, if you do not accept the terms of the KSN Statement and do not want to participate in KSN.
If you do not agree with the terms of the Statement, use of Kaspersky Security Network will not be enabled.
- Click Apply.
The license key is replaced.
Page top
Removing a license key
In distributed solution mode, a license key can be removed only on the PCN server.
You can remove a license key that was added to Kaspersky Anti Targeted Attack Platform. After the license key is removed, the application enters the limited functionality mode.
To remove a license key:
- In the window of the application web interface, select the Settings section, License subsection.
- Click Delete in the section of the functional block whose license key you want to remove: KATA/NDR or KEDR.
This opens the license key removal confirmation window.
- Click Yes.
The key removal confirmation window closes.
The license key is removed.
Page top
Viewing information about added license keys in the web interface of the Central Node
In
and , you can view information about the license and added keys in the web interface of PCN servers and all connected SCNs under the account of a local administrator, administrator, or users of the application web interface.To view the information about added license keys,
in the web interface of the Central Node server, select the Settings section, License subsection.
The web interface displays the following information about the KATA/NDR license key:
- Serial number.
- Feature set.
- Activation date.
- Expiration date.
- Days remaining.
The web interface displays the following information about the KEDR license key:
- Serial number.
- Activation date.
- Expiration date.
- Days remaining.
During the period within 30 days of license expiration, the Dashboard section displays a notification about the need to renew the license. This notification is displayed on all servers with the Central Node component (in distributed solution and multitenancy mode – on PCNs and all connected SCNs) for all users, regardless of their role.
Viewing the text of the End User License Agreement in the web interface of the Central Node
In distributed solution and multitenancy mode, you can view the text of the End User License Agreement in the web interface of PCN servers and all connected SCNs under the account of a local administrator, administrator, or users of the application web interface.
To view the text of the End User License Agreement, perform the following steps in the web interface of the server hosting the Central Node component:
- Select section Settings, subsection License.
- Click the License Agreement button in the upper-right corner of the workspace.
- In the opened window, carefully read the text of the End User License Agreement.
- When you are done, click the Close button.
Viewing the text of the Privacy Policy in the web interface of the Central Node
In distributed solution and multitenancy mode, you can view the text of the Privacy Policy in the web interface of PCN servers and all connected SCNs under the account of a local administrator, administrator, or users of the application web interface.
To view the text of the Privacy Policy, perform the following steps in the web interface of the server hosting the Central Node component:
- Select section Settings, subsection License.
- Click the Privacy Policy button in the upper-right corner of the workspace.
- In the opened window, carefully read the text of the Privacy Policy.
- When you are done, click the Close button.
Viewing information about the third-party code used in the application
In distributed solution and multitenancy mode, you can view information about third-party code used in Kaspersky Anti Targeted Attack Platform in the web interface of PCN servers and all connected SCNs under the account of a local administrator, administrator, or users of the application web interface.
To view information about third-party code, perform the following steps in the web interface of the server hosting the Central Node component:
- Select section Settings, subsection License.
- Click the Third-party code button in the upper-right corner of the workspace.
- In the opened window, view the information about third-party code.
- When you are done, click the Close button.
Viewing the text of the End User License Agreement in the web interface of the Sandbox
To view the text of the End User License Agreement in the web interface of the Sandbox server:
- Sign in to the Sandbox web interface using the account credentials that you specified during installation of the Sandbox component.
- Click the button in the lower-left part of the web interface window.
- This opens a window containing information about the Sandbox component.
- Click the End User License Agreement link to open the window containing the text of the End User License Agreement for the application.
- Carefully read the text of the End User License Agreement.
- When you are done, click the
 button.
Viewing the text of the End User License Agreement for the Endpoint Agent component
You can view the text of the End User License Agreement for the application that is being used as the Endpoint Agent component. For details on how to view the text of the End User License Agreement, see the Online Help for the relevant application.
About the Kaspersky Endpoint Agent for Windows End User License Agreement
About the Kaspersky Endpoint Security for Windows End User License Agreement
About the Kaspersky Endpoint Security for Linux End User License Agreement
About the Kaspersky Endpoint Security for Mac End User License Agreement
Application modes based on the license
Kaspersky Anti Targeted Attack Platform provides various operating modes depending on the added license keys.
No license
After the application is installed and the web interface is started, the application operates in this mode until you add a license key.
Unlicensed mode has the following limitations:
- Application databases are not updated.
- There is no connection to the Kaspersky Security Network Knowledge Base.
- Receiving and processing of data from network traffic and mail traffic is limited.
- The web interface sections Threat Hunting, Tasks, Prevention, Custom rules, Storage, and Assets have limited functionality.
Commercial
To switch to the Commercial mode, you must replace the license key or add a new license key for the commercial license.
In this mode, the application:
- Updates databases.
- Connects to the Kaspersky Security Network Knowledge Base.
Removal of the other limitations described for the Unlicensed mode in the current version of Kaspersky Anti Targeted Attack Platform depends on the type of added license key:
- KATA + NDR and KEDR license keys. Full functionality of the application.
- KEDR license key. Receiving and processing of data from network traffic and mail traffic is limited.
- KATA + NDR license key. The web interface sections Threat Hunting, Tasks, Prevention, Custom rules, Storage, and Assets have limited functionality.
- KATA license key. The functionality in the Threat Hunting, Tasks, Prevention, Custom rules, Storage, Assets sections of the web interface is limited, the functionality of saving and downloading network traffic in the SPAN traffic processing section is limited.
Architecture of the application
The application includes the following main components:
- Sensor. Receives and scans data, can also be used as a proxy server during data exchange between Endpoint Agent and Central Node.
- Central Node. Receives and scans data, analyzes the behavior of objects, and publishes analysis results in the web interface of the application.
- Sandbox. Starts virtual images of operating systems. Starts files in these operating systems and tracks the behavior of files in each operating system to detect malicious activity and signs of targeted attacks to the corporate IT infrastructure.
- Endpoint Agent. Installed on workstations and servers in the IT infrastructure of the organization. Continuously monitors processes running on those computers, active network connections, and files that are modified.
Sensor component
The component can be deployed on the same server with the Central Node (built-in Sensor) or on a standalone server.
The following modules of Kaspersky Anti Targeted Attack Platform run on each Sensor server:
- Sensor. Receives data from network and mail traffic and sends the data for processing to the server with the Central Node component.
- Intrusion Detection System (hereinafter also referred to as IDS). Scans the Internet traffic for signs of intrusions into the corporate IT infrastructure.
- KSN. Checks the reputation of files and URL addresses in the Knowledge Base of Kaspersky Security Network on behalf of Kaspersky Anti Targeted Attack Platform and provides information about categories of websites (for example, malicious website, phishing website).
Kaspersky Security Network (hereinafter also "KSN") is an infrastructure of online services that provides access to Kaspersky's online Knowledge Base with information on the reputation of files, web resources, and software. The use of data from Kaspersky Security Network ensures faster responses by Kaspersky applications to threats, improves the performance of some protection components, and reduces the likelihood of false alarms.
If you do not want to participate in KSN, you can use Kaspersky Private Security Network (hereinafter also referred to as KPSN). KPSN is a solution that allows users to access the reputation databases of Kaspersky Security Network and other statistical data without actually sending data from their own computers to Kaspersky Security Network.
- URL Reputation. Detects malicious and phishing URL addresses, and URL addresses that were previously used by hackers in targeted attacks against and intrusions into the corporate IT infrastructure.
In the Sensor role, you can also use a mail sensor, which is a server or a virtual machine on which Kaspersky Secure Mail Gateway (KSMG) or Kaspersky Security for Linux Mail Server (KLMS) is installed. These applications send email messages to Kaspersky Anti Targeted Attack Platform for processing. Based on the results of processing of email messages in Kaspersky Anti Targeted Attack Platform, KSMG and KLMS may block the transfer of messages.
The Sensor can also be used as a proxy server for outgoing connections from the Endpoint Agent component.
If KSMG or KLMS is being used in the Sensor role, scan exclusion lists configured for message recipients and MD5 checksums of files are not transmitted to KSMG and KLMS and are not applied when messages are processed by KSMG and KLMS.
Central Node component
The component can be deployed on one server or as a high availability cluster that consists of 2 roles: storage servers and processing servers.
High availability is achieved through duplication of data between the storage servers and the redundancy of computing resources: if one server fails, its functions are performed by another server with the same role. Meanwhile, the Kaspersky Anti Targeted Attack Platform continues to work.
Only one failure of a server in a cluster is tolerated. If multiple servers fail, the cluster becomes inoperable.
The following application modules, kernels and technologies run on each server or cluster with the Central Node component:
- Anti-Malware Engine (hereinafter also referred to as AM or AM Engine). Scans files and objects for viruses and other threats to the corporate IT infrastructure using anti-virus databases.
- Mobile Attack Analyzer (also referred to as MAA). Scans executable files in the APK format in the cloud infrastructure using a machine learning technology. As a result of the scan, Kaspersky Anti Targeted Attack Platform receives information about detected threats or absence of threats.
- YARA. Scans files and objects for signs of targeted attacks on the corporate IT infrastructure using YARA Rules databases created by users of Kaspersky Anti Targeted Attack Platform.
- Targeted Attack Analyzer (hereinafter also referred to as TAA or TA Analyzer). Analyzes and monitors network activity of software installed on computers of the corporate LAN using TAA (IOA) rules. Searches for signs of network activity that the user of Kaspersky Anti Targeted Attack Platform is advised to direct his/her attention, as well as signs of targeted attacks to the corporate IT infrastructure.
- KSN. Checks the reputation of files and URL addresses in the Knowledge Base of Kaspersky Security Network on behalf of Kaspersky Anti Targeted Attack Platform and provides information about categories of websites (for example, malicious website, phishing website).
Sandbox component
Servers hosting the Sandbox component run virtual machines with images of operating systems.
The Sandbox component starts objects in these operating systems and analyzes the behavior of the objects to detect malicious activity and signs of targeted attacks to the corporate IT infrastructure.
By default, the maximum file size scanned by the Sandbox module is 100 MB. You can configure scan settings in the administrator menu of the application management console.
The maximum level of nesting for scanned archives is 32.
The maximum number of objects that can be in queue to be scanned by the Sandbox component per day is 20,000 objects. When this limit is reached, the application deletes 10% of the objects that have been queued for scanning the longest and replaces them with new objects queued for scanning. The deleted objects are saved in the application with the NOT_SCANNED status.
Endpoint Agent component
Software component.
For KEDR functionality, can be represented by the following applications:
- Kaspersky Endpoint Agent for Windows
- Kaspersky Endpoint Security for Windows
- Kaspersky Endpoint Security for Linux
- Kaspersky Endpoint Security for Mac
For NDR functionality, can be represented by the following applications:
- Kaspersky Endpoint Security for Windows
- Kaspersky Endpoint Security for Linux
The applications are installed on workstations and servers in the IT infrastructure of the organization (hereinafter also referred to as "computers"). On these computers, the applications continually monitor processes, active network connections, and files being modified, and send this monitoring data to the Central Node server.
Computers intended for installation of applications must meet hardware and software requirements.
Operating principle of the application
The Kaspersky Anti Targeted Attack Platform application includes three functional blocks:
- Kaspersky Anti Targeted Attack (hereinafter also referred to as "KATA"), which detects threats on the perimeter of the enterprise IT infrastructure.
- Kaspersky Endpoint Detection and Response (hereinafter also referred to as "KEDR"), which provides protection for the local area network of the organization.
- Network Detection and Response (hereinafter also referred to as "NDR"), which provides protection of the corporate LAN.
You can use the full functionality of the application (KATA + NDR key and KEDR key) or partial functionality (only KATA/KATA + NDR key or only KEDR key).
Principle of operation of Kaspersky Anti Targeted Attack
Kaspersky Anti Targeted Attack includes the following components:
- Sensor.
- Central Node.
- Sandbox.
Sensor, Central Node and Sandbox interoperate as follows:
- The Sensor component receives mirrored SPAN, ERSPAN, RSPAN traffic, objects and metadata of HTTP, FTP, SMTP, and DNS protocols, HTTP and FTP traffic data, as well as HTTPS traffic data (if the administrator has configured SSL certificate replacement on the proxy server), copies of email messages, and does the following with the gathered data:
- Scans Internet traffic for signs of intrusion into the corporate IT infrastructure using the Intrusion Detection System technology (hereinafter also referred to as IDS).
IDS technology can recognize and detect network activity in 80 protocols, particularly in 53 application layer protocols of the TCP/IP model, detecting suspicious traffic and network attacks. Supported protocols include TCP, UDP, FTP, TFTP, SSH, SMTP, SMB, CIF, SSL, HTTP, HTTP/2, HTTPS, TLS, ICMPv4, ICMPv6, IPv4, IPv6, IRC, LDAP, NFS, DNS, RDP, DCERPC, MS-RPC, WebSocket, Citrix and others.
- Checks the reputation of files and URLs against the Kaspersky Security Network database (hereinafter also referred to as "KSN") or Kaspersky Private Security Network (hereinafter also referred to as "KPSN").
- Sends objects and files to be scanned by the Central Node component.
You can also use a mail sensor as a Sensor component, which is a server or virtual machine on which Kaspersky Secure Mail Gateway (KSMG) or Kaspersky Security for Linux Mail Server (KLMS) is installed.
- Scans Internet traffic for signs of intrusion into the corporate IT infrastructure using the Intrusion Detection System technology (hereinafter also referred to as IDS).
- The Central Node component scans files and objects using anti-virus databases, YARA rule databases created by Kaspersky Anti Targeted Attack users, and if necessary, sends files and objects to be scanned by the Sandbox component.
- The Sandbox component analyzes the behavior of objects in virtual operating systems to detect malicious activity and signs of targeted attacks on corporate IT infrastructure, and sends scan results to the Central Node server.
If any threats are detected, the Central Node server records relevant information in the alert database. You can view the alert table in the Alerts section of the application web interface or by generating an alert report.
Alert information can also be published to a SIEM system that is used in your organization, as well as external systems. Information on Sandbox component alerts can be published in the local reputation database of Kaspersky Private Security Network.
Principle of operation of Kaspersky Endpoint Detection and Response
Kaspersky Endpoint Detection and Response includes the following components:
- Central Node.
- Endpoint Agent.
The component may be represented by any of the following applications: Kaspersky Endpoint Agent for Windows, Kaspersky Endpoint Security for Windows, Kaspersky Endpoint Security for Linux, Kaspersky Endpoint Security for Mac.
- Sandbox.
Optional component.
The Sensor component can be used as a proxy server for outgoing connections from Kaspersky Endpoint Agent.
The Endpoint Agent and Central Node components interoperate as follows:
One of the applications that represents the Endpoint Agent component is installed on individual computers within the corporate IT infrastructure and continuously monitors processes, open network connections, and files being modified. The monitoring data are sent to the Central Node server. Events are generated based on these data.
- Kaspersky Endpoint Agent for Windows transmits data about the following events to the Central Node server: Process started, Process terminated, Module loaded, Connection to remote host, Blocked application (prevention rule), Document blocked, File changed, System event log, Registry modified, Port listened, Driver loaded, Process: interpreted file run, Process: console interactive input, Detection, Detection processing result, AMSI scan.
- Kaspersky Endpoint Security for Windows transmits data about the following events to the Central Node server: Process started, Process terminated, Module loaded, Connection to remote host, Blocked application (prevention rule), Document blocked, File changed, System event log, Registry modified, Port listened, Driver loaded, Process: interpreted file run, Process: console interactive input, Detection, Detection processing result, AMSI scan, DNS, Code injection, Named pipe, WMI, LDAP.
- Kaspersky Endpoint Security for Linux transmits data about the following events to the Central Node server: Process started, Process terminated, Blocked application (prevention rule), Document blocked, File changed, System event log, Detection, Detection processing result, Code injection, DNS.
- Kaspersky Endpoint Security for Mac transmits data about the following events to the Central Node server: Process started, Process terminated, File changed, Detection, Detection processing result.
Endpoint Agent for the NDR functionality connects separately and does not send observation information to the Central Node server.
The Kaspersky Endpoint Agent for Windows can be integrated with Endpoint Protection Platform (hereinafter also "EPP") applications:
- Kaspersky Endpoint Security for Windows.
- Kaspersky Security for Windows Server.
- Kaspersky Security for Virtualization Light Agent for Windows.
Information about compatibility of Kaspersky Endpoint Agent for Windows versions with EPP applications is provided in the Compatibility of Kaspersky Endpoint Agent for Windows versions with EPP applications section.
In this case, Kaspersky Endpoint Agent also sends information about threats detected by the EPP applications and results of threat processing by these applications to the Central Node server.
EPP applications, Kaspersky Endpoint Agent, and Central Node components interoperate as follows:
- EPP applications send information about detected threats and results of threat processing to Kaspersky Endpoint Agent.
Kaspersky Endpoint Security for Windows can also supply Kaspersky Endpoint Agent for Windows with information about third-party applications with Antimalware Scan Interface support (hereinafter also referred to as "AMSI") sending objects (for example, PowerShell scripts) to Kaspersky Endpoint Security for Windows for additional scanning.
- Kaspersky Endpoint Agent sends data gathered while monitoring processes, open network connections, and files being modified, as well as data received from EPP applications, to the Central Node server.
The Central Node server processes received data and displays the corresponding events in the application web interface.
EPP application data processing generates Detection, Detection processing result, AMSI scan events (when Kaspersky Endpoint Agent for Windows is integrated with Kaspersky Endpoint Security for Windows).
Events arriving at the Central Node server are marked by TAA (IOA) rules. As a result of this markup, alerts can be generated for events that require user attention. If you have the Sandbox component, you can also automatically send files from Kaspersky Endpoint Agent hosts to be scanned by the Sandbox component in accordance with Kaspersky TAA (IOA) rules.
When the Central Node server is integrated with Kaspersky Endpoint Agent for Windows and Kaspersky Endpoint Security for Windows, you can do the following to react to detected threats:
- Manage files and applications by running the following tasks on Kaspersky Endpoint Agent hosts: Kill process, Get forensics, Start YARA scan, Run application, Get file, Delete file, Quarantine file, Restore file from quarantine, Manage services, Get disk image, Get memory dump.
- Configure policies for preventing the running of files and processes on selected hosts.
- Isolate individual hosts from the network.
- Work with TAA (IOA) rules to classify and analyze events.
- Work with OpenIOC compliant files (IOC files) to search for signs of targeted attacks, infected and probably infected objects on hosts and in the Alerts database.
- Perform Threat Response actions using the API.
When the Central Node server is integrated with Kaspersky Endpoint Security 11.4 for Linux and Kaspersky Endpoint Security for Mac, you can do the following to react to detected threats:
- Manage files and applications by running Get file, Run application tasks.
- Work with TAA (IOA) rules to classify and analyze events.
- Perform the following Threat Response actions using the API: Managing the application run task.
When the Central Node server is integrated with Kaspersky Endpoint Security 12 for Linux, you can do the following to react to detected threats:
- Manage files and applications by running Get file, Run application, Delete file, Kill process tasks.
- Isolate individual hosts from the network.
- Work with OpenIOC compliant files (IOC files) to search for signs of targeted attacks, infected and probably infected objects on hosts and in the Alerts database.
- Perform the following Threat Response actions using the API: Host network isolation management, Managing the application run task.
When the Central Node server is integrated with Kaspersky Endpoint Security 12.2 for Linux, you can do the following to react to detected threats:
- Manage files and applications by running Get file, Run application, Delete file, Kill process, Quarantine file, Restore file from quarantine tasks.
- Configure policies for preventing the running of files and processes on selected hosts.
- Isolate individual hosts from the network.
- Work with OpenIOC compliant files (IOC files) to search for signs of targeted attacks, infected and probably infected objects on hosts and in the Alerts database.
- Perform the following Threat Response actions using the API: Host network isolation management, Managing the application run task, Managing prevention rules.
The principle of operation of Kaspersky Anti Targeted Attack Platform is shown in the following picture.
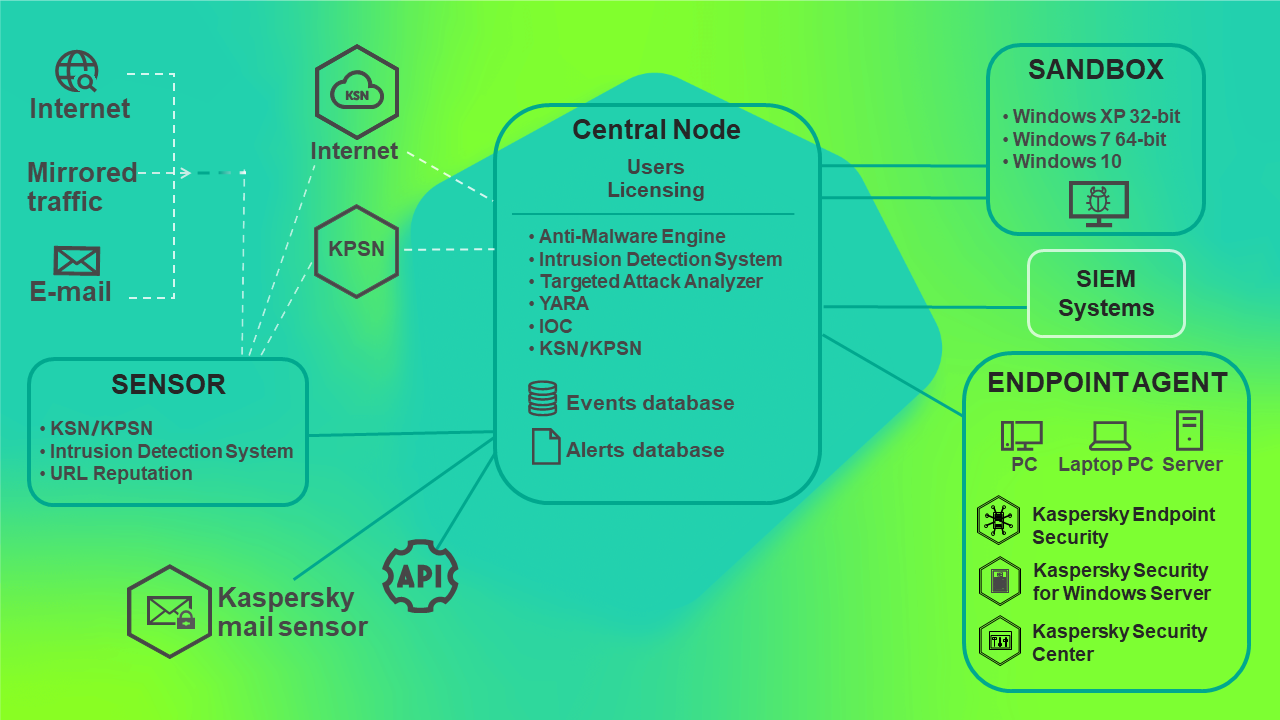
Principle of operation of Kaspersky Anti Targeted Attack Platform
You can configure settings of each Central Node component individually or manage several components in a centralized way in distributed solution mode.
A distributed solution is a two-tier hierarchy of Central Node servers. This structure sets apart a primary control server known as the Primary Central Node (PCN) and secondary servers known as Secondary Central Nodes (SCN).
The principle of operation of Kaspersky Anti Targeted Attack Platform in distributed solution mode is shown in the following picture.
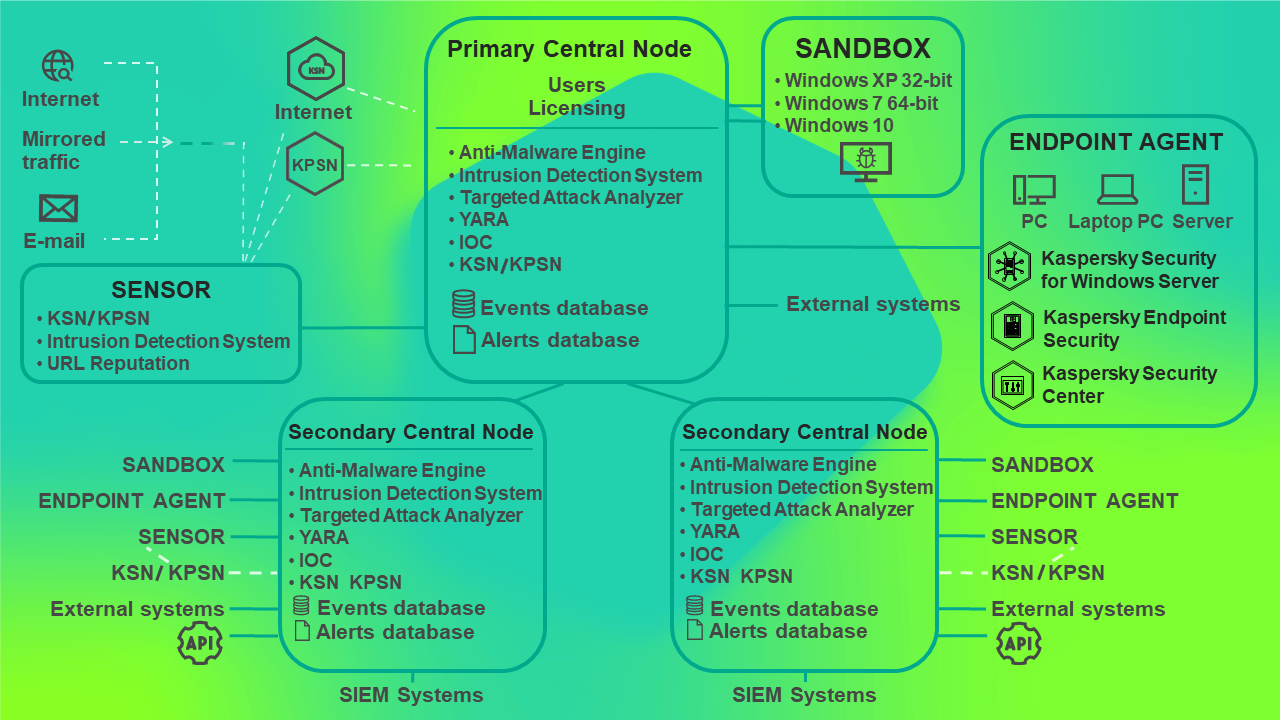
Principle of operation of Kaspersky Anti Targeted Attack Platform in distributed solution mode
Distributed solution and multitenancy
You can configure settings of each Central Node component individually or manage several components in a centralized way in distributed solution mode.
The distributed solution is a two-tier hierarchy of servers with Central Node components installed. This structure sets apart a primary control server known as the Primary Central Node (PCN) and secondary servers known as Secondary Central Nodes (SCN). Interaction of servers requires connecting SCN to PCN.
If you have deployed the Central Node component as a cluster, the entire cluster takes on the role of a PCN or SCN.
PCN and SCN scan files and objects using the same technology as the individually managed Central Node component.
The distributed solution allows centralized management of the following functional areas of the application:
- Users.
- Alerts.
- Threat Hunting.
- Tasks.
- Prevention.
- Custom rules.
- Storage.
- Endpoint Agents, including network isolation of hosts.
- Reports.
If you are supporting multiple organizations or branch offices of the same organization, you can use the application in multitenancy mode.
Multitenancy mode lets you use the application to simultaneously protect the infrastructure of multiple organizations or branch offices of the same organization (hereinafter also referred to as "
"). You can install Kaspersky Anti Targeted Attack Platform on one or more Central Node for each tenant. Each tenant can manage the application independently from other tenants. The service provider can manage the data of multiple tenants.For each user account, the number of simultaneous application management sessions is limited to one IP address. If the same user name is used to log in to the application from a different IP address, the earlier session is terminated.
If you are using the distributed solution and multitenancy mode, the limit is enforced for each PCN and SCN server separately.
Operation of the application in distributed solution mode
You can use the distributed solution and multitenancy mode in the following cases:
- To protect more than 10,000 hosts of a tenant
- For centralized management of the application in different business units of the tenant
- For centralized management of the application on servers of multiple tenants
- For processing network traffic at a maximum rate of 10 Gbps if your network includes more than one 10 Gbps segment and if you want to process traffic in these segments
When the application switches to the distributed solution and multitenancy mode, all previously added license keys are deleted from servers with the SCN role. Each connected SCN receives a key from the PCN. If full functionality of the application is used for the PCN (KATA and KEDR key), and partial functionality is used for the SCN (only KATA key or only KEDR key), the SCN server load limit may be exceeded because of the increased volume of data. If partial application functionality is used for the PCN (only KATA key or only KEDR key), and full functionality is used for the SCN (KATA and KEDR key), the application functionality is partially unavailable.
License keys can be managed only on the PCN.
You can use the following scenarios to deploy the application in distributed solution and multitenancy mode:
- Install the Central Node component on new servers and assign PCN and SCN roles to those servers.
- Assign PCN and SCN roles to servers that already have the Central Node component installed.
In this case, you must upgrade the Central Node component to version 7.0.
Before you switch servers with Central Node components installed to distributed solution mode, you should review the changes that will be applied to the system after the operating mode is changed. Assigning the PCN role to a server is irreversible.
Distributed solution and multitenancy mode transition scenario
Switching the application to the distributed solution and multitenancy mode involves the following steps:
- Assigning a DNS name to the Central Node server that you want to use as the PCN
If a DNS name has been assigned previously, make sure it is specified correctly.
- Assigning the PCN role to a server
- Creating an application administrator account on the PCN server
You will use this account to connect SCN servers to the PCN. If Active Directory integration is configured for Kaspersky Anti Targeted Attack Platform, you must select the KATA user account authentication type when creating the account.
- Assigning the SCN role to the servers and sending connection requests to the PCN
- Processing a SCN to PCN connection request.
After switching to the distributed solution and multitenancy mode, the application may need some time to configure the components. In this case, the application menu is not displayed in the SCN web interface, and in the PCN web interface, the Dashboard section displays the Data has not been sent to the SCN for over 5 minutes error. The time needed to set up the components depends on the amount of accumulated data, but is 20 to 30 minutes on average.
Page top
Modifications of application settings for the distributed solution and multitenancy mode
Modifications of application settings for the distributed solution and multitenancy mode are listed in the following table.
Modifications of application settings when switching to the distributed solution and multitenancy mode
Functional area |
PCN |
SCN |
|---|---|---|
Users |
Users and roles assigned to them are preserved. Additionally, PCN users are granted access rights to work with PCN and all connected SCNs. |
All users are deleted except the user that was created while Central Node was deployed. After that, the SCN requests a list of users from the PCN and uses that list to create local users with the same parameters: Name Password Role Status
Users that do not have rights to access the SCN, are not displayed in the list of users. |
Alerts |
Information about all alerts from all connected SCNs is added to the PCN database. |
The user name is no longer displayed in existing alert information. User data are deleted from alert operation history. |
Network traffic events |
No changes. |
No changes. |
Dashboard |
On the Alerts tab, you can now select the SCNs whose information must be displayed in the widget. On the System health tab, the status of connection of the PCN with connected SCNs is now displayed. |
On the System health tab, the status of connection with the PCN is now displayed. |
Tasks |
Tasks created on the Central Node server before it was assigned the PCN role, as well as tasks created on the PCN after switching to distributed solution mode, apply to all connected SCNs. Tasks created on SCNs are also displayed in the task list. Settings of these tasks cannot be changed on the PCN. |
Tasks created on the PCN are displayed, as well as tasks created on this SCN. Settings of tasks created on the PCN cannot be changed. |
Reports |
Templates and reports created before the switch to distributed solution mode are preserved. The Servers column is added to the report table, containing information about the SCN to which the alert belongs. After switching to distributed solution mode, only reports created on a PCN are displayed. |
Templates and reports created before the switch to distributed solution mode are preserved. Information about the user who created the report is preserved if the PCN has a user with the same ID (guid). In other cases user information is deleted. After switching to distributed solution mode, only reports created on an SCN are displayed. |
Prevention |
Policies created on the Central Node server before it was assigned the PCN role, as well as policies created on the PCN after switching to distributed solution mode, apply to all connected SCNs. Policies created on SCNs are also displayed in the policy list. Settings of these policies cannot be changed on the PCN. |
Policies created on the PCN are displayed, as well as policies created on this SCN. Settings of policies created on the PCN cannot be changed. |
Storage |
All files and metadata that were stored on PCNs before the switch to distributed solution mode are preserved. The name of the PCN is displayed for them in the Central Node column. The PCN also keeps the contents of the Storage of all connected SCNs. |
All files and metadata that were stored on SCNs before the switch to distributed solution mode are preserved. |
TAA exclusions |
No changes. |
No changes. |
VIP status |
No changes. |
No changes. |
Notification rules |
No changes. |
No changes. |
Integration with mail sensors |
No changes. |
No changes. |
Threat Hunting |
During threat hunting in the database, the PCN sends a request to all connected SCNs. After the search query is processed, a list of PCN and SCN events of the selected tenant is displayed. |
No changes. |
Custom rules ‑ TAA |
TAA (IOA) rules that were added on the Central Node server before it was assigned the PCN role are applied only to this PCN server. Rules added after the server got the PCN role are also applied to the SCN. |
TAA (IOA) rules added on the PCN, as well as TAA (IOA) rules added on this SCN before and after switching to distributed solution mode are displayed. |
Custom rules ‑ Intrusion detection |
No changes. |
No changes. |
Custom rules ‑ IOC |
The search for indicators of compromise by IOC files that were added on the Central Node server before it got the PCN role is performed only on this PCN server. The search for indicators of compromise by IOC files that were added on the Central Node server after it got the PCN role is performed also on the SCN. |
IOC files added on the PCN, as well as IOC files added on this SCN before and after switching to distributed solution mode are displayed. |
Custom rules ‑ YARA |
YARA rules that were added on the Central Node server before it was assigned the PCN role are applied only to this PCN server. Rules added after the server got the PCN role are also applied to the SCN. |
YARA rules added on the PCN, as well as YARA rules added on this SCN before and after switching to distributed solution mode are displayed. |
Assets |
No changes. |
No changes. |
Network map |
No changes. |
No changes. |
Risks and anomalies |
No changes. |
No changes. |
Backup of the application |
Backup of the application is only available on a PCN that does not have SCNs connected. To back up the application on a PCN, disconnect all SCNs from the PCN. |
Backup of the application on an SCN is not available. To back up the application on an SCN, disconnect that server from the PCN by switching it to standalone server mode. |
Assigning the PCN role to a server
Assigning the PCN role to a server is irreversible. After changing the server role to PCN, you will not be able to change the role of that server to SCN or standalone server. To change the role of that server you will have to reinstall the application.
To assign the PCN role to the server:
- Log in to the application web interface with the administrator account.
You need to log in to the web interface of the server to which you want to assign the PCN role.
- Select the Operating mode section.
- Click Distributed solution.
- In the Server role drop-down list, select Primary Central Node.
- In the Tenant name field, enter the name of the tenant to which this Central Node server belongs.
- Click Assign the PCN role.
This opens the action confirmation window.
After confirming the action, log in to the application web interface again.
- Click Yes.
The server is assigned the PCN role and the name of the tenant.
After logging in to the application web interface with administrator credentials, the Operating mode section of the application web interface displays the following information:
- Current mode – Distributed solution.
- Server role – Primary Central Node.
- Certificate fingerprint – the fingerprint of the server's certificate required for authentication when establishing connection with an SCN.
- Tenants – information about tenants to which this server and connected SCN servers belong:
- IP – Primary Central Node for this server and IP addresses of SCN servers (after they connect).
- Server – name of this server and names of SCN servers (after they connect).
This name is not related to name of the host where the application is installed. You can change it.
- Certificate fingerprint – blank value for this server and certificate fingerprints of SCN servers (after they connect).
- Status – connection state of SCN servers (after they connect) and the number of servers connected to tenants.
- The Servers pending authorization table contains information about connected SCN.
Assigning the SCN role to a server
To assign the SCN role to the server:
- Log in to the application web interface with the administrator account.
You need to log in to the web interface of the server to which you want to assign the SCN role.
- Select the Operating mode section in the window of the application web interface.
- Click Distributed solution.
- In the Server role drop-down list, select Secondary Central Node.
- In the PCN IP field, enter the IP address of the server that has the PCN role, to which you want to connect the SCN.
- Click Get certificate fingerprint.
A fingerprint of the certificate of the server that has the PCN role is displayed in the workspace.
- Contact the administrator of the PCN and compare the certificate fingerprint you received with the fingerprint displayed on the PCN in the Certificate fingerprint field of the Operating mode section.
- If certificate fingerprints on the SCN and the PCN match, in the User name and Password fields, enter the user name and password of the administrator account created on the PCN for connecting SCNs.
- Click Send connection request.
This opens a confirmation window.
- Click Yes.
The SCN role is assigned to the server.
Viewing information about tenants, PCN and SCN servers
In the web interface of the PCN server, you can view information about this server and about all SCN servers that are connected to it.
To view information about PCN and SCN servers in multitenancy mode:
- Log in to the application web interface with the administrator account.
You need to log in to the web interface of the PCN server.
- Select the Operating mode section in the window of the application web interface.
The workspace displays the following information about servers:
- Current mode – Distributed solution.
- Server role – Primary Central Node.
- Certificate fingerprint – certificate fingerprint of the PCN server.
- Tenants – information about tenants to which the server belongs, as well as all SCN servers connected to the PCN.
- IP – Primary Central Node for the PCN server and IP addresses of SCN servers connected to the PCN.
- Server – name of the server and names of SCN servers that connect to the PCN.
This name is not related to name of the host where the application is installed. You can change it.
- Certificate fingerprint – blank value for the PCN server and certificate fingerprints of SCN servers waiting to connect to the PCN.
- Status – connection status of SCN servers and the number of servers connected to the tenant.
- The Servers pending authorization table contains the following information:
- IP – IP address or domain name of the SCN server.
- Server is the name of the SCN server that is displayed in the application web interface.
This name is not related to name of the host where the application is installed. You can change it.
- Certificate fingerprint – certificate fingerprint of the SCN server that is sent to the PCN with the connection request.
- Status – status of the SCN to PCN connection.
Adding a tenant to the PCN server
To add a tenant in the PCN server web interface:
- Log in to the application web interface with the administrator account.
You must log in to the web interface of the PCN server for which you want to add a tenant.
- Select the Operating mode section in the window of the application web interface.
- In the right part of the Tenants workspace, click Add.
- In the Name field, enter the name of the tenant that you want to add.
- Click Add.
The tenant is added and is displayed in the list.
Deleting a tenant from the PCN server
To delete a tenant in the PCN server web interface:
- Log in to the application web interface with the administrator account.
You must log in to the web interface of the PCN server for which you want to delete a tenant.
- Select the Operating mode section in the window of the application web interface.
- In the Tenants workspace, select the tenant that you want to delete.
- Click Delete.
This opens the action confirmation window.
The action is irreversible. All global objects as well as reports and report templates of this tenant are lost.
- Click Yes.
The tenant is deleted.
Renaming a tenant on the PCN server
To rename a tenant in the web interface of the PCN server:
- Log in to the application web interface with the administrator account.
You must log in to the web interface of the PCN server for which you want to rename a tenant.
- Select the Operating mode section in the window of the application web interface.
- In the Tenants list, click
 next to the tenant that you want to rename.
This opens a window in which you can rename the tenant.
- In the Name field, enter the new name of the tenant.
- Click Save.
The tenant is renamed.
Disconnecting an SCN from PCN
Starting with version 7.0, an SCN server cannot be reconnected to any PCN server.
The administrator of Kaspersky Anti Targeted Attack Platform is responsible for the confidentiality of data on PCN, SCN, and Central Node servers. If you plan to move an SCN server from one tenant to another, you must delete all data remaining on the server after using Kaspersky Anti Targeted Attack Platform and reinstall Kaspersky Anti Targeted Attack Platform before handing over the server to the different tenant.
To disconnect an SCN from a PCN:
- Log in to the web interface of the PCN server from which you want to disconnect the SCN using the administrator account.
- Select the Operating mode section in the window of the application web interface.
- In the server list, select the SCN that you want to disconnect.
- Click Disconnect.
This opens the action confirmation window.
- Click Yes.
The SCN is disconnected from the PCN and continues working as a standalone Central Node server.
Modifications of application settings for disconnecting an SCN from PCN
Modifications of application settings after an SCN is disconnected from the PCN are listed in the following table.
Modifications of application settings after disconnecting an SCN from PCN
Functional area |
PCN |
SCN |
|---|---|---|
Users |
The disconnected SCN is not removed from the list of servers to which user rights apply. Information about changes of the user account that has rights on the disconnected SCN is not sent to the SCN. |
User accounts received from the PCN are not deleted. You can create new user accounts again, as well as disable and change passwords for existing user accounts. |
Alerts |
Alert information on the disconnected SCN is deleted. |
Operation history and all alert information is preserved. |
Tasks |
Tasks created on the disconnected SCN are deleted. |
Tasks created on the PCN are deleted. Information about users who created tasks on the SCN is preserved. |
Reports |
All reports created earlier concerning the disconnected SCN are preserved, as well as the ability to filter the report list by this server. |
Templates and reports are not modified. |
Prevention |
Policies created on the disconnected SCN are deleted. |
Policies created on the PCN are deleted. Information about users who created policies on the SCN is preserved. |
Storage |
All objects related to the disconnected SCN are deleted from Storage. |
All objects in the Storage are preserved. The link to the task stops working in information about objects received as part of tasks created on the PCN. |
TAA exclusions |
No changes. |
No changes. |
VIP status |
No changes. |
No changes. |
Notification rules |
No changes. |
No changes. |
Integration with mail sensors |
No changes. |
No changes. |
Threat Hunting |
After the search query is processed, events related to the disconnected SCN are not displayed. |
No changes. |
Custom rules ‑ TAA and IOC |
IOC and TAA (IOA) rules of a disconnected SCN are deleted. |
IOC and TAA (IOA) rules created on the PCN are deleted. |
Backup of the application |
Backup of the application remains unavailable. |
Backup of the application becomes available. |
Sizing Guide
To obtain and maintain optimum performance under varying operational conditions of the application, you must take into account the number of networked devices, network topology, and the set of application features that you need.
Selection of the optimal application configuration consists of the following steps:
Common scenarios for deployment and installation of application components
The scenario for deployment and installation of application components is determined by the planned load on the application servers.
The Endpoint Agent component can be installed on any computers that belong to the organization's IT infrastructure and run the Windows operating system. Outbound connections from computers with the Endpoint Agent component to the server hosting the Central Node component must be allowed directly, without a proxy server.
You can install one or multiple Central Node components. If you install multiple Central Node components, you can use them independently of each other or combine them for centralized management in distributed solution mode.
The deployment scenario selection depends on the utilized application functionality. All scenarios listed in this manual also apply to the deployment of the application on a virtual platform.
Full functionality (KATA and KEDR)
When using KATA and KEDR functionality, you can scan network traffic, mail traffic, and data on corporate LAN computers.
If more than 5000 hosts with the Endpoint Agent component are used within the organization, it is not recommended to use the Central Node component to process traffic.
You can use the Sensor component as a proxy server for connecting hosts to the Endpoint Agent component and the Central Node. One Sensor component supports the connection of up to 1000 hosts with the Endpoint Agent component.
The criteria for selecting a deployment scenario when using KATA and KEDR functionality are presented in the table below. The selection algorithm is as follows:
- In each row of the table, select the cell containing the value of the criterion corresponding to your IT infrastructure.
If a row contains two cells with identical values, you must select the cell on the left.
- Select the right-most column in which there are marked cells.
Selecting a deployment scenario when using KATA and KEDR functionality
Criterion
Network traffic and mail traffic cannot be received on the same device.
No
Yes
Yes
Yes
Number of Endpoint Agent hosts
No
From 5000 to 10,000
From 5000 to 10,000
Over 10,000
1 Gbps
From 1 to 2 Gbps
Over 2 Gbps
Over 2 Gbps
The number of remote infrastructures in which traffic needs to be analyzed.
No
One
Two or more
Two or more
The capacities of one Sandbox component are insufficient to analyze all objects within acceptable time frames.
No
No
Yes
Yes
In distributed solution mode, each application component must meet the hardware requirements specified in the sizing calculator.
Processing of network traffic, mail traffic, and web traffic (KATA)
It is recommended to use KATA functionality if the organization does not need to process data on corporate LAN computers. If this is the case, only network traffic and mail traffic are processed.
The criteria for selecting a deployment scenario when using KATA functionality are presented in the table below. The selection algorithm is as follows:
- In each row of the table, select the cell containing the value of the criterion corresponding to your IT infrastructure.
If a row contains two cells with identical values, you must select the cell on the left.
- Select the right-most column in which there are marked cells.
Selecting a deployment scenario when using KATA functionality
Criterion
Network traffic and mail traffic cannot be received on the same device.
No
Yes
Yes
1 Gbps
From 1 to 2 Gbps
Over 2 Gbps
The number of remote infrastructures in which traffic needs to be analyzed.
No
One
Two or more
The capacities of one Sandbox component are insufficient to analyze all objects within acceptable time frames.
No
No
Yes
Processing of data from corporate LAN computers (KEDR)
It is recommended to use KEDR functionality if the organization does not need to process traffic. If this is the case, only data on corporate LAN computers is processed.
Depending on the presence of a third-party Sandbox solution within the organization, you can use one of the following deployment scenarios:
Two-server deployment scenario
When using KATA and KEDR functionality, you can install the Endpoint Agent component on corporate LAN computers. When using KATA functionality, the Endpoint Agent component is not installed.
When using this deployment scenario, the Central Node and Sensor components are installed on the same server or cluster. This server or cluster receives traffic, performs an initial analysis of traffic and a deeper analysis of extracted files. Based on the scan results, components detect signs of targeted attacks on the organization's IT infrastructure.
The Sandbox component is installed on the other server.
The scenario for application operation when deployed on two servers is presented in the figure below.
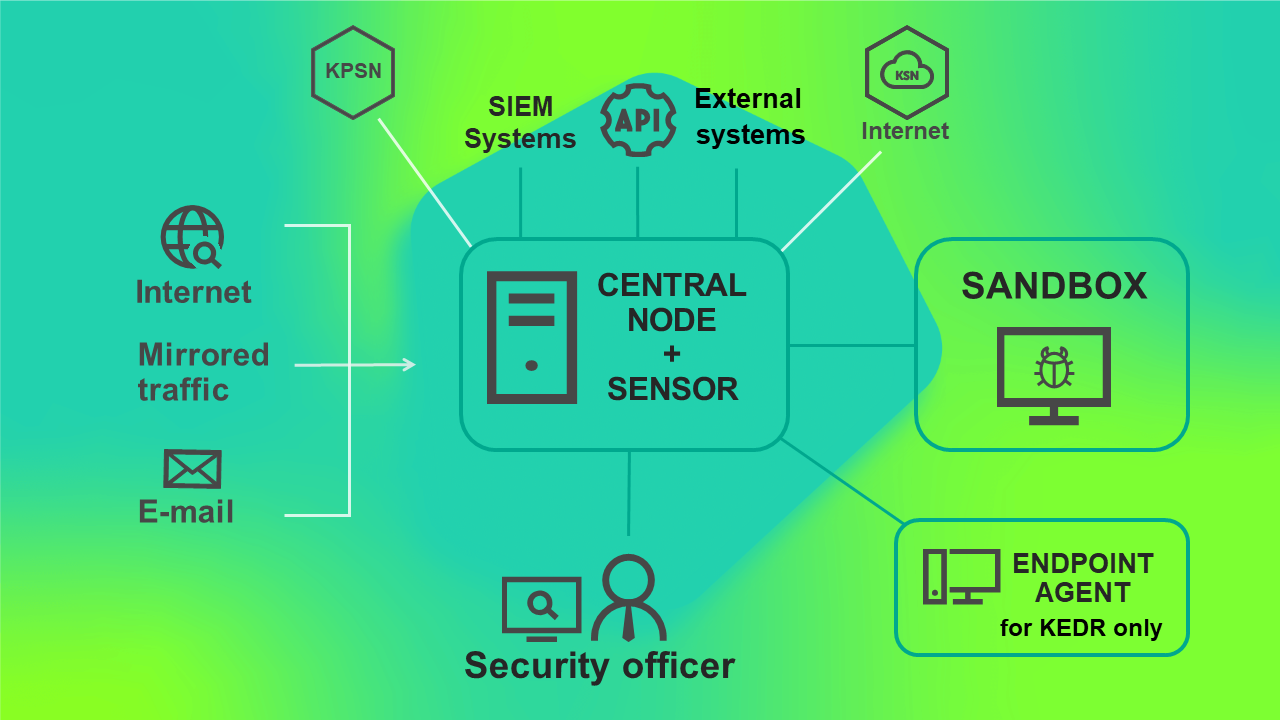
Application operating scenario when deployed on two servers
Three-server deployment scenario.
When using KATA and KEDR functionality, you can install the Endpoint Agent component on corporate LAN computers. When using KATA functionality, the Endpoint Agent component is not installed.
When using this deployment scenario, the Sensor, Central Node and Sandbox components are installed on separate servers. The Central Node component can also be deployed as a cluster. The Sensor receives traffic, performs an initial analysis, extracts files and forwards them to the Central Node component for a deeper analysis.
Using this deployment scenario, the Central Node component can receive traffic and perform an initial analysis of data in the main infrastructure. In this case, you can install the Sensor component on a server of a remote infrastructure whose traffic needs to be analyzed. If the link bandwidth in the main infrastructure is more than 2 Gbps, we recommend installing the Sensor in the main infrastructure.
The traffic exchanged between the Central Node and Sensor components comprises up to 20% of traffic received by the Sensor component.
The application operating scenario when deployed on three servers is presented in the figure below.
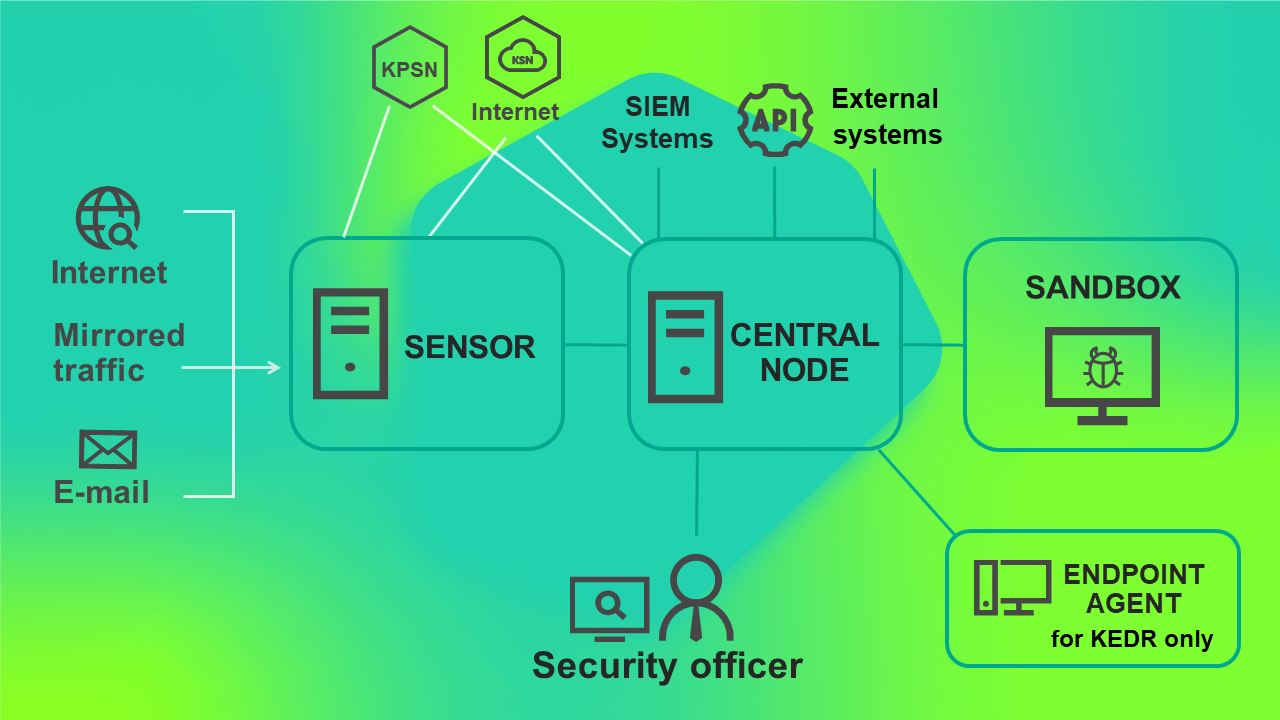
Application operating scenario when deployed on three servers
Scenario of deployment on four or more servers
When using KATA and KEDR functionality, you can install the Endpoint Agent component on corporate LAN computers. When using KATA functionality, the Endpoint Agent component is not installed.
If there is a large volume of traffic, you can install multiple Sensor components or multiple Sandbox components on different servers. This scenario is recommended for deployment in large organizations.
You can also use one Sandbox component to connect to multiple Central Node components.
The operating schematic of the application when deployed on four or more servers is presented in the figure below.
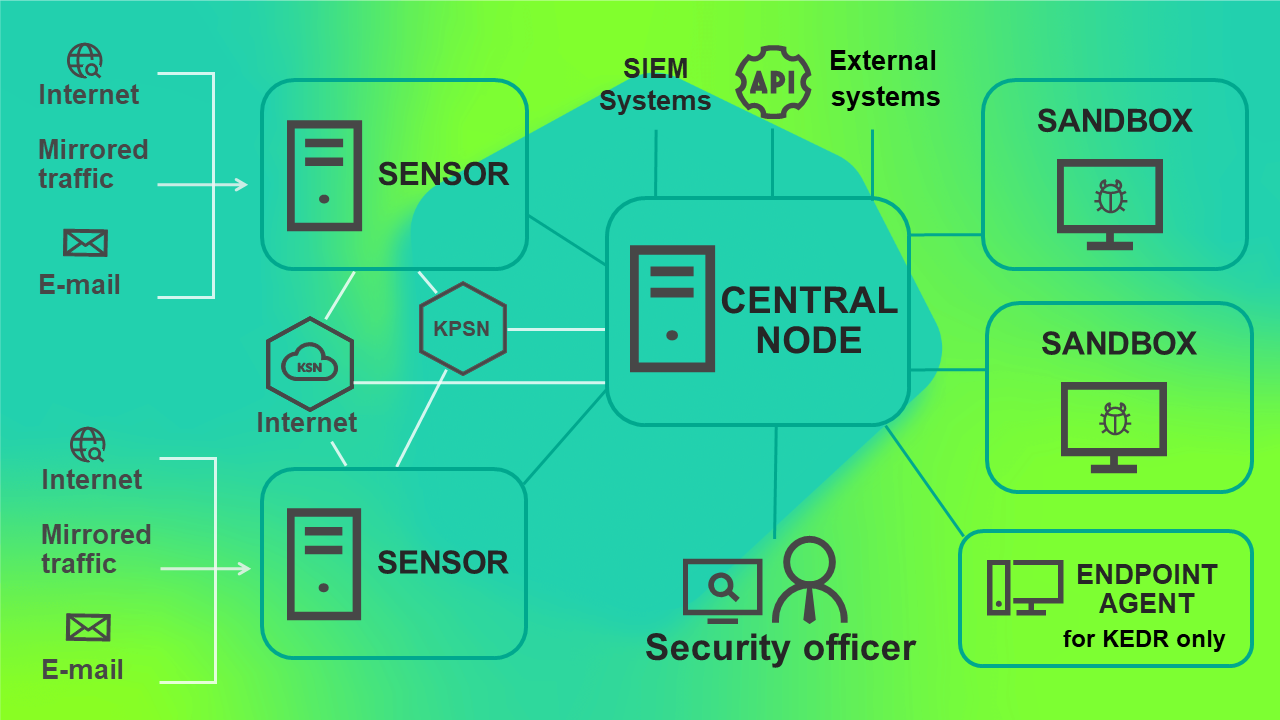
Application operating scenario when deployed on four or more servers
Scenario for deploying KEDR functionality with a Sandbox component
Using this deployment scenario, you need to install the Central Node component separately from the Sensor component.
The application operating scenario when deploying KEDR functionality with the Sandbox component is presented in the figure below.
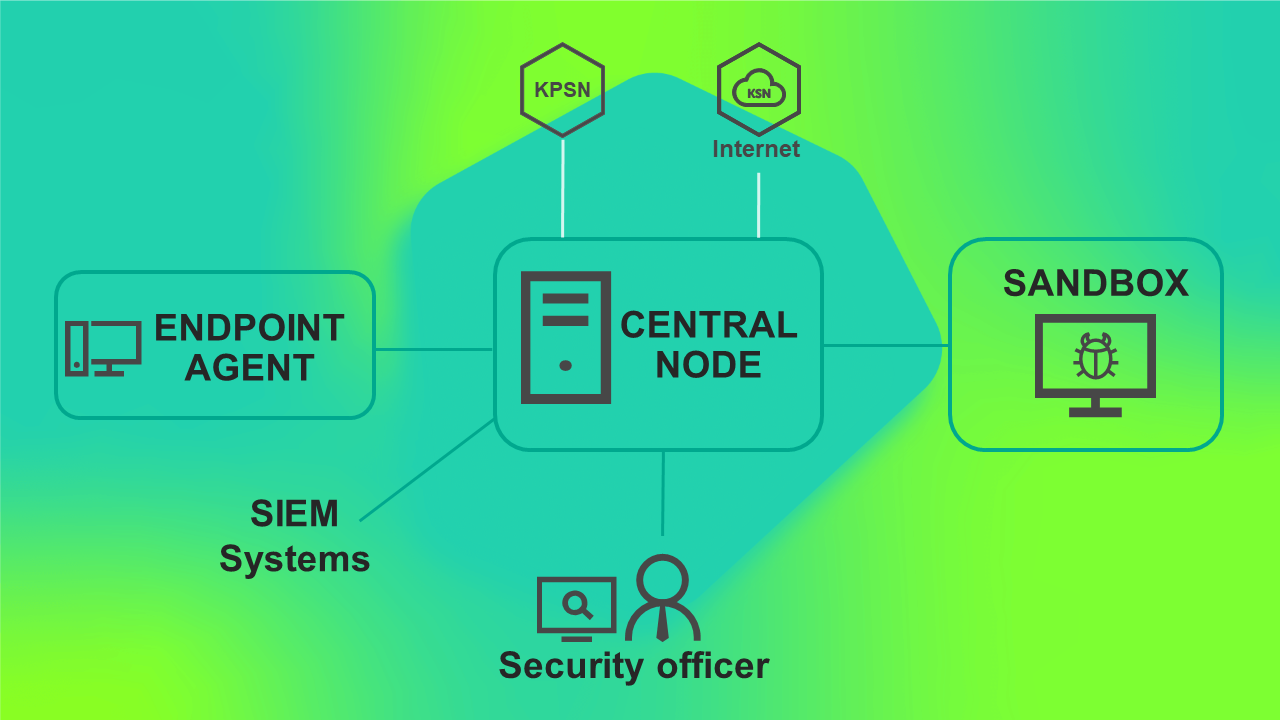
Application operating scenario when deploying KEDR functionality with the Sandbox component
Scenario for deploying KEDR functionality without a Sandbox component
You do not need to install the Sandbox component and can use the Central Node component only for managing the Endpoint Agent component and data analysis.
Using this deployment scenario, you need to install the Central Node component separately from the Sensor component.
The application operating scenario when deploying KEDR functionality without the Sandbox component is presented in the figure below.
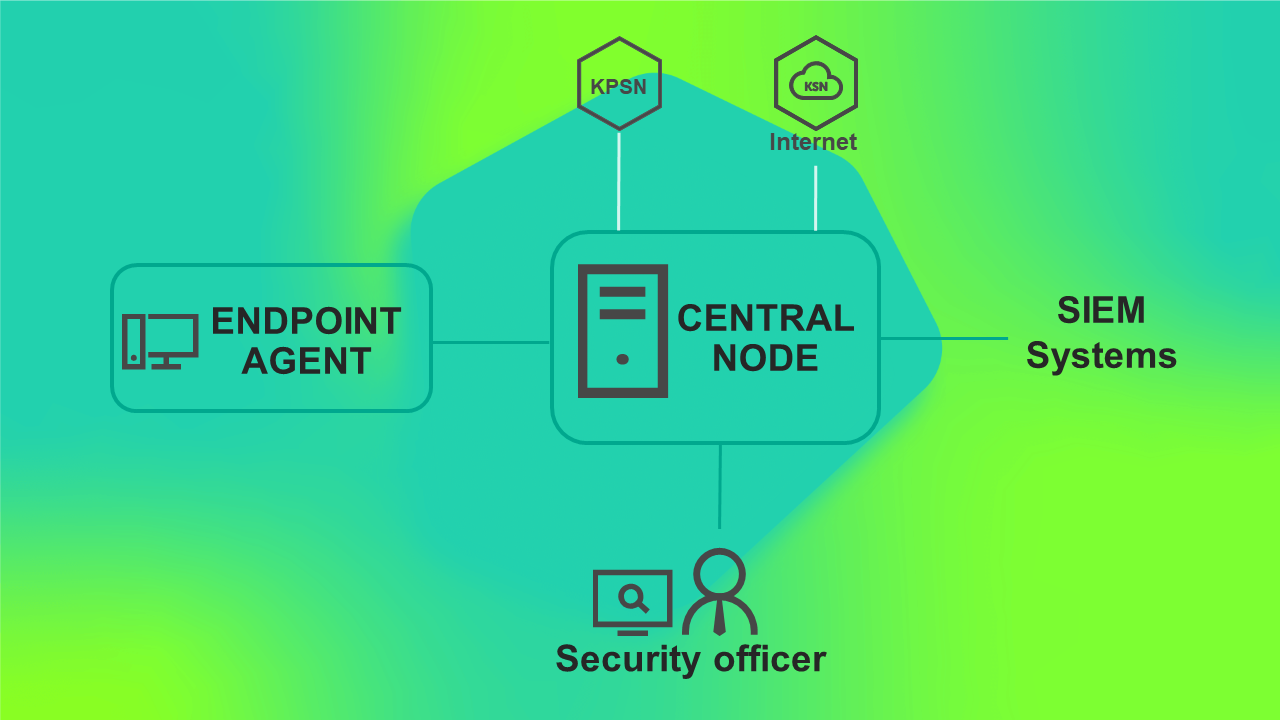
Application operating scenario when deploying KEDR functionality without the Sandbox component
Sizing calculator
After you have selected the deployment scenario that is most appropriate for your IT infrastructure, you must calculate the hardware requirements for servers used for installing application components.
The hardware requirements for 7.0, 7.0.1, and 7.0.3 Central Node servers are different from the hardware requirements of version 6.1. We strongly recommend making sure that your server configuration satisfies the requirements listed in the Calculations for the Central Node component section.
Calculations for the Sensor component
When calculating the hardware requirements for the Sensor component, consider that the maximum traffic volume that can be processed is 10 Gbps. This maximum traffic volume can be processed on one Sensor installed on a standalone server or on multiple Sensors installed on standalone servers which are connected to one Central Node. The total traffic volume from all Sensors connected to one Central Node may not exceed 10 Gbps.
If the network includes more than one 10 Gbps segment and you need to process traffic in these segments, you must use the distributed solution mode.
You can use a server hosting the Sensor as a proxy server during data exchange between workstations with Endpoint Agent and the Central Node (when integrated with the KEDR functionality) to simplify configuration of network rules. For example, if workstations with Endpoint Agent are in a separate segment of the network, it is sufficient to configure a connection between Central Node and Sensor servers.
When using the Sensor as a proxy server for communication between Endpoint Agent components and the Central Node component, consider the following limitations:
- A maximum of 15,000 workstations with the Endpoint Agent component can connect to a single Central Node component.
- The maximum allowed packet loss between Sensor servers and the Central Node is 10% with a packet delay of up to 100 ms.
The required bandwidth of the link between Central Node and Sensor servers depends on the traffic volume that must be processed and is calculated as follows:
10% SPAN port traffic at typical load or 20% of the SPAN port traffic at peak load + email traffic + ICAP traffic + requirement for the link between the Central Node and the Endpoint Agent
Hardware requirements for the Sensor server
The Sensor component can be integrated with the IT infrastructure of an organization as follows:
- Receive mirrored traffic from network devices from SPAN ports.
- Connect to a mail server over the POP3 protocol.
- Connect to a mail server over the SMTP protocol.
- Receive traffic from a proxy server over the ICAP protocol.
- Receive data from the Endpoint Agent component.
The hardware requirements for the Sensor server are listed in the tables below. The calculations are provided for a case in which the Sensor processes email messages and mirrored traffic from SPAN ports. If the Sensor is used as a proxy server for communication between Endpoint Agent workstations and the Central Node, you must also take into account the link requirements.
The Sensor component was tested on virtual platforms with a load of up to 1000 Mbit/s inclusive; however, virtual platforms support greater loads. If you want to deploy the Sensor component on a virtual platform and plan to process up to 1000 Mbps of traffic, you can use the table below to calculate the hardware requirements for the Sensor server. If you plan to process more traffic, please contact your account manager to get a calculation of hardware requirements.
Hardware requirements of the Sensor server depending on the volume of processed traffic from SPAN ports when using the KATA and KEDR functionality
Number of Endpoint Agent components (integration with the KEDR functionality) |
Volume of processed traffic (Mbps) |
Minimum RAM (GB) |
Minimum number of logical cores |
|---|---|---|---|
10000 |
100 |
24 |
6 |
15000 |
500 |
32 |
10 |
15000 |
1000 |
40 |
14 |
15000 |
2000 |
64 |
24 |
15000 |
4000 |
96 |
36 |
15000 |
7000 |
152 |
56 |
15000 |
10000 |
200 |
76 |
Hardware requirements of the Sensor server depending on the volume of processed traffic from SPAN ports when using the KATA and NDR functionality
Volume of processed traffic (Mbps) |
Minimum RAM (GB) |
Minimum number of logical cores |
Minimum number of logical cores when saving mirrored traffic dumps |
|---|---|---|---|
100 |
32 |
6 |
8 |
500 |
40 |
10 |
12 |
1000 |
48 |
14 |
16 |
2000 |
72 |
24 |
24 |
4000 |
112 |
36 |
40 |
7000 |
160 |
56 |
60 |
10000 |
208 |
76 |
80 |
The CPU must support the BMI2, AVX, and AVX2 instruction sets.
If you want to process only email messages, but not mirrored traffic from SPAN ports, we recommend using a Sensor installed on the same server as the Central Node. For more details about the hardware requirements, see the Calculations for the Central Node component section → Hardware requirements for the Central Node and Sensor server.
If one Sensor server processes traffic via multiple protocols, to calculate the server hardware, you must consider that mail server or mail sensor integration requires disabling SMTP traffic processing.
Disk space requirements on a Sensor server
It is recommended to use a RAID 1 disk array. The total disk space must be at least 600 GB.
Hardware requirements of the Sensor when saving dumps of mirrored traffic from SPAN ports
If you are saving dumps of mirrored traffic from SPAN ports, the following hardware requirements of the Sensor server are higher:
- Install separate disk storage in the form of a RAID array or DAS pool with the maximum bandwidth calculated using the following formula:
<disk storage bandwidth> = 3 * <maximum throughput of recorded traffic> - The capacity of disk storage is determined by the expected storage duration and the maximum throughput of traffic being saved, with filters taken into account. According to approximate calculations, to store recorded traffic with a maximum throughput of 10 Gbps for 7 days, you need 750 TiB of disk storage.
Calculations for the Central Node component
Deploying the application on a virtual platform requires 10 percent more CPU resources than deploying the application on a physical server. In virtual disk settings, a Thick Provision disk type must be selected.
To avoid possible performance degradation when deploying the application on a virtual platform, you need to do the following:
- Set Latency Sensitivity to High.
- Reserve all memory.
- Reserve all CPU.
Hardware requirements for a Central Node server with Embedded Sensor
Hardware requirements for a Central Node server with Embedded Sensor depend on the following conditions:
- Volume of processed traffic
To determine the volume of processed decrypted traffic for calculating the load on the server, use the following formula:
<volume of decrypted traffic transmitted by ArtX TLSProxy 1.9.1> = 5 * <volume of unencrypted traffic>To determine the volume of traffic processed on the ICAP server for calculating the load on the server, use the following formula:
<volume of traffic processed on the ICAP server> = 5 * <volume of traffic that is not processed on the ICAP server> - Number of email messages processed per second
- Number of Endpoint Agent hosts
The Endpoint Agent component can be installed on a workstation, terminal server, file server, or network attached storage (NAS).
Information about the compatibility of versions of applications that represent the Endpoint Agent component with versions of Kaspersky Anti Targeted Attack Platform is provided in the following Help sections: Kaspersky Endpoint Agent for Windows, Kaspersky Endpoint Security for Windows, Kaspersky Endpoint Security for Linux, Kaspersky Endpoint Security for Mac.
Kaspersky Endpoint Agent for Windows can also be installed on a SCADA server.
To determine the effective number of hosts with the Endpoint Agent component for calculating the server load, you can use the following formula:
K = A+3*B+20*Cwhere
- 'K' is the maximum number of hosts with the Endpoint Agent component.
- 'A' is the number of workstations and users of terminal servers running a Windows operating system with the Endpoint Agent component installed.
- 'B' is the number of workstations and users of terminal servers running a Linux or macOS operating system with the Endpoint Agent component installed.
- "C" is the number of servers.
If the volume of processed traffic is greater than 1 Gbps, you must install Central Node and Sensor components on standalone servers.
The hardware requirements for the Central Node server depending on the functionality being used are listed in the tables below.
Note that with the event chain scanning feature enabled, different hardware requirements apply to the Central Node server. Please refer to the Hardware requirements for the Central Node server with the event chain scanning feature enabled section.
Hardware requirements of the Central Node server when using KEDR functionality
Maximum number of hosts with the Endpoint Agent component |
Minimum RAM (GB) |
Minimum number of logical cores at 3 GHz |
First disk subsystem (RAID 1 or RAID 10) |
Second disk subsystem (RAID 10) |
|||||
|---|---|---|---|---|---|---|---|---|---|
ROPS (read operations per second) |
WOPS (write operations per second) |
Disk array size (TB) |
The number of disks in the array |
ROPS (read operations per second) |
WOPS (write operations per second) |
Disk array size (TB) |
|||
1000 |
80 |
10 |
100 |
250 |
1 |
4 |
300 |
250 |
Up to 12 TB |
3000 |
96 |
16 |
100 |
500 |
1 |
4 |
500 |
500 |
|
5000 |
112 |
20 |
100 |
500 |
1 |
4 |
700 |
600 |
|
10,000 |
160 |
32 |
100 |
500 |
1 |
4 |
1000 |
800 |
|
15,000 |
208 |
44 |
100 |
500 |
1 |
4 |
1500 |
1000 |
|
Hardware requirements for the server with the Central Node component when using KATA and KEDR functionality
Maximum number of hosts with the Endpoint Agent component |
Maximum number of email messages per second |
Maximum volume of traffic from SPAN ports on the server with the Central Node component |
Maximum volume of traffic from SPAN ports on servers with the Sensor component (Mbps) |
Minimum RAM (GB) |
Minimum number of logical cores at 3 GHz |
First disk subsystem (RAID 1 or RAID 10) |
Second disk subsystem (RAID 10) |
||||
|---|---|---|---|---|---|---|---|---|---|---|---|
ROPS (read operations per second) |
WOPS (write operations per second) |
Disk array size (TB) |
The number of disks in the array |
ROPS (read operations per second) |
WOPS (write operations per second) |
||||||
1000 |
1 |
200 |
Not processed |
128 |
24 |
100 |
1000 |
1.9 |
4 |
300 |
300 |
2000 |
2 |
500 |
Not processed |
144 |
32 |
100 |
1000 |
2 |
4 |
500 |
500 |
5000 |
1 |
1000 |
Not processed |
192 |
48 |
100 |
1000 |
2 |
4 |
1000 |
600 |
10,000 |
2 |
1000 |
Not processed |
240 |
60 |
100 |
1000 |
2 |
4 |
2000 |
800 |
5000 |
5 |
Not processed |
2000 |
176 |
60 |
100 |
1000 |
1.9 |
4 |
1000 |
600 |
10,000 |
20 |
Not processed |
4000 |
240 |
96 |
100 |
1000 |
1.9 |
4 |
2000 |
800 |
15,000 |
20 |
Not processed |
4000 |
288 |
108 |
100 |
1000 |
1.9 |
4 |
2000 |
800 |
15,000 |
20 |
Not processed |
7000 |
320 |
144 |
100 |
1000 |
1.9 |
4 |
2000 |
800 |
15,000 |
20 |
Not processed |
10,000 |
336 |
180 |
100 |
1000 |
1.9 |
4 |
2000 |
800 |
If you want to install the Central Node component on the "Brest" or "RED Virtualization" virtual platform and use the KEDR or KATA+KEDR functionality, you need to increase the minimum number of logical cores by 20%. If you want to mitigate Spectre or Meltdown type vulnerabilities at the level of the hypervisor OS, you need to additionally increase the minimum number of logical cores by 1.5 times. The other hardware requirements for virtual servers are similar to the requirements for physical servers, listed in the tables above.
Hardware requirements for the server with the Central Node component when using КАТА functionality
Maximum number of email messages per second |
Maximum volume of traffic from SPAN ports on the server with the Central Node component |
Maximum volume of traffic from SPAN ports on servers with the Sensor component (Mbps) |
Minimum RAM (GB) |
Minimum number of logical cores at 3 GHz |
First disk subsystem (RAID 1 or RAID 10) |
|||
|---|---|---|---|---|---|---|---|---|
ROPS (read operations per second) |
WOPS (write operations per second) |
Disk array size (TB) |
The number of disks in the array |
|||||
2 |
500 |
Not processed |
72 |
24 |
100 |
1000 |
2 |
4 |
2 |
1000 |
Not processed |
88 |
36 |
100 |
1000 |
2 |
4 |
5 |
Not processed |
2000 |
80 |
44 |
100 |
1000 |
2 |
4 |
20 |
Not processed |
4000 |
96 |
72 |
100 |
1000 |
2 |
2 |
20 |
Not processed |
7000 |
128 |
108 |
100 |
1000 |
2 |
2 |
20 |
Not processed |
10,000 |
144 |
144 |
100 |
1000 |
2 |
2 |
If you want to install the Central Node component on the "Brest" or "RED Virtualization" virtual platform and use the KATA functionality, you need to increase the minimum number of logical cores by 30%. If you want to mitigate Spectre or Meltdown type vulnerabilities at the level of the hypervisor OS, you need to additionally increase the minimum number of logical cores by 1.5 times. The other hardware requirements for virtual servers are similar to the requirements for physical servers, listed in the table above.
Hardware requirements for the server with the Central Node component when using KATA, KEDR, and NDR functionality
Maximum number of Endpoint Agent hosts (integration with the KEDR functionality) |
Maximum number of email messages per second |
Maximum volume of traffic from SPAN ports on the server with the Central Node component |
Maximum volume of traffic from SPAN ports on servers with the Sensor component (Mbps) |
Minimum RAM (GB) |
Minimum number of logical cores at 3 GHz |
First disk subsystem (RAID 1 or RAID 10) |
Second disk subsystem (RAID 10) |
||||
|---|---|---|---|---|---|---|---|---|---|---|---|
ROPS (read operations per second) |
WOPS (write operations per second) |
Disk array size (TB) |
The number of disks in the array |
ROPS (read operations per second) |
WOPS (write operations per second) |
||||||
1000 |
1 |
200 |
Not processed |
160 |
28 |
100 |
1000 |
2 |
4 |
400 |
500 |
2000 |
2 |
500 |
Not processed |
176 |
40 |
100 |
1000 |
2 |
4 |
600 |
800 |
5000 |
1 |
1000 |
Not processed |
224 |
56 |
100 |
1200 |
2 |
4 |
1200 |
1000 |
10,000 |
2 |
1000 |
Not processed |
272 |
68 |
100 |
1200 |
2 |
4 |
2200 |
1200 |
5000 |
5 |
Not processed |
2000 |
208 |
64 |
100 |
1200 |
2 |
4 |
1200 |
1000 |
10,000 |
20 |
Not processed |
4000 |
272 |
104 |
100 |
1500 |
2 |
4 |
2200 |
1200 |
15,000 |
20 |
Not processed |
4000 |
320 |
116 |
100 |
1500 |
2 |
4 |
2200 |
1200 |
15,000 |
20 |
Not processed |
7000 |
352 |
152 |
200 |
2000 |
2 |
4 |
2300 |
1200 |
15,000 |
20 |
Not processed |
10,000 |
384 |
188 |
200 |
2000 |
2 |
4 |
2300 |
1200 |
These calculations apply if up to 1000 Endpoint Agent components are connected to one Central Node component when integrating with the NDR functional block. To calculate the hardware requirements for the Central Node server when using more Endpoint Agent NDR components, please contact Technical Support.
Hardware requirements for the server with the Central Node component when using KATA and NDR functionality
Maximum number of email messages per second |
Maximum volume of traffic from SPAN ports on the server with the Central Node component |
Maximum volume of traffic from SPAN ports on servers with the Sensor component (Mbps) |
Minimum RAM (GB) |
Minimum number of logical cores at 3 GHz |
First disk subsystem (RAID 1 or RAID 10) |
|||
|---|---|---|---|---|---|---|---|---|
ROPS (read operations per second) |
WOPS (write operations per second) |
Disk array size (TB) |
The number of disks in the array |
|||||
2 |
500 |
Not processed |
96 |
32 |
100 |
1000 |
2 |
4 |
2 |
1000 |
Not processed |
128 |
44 |
200 |
2000 |
2 |
4 |
5 |
Not processed |
2000 |
112 |
52 |
200 |
2000 |
2 |
4 |
20 |
Not processed |
4000 |
128 |
80 |
200 |
2000 |
2 |
4 |
20 |
Not processed |
7000 |
160 |
116 |
300 |
2500 |
2 |
4 |
20 |
Not processed |
10,000 |
192 |
152 |
300 |
2500 |
2 |
4 |
These calculations apply if up to 1000 Endpoint Agent components are connected to one Central Node component when integrating with the NDR functional block. To calculate the hardware requirements for the Central Node server when using more Endpoint Agent NDR components, please contact Technical Support.
Kaspersky Anti Targeted Attack Platform does not support operation with software RAID array.
The CPU must support the BMI2, AVX, and AVX2 instruction sets.
Disk space requirements on the Central Node server
For the Central Node server, we recommend having 2000 GB of free space on the first disk subsystem and 2400 GB on the second disk subsystem. The amount of space required on the second disk subsystem depends on the preferred storage policy and can be calculated using the following formula:
150 GB + <number of Kaspersky Endpoint Agent or Kaspersky Endpoint Security for Windows hosts>/15,000 * (400 GB + 460 GB * <number of days to store data>)/0.65, but no more than 12 TB.
If you want to use the event chain scanning feature, use the following formula to calculate the space requirement on the second disk subsystem:
150 GB + <number of Kaspersky Endpoint Agent or Kaspersky Endpoint Security for Windows hosts>/15,000 * (600 GB + 460 GB * <number of days to store data>)/0.65, but no more than 12 TB.
When using the NDR functionality, you must allocate additional space on the second disk subsystem in accordance with the following formula:
(<number of Endpoint Agent components connected to the NDR functional block> * 0.02 GB + <volume of traffic from SPAN ports (Gbps)> * 10 GB) * <how many days of data you want to store>.
These formulas can be used to roughly estimate the required disk space. The actual amount of stored data depends on the traffic profile of the organization and may differ from the calculated result.
If you did not install Central Node as a high availability cluster, you must calculate the disk space for the Events database, GB and Storage, GB parameters using the following formula:
A = F - R, GB.
where
- 'A' is the space used by the events database and the Storage.
- 'F' is the size of the hard drive on which the Central Node component is installed.
- 'R' is the reserved amount of free space (GB) on the second disk subsystem in accordance with the number of connected hosts with the Endpoint Agent component; this parameter is taken from the table below.
If the number of hosts connected to Central Node is in between the listed values, use the larger number in your calculations.
If you have configured integration for scanning external system objects using the REST API, the hardware requirements of the Central Node server must be increased. Additional hardware requirements are presented in the table below.
Hardware requirements for the Central Node server with integrated external systems
Maximum number of processed objects per second |
Number of additional logical cores |
Number of additional Sandbox servers |
|---|---|---|
8 |
2 |
1 |
16 |
4 |
2 |
24 |
7 |
3 |
If you configured integration to send events to an external system using the REST API, you must increase the hardware requirements of the Central Node server by 1 logical core and 6 GB of RAM.
If you are saving network traffic, the hardware requirements of the Central Node server must be increased. For more details on hardware requirements, see Calculations for the Sensor component → Hardware requirements of the Sensor when saving raw network traffic.
Requirements for the PCN server in distributed solution mode
If you are using distributed solution mode, to calculate the hardware requirements, you must take into account that the hardware requirements of the PCN server are 10% higher in terms of RAM and the number of logical cores than the hardware requirements of the server with the Central Node component. The hardware requirements of the Central Node server are listed in the following tables: Hardware requirements for the Central Node server when using KEDR functionality; Hardware requirements for the Central Node server when using KATA+KEDR functionality; Hardware requirements for the Central Node server when using КАТА functionality (see above).
You can connect up to 150 SCN servers to one PCN server.
Communication channel requirements
You must make sure that sufficient communication channel bandwidth is available between the Central Node server and each network segment, depending on the number of Endpoint Agent hosts in the segment. The bandwidth requirements depending on the number of Endpoint Agent hosts is listed in the table below.
Communication channel bandwidth depending on the number of Endpoint Agent hosts
Maximum number of Endpoint Agent hosts |
Required bandwidth of the communication channel reserved for Endpoint Agent hosts (Mbps) |
|---|---|
10 |
1 |
50 |
2 |
100 |
3 |
1000 |
20 |
10,000 |
200 |
Minimum requirements for the communication channel between the PCN and SCN servers in distributed solution mode are listed in the table below.
Minimum requirements for the communication channel between the PCN and SCN servers
Maximum number of Endpoint Agent hosts |
Maximum number of email messages per second |
Maximum volume of traffic from SPAN ports (Mbps) |
Required communication channel bandwidth (Mbps) |
|---|---|---|---|
5000 |
5 |
2000 |
20 |
10,000 |
20 |
4000 |
30 |
Hardware requirements for Central Node cluster servers
A cluster must include at least 4 servers: 2 storage servers and 2 processing servers. If you have up to 15,000 connected Endpoint Agent hosts, you need at least 2 storage servers and 2 processing servers. If you have from 15,000 to 30,000 connected Endpoint Agent hosts, you need at least 2 storage servers and 3 processing servers.
Each cluster server must have two network adapters to configure cluster and external subnet. The cluster subnet must be capable of up to 10 Gbps.
The cluster subnet must also meet the following requirements:
- A cluster subnet must include only the cluster servers and network switches.
- The cluster subnet must be isolated.
- The cluster servers must all be in the same L1 or L2 segment. To do this, you can connect all the servers in the cluster to a single network switch or use software tunneling. For example, L2TPv3 or Overlay Transport Virtualization (OTV).
- The "network latency" value must meet the "single digit latency" requirement, that is, the value must be less than 10 milliseconds.
The hardware requirements for cluster servers when using KEDR functionality are listed in the table below.
Hardware requirements for processing servers when using KEDR functionality
Minimum RAM (GB) |
Minimum number of logical cores |
RAID disk array type |
The number of disks in a RAID disk array |
Single HDD volume (GB) |
|---|---|---|---|---|
256 |
48 |
RAID 1 |
2 |
1200 |
Hardware requirements for storage servers when using KEDR functionality
Minimum RAM (GB) |
Minimum number of logical cores |
First disk subsystem |
Second disk subsystem |
|||
|---|---|---|---|---|---|---|
RAID disk array type |
The number of disks in a RAID disk array |
Single HDD volume (GB) |
Number of disks |
Single HDD volume (GB) |
||
128 |
16 |
RAID 1 |
2 |
1200 |
at least 6 |
at least 1200 |
We recommend using disks of the same size for the two disk subsystems. For the second disk subsystem, you must use disks that are not combined into a RAID array.
The performance requirements for disk subsystems are equivalent to those specified in the table Hardware requirements for a Central Node server when using KEDR functionality (see above).
Calculations for the Central Node component with event chain scanning enabled
The hardware requirements for the Central Node server with the event chain scanning feature enabled are listed in the tables below.
Hardware requirements for the server with the Central Node component when using KEDR functionality
Maximum number of hosts with the Endpoint Agent component |
Minimum RAM (GB) |
Minimum number of logical cores at 3 GHz |
First disk subsystem (RAID 1 or RAID 10) |
Second disk subsystem (RAID 10) |
|||||
|---|---|---|---|---|---|---|---|---|---|
ROPS (read operations per second) |
WOPS (write operations per second) |
Disk array size (TB) |
The number of disks in the array |
ROPS (read operations per second) |
WOPS (write operations per second) |
Disk array size (TB) |
|||
1000 |
96 |
12 |
100 |
250 |
1 |
4 |
300 |
300 |
Up to 12 TB |
3000 |
96 |
16 |
100 |
500 |
1 |
4 |
700 |
750 |
|
5000 |
112 |
20 |
100 |
500 |
1 |
4 |
1000 |
900 |
|
10,000 |
160 |
34 |
100 |
500 |
1 |
4 |
1500 |
1200 |
|
15,000 |
224 |
48 |
100 |
750 |
1 |
4 |
1500 |
1600 |
|
Hardware requirements for a Central Node server with the when using the KEDR functionality and 2.1 GHz CPUs
Maximum number of hosts with the Endpoint Agent component |
Minimum RAM (GB) |
Minimum number of logical cores at 2.1 GHz |
First disk subsystem (RAID 1 or RAID 10) |
Second disk subsystem (RAID 10) |
|||||
|---|---|---|---|---|---|---|---|---|---|
ROPS (read operations per second) |
WOPS (write operations per second) |
Disk array size (TB) |
The number of disks in the array |
ROPS (read operations per second) |
WOPS (write operations per second) |
Disk array size (TB) |
|||
1000 |
96 |
16 |
100 |
250 |
1 |
4 |
300 |
250 |
Up to 12 TB |
3000 |
96 |
24 |
100 |
500 |
1 |
4 |
700 |
750 |
|
5000 |
112 |
28 |
100 |
500 |
1 |
4 |
1000 |
900 |
|
10,000 |
160 |
48 |
100 |
500 |
1 |
4 |
1500 |
1200 |
|
15,000 |
224 |
64 |
100 |
750 |
1 |
4 |
1500 |
1600 |
|
Hardware requirements for the server with the Central Node component when using KATA and KEDR functionality
Maximum number of hosts with the Endpoint Agent component |
Maximum number of email messages per second |
Maximum volume of traffic from SPAN ports on the server with the Central Node component |
Maximum volume of traffic from SPAN ports on servers with the Sensor component (Mbps) |
Minimum RAM (GB) |
Minimum number of logical cores at 3 GHz |
First disk subsystem (RAID 1 or RAID 10) |
Second disk subsystem (RAID 10) |
||||
|---|---|---|---|---|---|---|---|---|---|---|---|
ROPS (read operations per second) |
WOPS (write operations per second) |
Disk array size (TB) |
The number of disks in the array |
ROPS (read operations per second) |
WOPS (write operations per second) |
||||||
1000 |
1 |
200 |
Not processed |
144 |
24 |
100 |
1000 |
1.9 |
4 |
300 |
300 |
2000 |
2 |
500 |
Not processed |
160 |
32 |
100 |
1000 |
2 |
4 |
700 |
700 |
5000 |
1 |
1000 |
Not processed |
192 |
48 |
100 |
1000 |
2 |
4 |
1000 |
900 |
10,000 |
2 |
1000 |
Not processed |
240 |
64 |
100 |
1000 |
2 |
4 |
1500 |
1200 |
5000 |
5 |
Not processed |
2000 |
192 |
60 |
100 |
1000 |
1.9 |
4 |
1000 |
900 |
10,000 |
20 |
Not processed |
4000 |
256 |
100 |
100 |
1000 |
1.9 |
4 |
1500 |
1200 |
15,000 |
20 |
Not processed |
4000 |
304 |
112 |
100 |
1000 |
1.9 |
4 |
1500 |
1600 |
15,000 |
20 |
Not processed |
7000 |
320 |
148 |
100 |
1000 |
1.9 |
4 |
1500 |
1600 |
15,000 |
20 |
Not processed |
10,000 |
336 |
184 |
100 |
1000 |
1.9 |
4 |
1500 |
1600 |
If you want to install the Central Node component on the "Brest" or "RED Virtualization" virtual platform and use the KEDR or KATA+KEDR functionality, you need to increase the minimum number of logical cores by 20%. If you want to mitigate Spectre or Meltdown type vulnerabilities at the level of the hypervisor OS, you need to additionally increase the minimum number of logical cores by 1.5 times. The other hardware requirements for virtual servers are similar to the requirements for physical servers, listed in the tables above.
Page top
Calculations for the Sandbox component
The hardware requirements for a server with the Sandbox component depend on the type and volume of processed traffic and on the permissible object scan time.
By default, the permissible object scan time is 1 hour. To reduce this time, you need a more powerful server or more servers with the Sandbox component.
It is recommended to calculate the configuration of the Sandbox component as follows:
- Install the Central Node and Sensor components on one server and the Sandbox component on a different server for pilot operation of the application.
To receive sufficient statistical data, the application must process traffic of the organization for a week.
- Run the data recording script by executing the following commands:
sudo kata-run.sh kata-collect --output-dir path-to-folder--output-dir <path to directory>When the script finishes running, the collect.tar.gz archive will be moved to the specified directory.
- Forward this archive to Kaspersky Lab staff for analysis.
If multiple virtual machines are started simultaneously, the speed of processing objects from the queue is increased.
The Sandbox component is not supported on AMD processors.
Hardware requirements for the server hosting the Sandbox component
The calculation of the number of servers with the Sandbox component when using preset images of operating systems is shown in the table below.
Hardware requirements for the Sandbox component when using preset images of operating systems
Maximum number of email messages per second |
Maximum volume of traffic from SPAN ports (Mbps) |
Maximum number of computers with the Endpoint Agent component |
Number of physical servers with the Sandbox component |
|
|---|---|---|---|---|
When using |
When using |
|||
1 |
200 |
1000 |
1 |
1 |
2 |
500 |
3000 |
1 |
1 |
1 |
1000 |
5000 |
1 |
1 |
5 |
2000 |
5000 |
1 |
1 |
20 |
4000 |
10,000 |
2 |
1 |
20 |
7000 |
15,000 |
4 |
2 |
20 |
10,000 |
15,000 |
5 |
2 |
If you want to install the Sandbox component on a VMware ESXi virtual machine, you need 5 times more virtual servers to get the same performance you would get from a physical server. When installing the Sandbox component on the "Brest", "RED Virtualization", or zVirt Node virtual platform, you need 13 times as many servers. The estimate for the number of servers is given with the need to configure the object scan duration in mind.
Additional capacity may be required if you are using custom images for Sandbox servers. To calculate the number of physical Sandbox servers required when using custom operating system images, you can use the following formula:
<number of files that need to be processed per hour in accordance with to user-defined Sandbox rules> * <number of custom operating system images> / 1000
To calculate the number of VMware ESXi virtual machines with the Sandbox component required when using custom operating system images, you can use the following formula:
<number of files that need to be processed per hour in accordance with to user-defined Sandbox rules> * <number of custom operating system images> / 200
When installing the Sandbox component on the "Brest" or zVirt Node virtualization platforms, you can use the following formula to calculate the number of virtual machines required when using custom operating systems images:
<Number of physical servers with the Sandbox component> * 5 * 2.6
When installing the Sandbox component on the RED Virtualization platform, you can use the following formula to calculate the number of virtual machines required when using custom operating systems images:
<Number of physical servers with the Sandbox component> * 5 * 2.5
For the number of physical servers with the Sandbox component, see the Hardware requirements for the Sandbox component when using preset images of operating systems table above.
The estimation of the number of Sandbox servers is listed for servers with the following configuration:
- When installing the Sandbox component on a physical server:
- 2 CPUs: Intel Xeon 8 Core (HT) at 2.6 GHz or higher.
- 80 GB of RAM.
- 2 HDDs, 300 GB each, combined into a RAID 1 array.
- When installing the Sandbox component on a virtual machine:
- Intel Xeon 15 Core (HT) CPU at 2.1 GHz or higher.
When installing the Sandbox component on "Brest", zVirt Node, or RED Virtualization platforms, we recommend using Intel processors of the Ice Lake generation or later.
- 32 GB of RAM.
- 300 GB HDD.
On the virtual machine:
- Nested virtualization enabled.
- High Latency Sensitivity settings are enabled (only when installing on a VMware ESXi virtual machine).
- Entire RAM is reserved.
- Entire CPU frequency is reserved.
When installing the Sandbox component on a virtual machine, you must set the limit for simultaneously running virtual machines to 12.
If you plan to use custom operating system images, we recommend increasing the disk space to 600 GB or more.
- Intel Xeon 15 Core (HT) CPU at 2.1 GHz or higher.
Calculations for the Central Node component deployed on the KVM virtualization platform
To deploy the Central Node component in a virtual infrastructure, you must install the KVM hypervisor based on the Debian GNU/Linux 12 operating system using the QEMU 8.0.2 emulator.
When deploying the Central Node component in a virtual infrastructure, you must keep in mind the following limitations:
- It is possible to install the application with the installation files of the Ubuntu operating system only.
- Only the non-high-availability version of the application can be installed.
- You can only use the Sensor component deployed on the same server as the Central Node component.
- You can only connect a Sandbox component deployed outside the KVM virtualization platform on a physical server or on another supported virtualization platform.
- For each Central Node server deployed in a virtual infrastructure, a separate network interface must be used for receiving mirrored SPAN traffic.
- You cannot use the API to inform external systems about alerts generated by the application or the API for informing external systems about application events.
- Support for KVM virtualizations used in cloud solutions is not guaranteed.
- In the virtual machine settings, the host value must be set for the type parameter in the CPU settings and the VMware vmxnet3 value for the model parameter in the network adapter settings.
The hardware requirements for the Central Node server depending on the functionality being used are listed in the table below.
Hardware requirements of the Central Node server when using KEDR functionality
Maximum number of hosts with the Endpoint Agent component |
Maximum number of email messages per minute |
Maximum volume of traffic from SPAN ports on the server with the Central Node component (Mbps) |
Minimum number of logical cores at 3 GHz |
Minimum RAM (GB) |
|---|---|---|---|---|
50 |
0 |
0 |
4 |
31 |
100 |
0 |
0 |
4 |
31 |
150 |
0 |
0 |
6 |
31*/32 |
250 |
0 |
0 |
6 |
31/32 |
500 |
0 |
0 |
8 |
31/34 |
750 |
0 |
0 |
10 |
31/38 |
* The value before the slash represents the amount of RAM required to install the Central Node component. After installation, the amount of RAM must be brought up to the value after the slash.
Hardware requirements of the Central Node server when using KATA and KEDR functionality
Maximum number of hosts with the Endpoint Agent component |
Maximum number of email messages per minute |
Maximum volume of traffic from SPAN ports on the server with the Central Node component (Mbps) |
Minimum number of logical cores at 3 GHz |
Minimum RAM (GB) |
|---|---|---|---|---|
100 |
1 |
20 |
6 |
31*/32 |
250 |
5 |
50 |
6 |
31/32 |
500 |
30 |
100 |
12 |
31/40 |
750 |
30 |
100 |
12 |
31/46 |
* The value before the slash represents the amount of RAM required to install the Central Node component. After installation, the amount of RAM must be brought up to the value after the slash.
Installing and performing initial configuration of the application
This section contains instructions on installation and initial configuration of Kaspersky Anti Targeted Attack Platform.
Preparing for installing application components
This section provides information on how to prepare your corporate IT infrastructure for the installation of Kaspersky Anti Targeted Attack Platform components.
Preparing the IT infrastructure for installing application components
Before installing the application, prepare your corporate IT infrastructure for the installation of components of Kaspersky Anti Targeted Attack Platform:
- Ensure that the servers, the computer intended for working with the application web interface, and the computers to be installed with the Endpoint Agent component all satisfy the hardware and software requirements.
- To protect the network from the objects being analyzed, deny access to the local network of the Sandbox server for the management network interface and the network interface used for internet access of processed objects.
- Prepare the corporate IT infrastructure in accordance with the table below:
Ports for interaction between Kaspersky Anti Targeted Attack Platform components
Source
Direction
Port or protocol
Description
Central Node
Inbound
TCP 22
Connecting to the server over SSH
TCP 443
Receiving data from the Endpoint Agent (KEDR)
TCP 8085
Receiving data from the Endpoint Agent (NDR)
TCP 8443
Access to the web interface of the application
TCP 9081
Receiving data from Sensors installed on standalone servers
TCP 7423, 13520
Communication with the Sensor server
UDP 53
Outgoing
TCP 80
TCP 443
TCP 1443Communication with the KSN servers and Kaspersky update servers
TCP 443
Sending objects to Sandbox for scanning
TCP 601
Sending messages to the SIEM system
UDP 53
Communication with the Sensor server
Inbound and outbound
ESP, AH, IKEv1, IKEv2
For interaction between Central Node and Sensor over a secure link based on the IPSec protocol
Sensor
Inbound
TCP 22
Connecting to the server over SSH
TCP 1344
Receiving traffic from the proxy server
TCP 25
Receiving SMTP traffic from the mail server
TCP 443
When Sensor is used as a proxy server for communication between workstations with Endpoint Agent and Central Node
TCP 8085
Receiving data from the Endpoint Agent (NDR)
TCP 9443
Access to the web interface of the component
UDP 53
Communication with the Central Node server
Outgoing
TCP 80
TCP 443Communication with the KSN servers and Kaspersky update servers
TCP 995
Integration with the mail server for secure connections
TCP 110
Integration with the mail server for unsecured connections
TCP 7423, 13520
Communication with the Central Node server
UDP 53
Inbound and outbound
ESP, AH, IKEv1, IKEv2
For interaction between Central Node and Sensor over a secure link based on the IPSec protocol
Sandbox
Inbound (management
interface)TCP 22
Connecting to the server over SSH
TCP 443
Interaction with the Central Node
TCP 8443
Access to the web interface of the application
Outbound (management interface)
TCP 80
TCP 443Communication with Kaspersky update servers
Outbound and corresponding inbound (interface for access of processed objects)
Any
Access to the internet for analyzing the network behavior of processed objects.
Deny access to the corporate LAN to protect the network from analyzed objects.
SCN (when using the distributed solution mode)
Outgoing
TCP 8443, 8444
For interaction between SCN and PCN over a secure link based on the IPSec protocol
Inbound and outbound
TCP 443, 53, 11000:11006, UDP 53
ESP, AH,
IKEv1 and IKEv2PCN (when using the distributed solution mode)
Inbound
TCP 8443, 8444
Inbound and outbound
TCP 443, 53, 11000:11006, UDP 53
ESP, AH,
IKEv1 and IKEv2
If you install an additional network interface that receives only mirrored traffic in a VMware ESXi virtual environment, use the E1000 network adapter or disable the LRO (large receive offload) option on a VMXNET3 network adapter.
Preparing the IT infrastructure for integration with a mail server used for receiving messages via POP3
If you are using a Microsoft Exchange mail server as your mail server and an email sender configured a request for read receipt notification, you must disable read receipt notifications. Otherwise, read receipt notifications will be sent from the email address that you have configured as the email address used for receiving messages of Kaspersky Anti Targeted Attack Platform. You must also disable automatic processing of meeting requests to prevent filling of the mailbox used for receiving messages of Kaspersky Anti Targeted Attack Platform.
To disable sending read receipt notifications from the email address used for receiving messages of Kaspersky Anti Targeted Attack Platform:
- On the Microsoft Exchange server, check whether or not notifications are enabled. To do so, execute the command:
Get-MailboxMessageConfiguration -Identity <email address for receiving messages by Kaspersky Anti Targeted Attack Platform> | fl - If notifications are enabled, run the following command:
Set-MailboxMessageConfiguration -Identity <email address for receiving messages by Kaspersky Anti Targeted Attack Platform> -ReadReceiptResponse NeverSend
This will disable read receipt notifications from the email address used for receiving messages of Kaspersky Anti Targeted Attack Platform.
To disable automatic processing of meeting requests:
- On the Microsoft Exchange server, check whether or not notifications are enabled. To do so, execute the command:
Get-CalendarProcessing -Identity <email address for receiving messages by Kaspersky Anti Targeted Attack Platform> | fl - If automatic processing of meeting requests is enabled, run the following command:
Set-CalendarProcessing -Identity <email address for receiving messages by Kaspersky Anti Targeted Attack Platform> -AutomateProcessing:None
Automatic processing of meeting requests will be disabled.
Preparing the IT infrastructure for integration with a mail server used for receiving messages via SMTP
To prepare your corporate IT infrastructure for Kaspersky Anti Targeted Attack Platform integration with a mail server over the SMTP protocol:
- On the external mail server, configure rules for forwarding copies of the messages that you want to send for scanning by Kaspersky Anti Targeted Attack Platform to the addresses specified in Kaspersky Anti Targeted Attack Platform.
- Specify the route for forwarding email messages to the Sensor server.
It is recommended to specify a static route – IP address of the Sensor server.
- Configure the firewall of your organization to allow inbound connections to port 25 of the Sensor server from mail servers that are forwarding copies of email messages.
You can also improve the security of Kaspersky Anti Targeted Attack Platform integration with a mail server over the SMTP protocol.
To improve the security of Kaspersky Anti Targeted Attack Platform integration with a mail server over the SMTP protocol.
- Configure authentication of the Kaspersky Anti Targeted Attack Platform server on the side of the mail servers forwarding email messages for Kaspersky Anti Targeted Attack Platform.
- Configure mandatory encryption of traffic on mail servers that are forwarding email messages for Kaspersky Anti Targeted Attack Platform.
- Configure authentication of mail servers forwarding email messages for Kaspersky Anti Targeted Attack Platform on the Kaspersky Anti Targeted Attack Platform side.
Preparing the virtual machine for installing the Sandbox component
To prepare the virtual machine for installing the Sandbox component:
- Run the VMware ESXi hypervisor.
- Open the virtual machine management console.
- In the context menu of the virtual machine on which you want to install the Sandbox component, choose Edit Settings.
This opens the virtual machine properties window.
- On the Virtual Hardware tab, expand the CPU settings group and select the Expose hardware-assisted virtualization to guest OS check box.
- On the VM Options tab in the Latency Sensitivity drop-down list, select High.
- Click Ok.
The virtual machine is ready for installing the Sandbox component.
Preparing an installation disk image with the Central Node, Sensor, and Sandbox components
Before installing the application, you must prepare an iso image of the installation disk with the Central Node, Sensor, and Sandbox components based on the Astra Linux operating system.
Minimum hardware requirements for a device that can be used to create the iso image:
- CPU: 4 cores, clock rate 2500 MHz or more.
- RAM: 8 GB.
- Available disk space: 100 GB.
Software requirements:
- Operating system based on an up-to-date Linux kernel.
- Docker 20 or later
- Availability of the iso image of the Astra Linux Special Edition 1.7.5
Kaspersky Anti Targeted Attack Platform does not support other versions of the Astra Linux operating system.
To mount an iso image of the Central Node and Sensor or Sandbox components based on the Astra Linux operating system:
- From the distribution kit, download the Central Node and Sensor component distribution kit (kata-cn-distribution-7.0.3.520-x86_64_en-ru-zh.tar.gz), the Sandbox component distribution kit (kata-sb-distribution-7.0.3.520-x86_64_en-ru.tar.gz), and the file named iso-builder-7.0.3.520-x86_64_en-ru.tar.
- Create an iso_builder.sh file with the following content.
- Run the
mkdir /var/kata_buildercommand. - Put the files listed in step 1 in the newly created /var/kata_builder directory. Make sure that the Astra Linux Special Edition 1.7.5 iso image is named installation-1.7.5.16-06.02.24_14.21.iso. If the name of the iso image is different, please rename it.
- Run the following command:
- If you are preparing a disk image with the Central Node and Sensor components:
sudo ./iso_builder.sh /var/kata_builder/installation-1.7.5.16-06.02.24_14.21.iso /var/kata_builder/kata-cn-distribution-7.0.3.520-x86_64_en-ru-zh.tar.gz /var/kata_builder/iso-builder-7.0.3.520-x86_64_en-ru.tar /var/kata_builder buildCNSensorAstra.iso - If you are preparing a disk image with the Sandbox component:
sudo ./iso_builder.sh /var/kata_builder/installation-1.7.5.16-06.02.24_14.21.iso /var/kata_builder/kata-sb-distribution-7.0.3.520-x86_64_en-ru.tar.gz /var/kata_builder/iso-builder-7.0.3.520-x86_64_en-ru.tar /var/kata_builder buildSandboxAstra.iso
- If you are preparing a disk image with the Central Node and Sensor components:
After running the commands, the installation disk images with the Central Node and Sensor components named buildCNSensorAstra.iso and buildSandboxAstra.iso are located in the /var/kata_builder directory.
If you use other directories for storing files, you can run the command as follows: sudo ./iso_builder.sh <source_iso_host_path> <distribution_host_path> <iso_builder_image_host_path> <build_host_path> <target_iso_name>, where:
- source_iso_host_path is the path to the distribution kit of the Astra Linux Special Edition 1.7.5.
- distribution_host_path is the path to the distribution kit: kata-cn-distribution-7.0.3.520-x86_64_en-ru-zh.tar.gz or kata-sb-distribution-7.0.3.520-x86_64_en-ru.tar.gz.
- iso_builder_image_host_path is the path to the iso-builder-7.0.3.520-x86_64_en-ru.tar file.
- build_host_path is the path where the mounted ISO image must be located, without specifying the name being assigned to the ISO image.
- target_iso_name is the name that is being assigned to the ISO image.
Procedure for installing and configuring application components
Installing and configuring the application involves the following steps:
- Installing the disk image containing the Sandbox component
- Configuring the Sandbox component through the Sandbox web interface
- Installing the disk images of Microsoft Windows operating systems and applications for the Sandbox component
- Installing the Central Node and Sensor components
You can install the Central Node and Sensor components in one of the following configurations:
If there are multiple Central Node components, you can use the application in distributed solution mode.
- Installing the Sensor component
If there are multiple Sensor components, you can install and configure the Sensor component on the necessary number of servers.
- Configuring the Central Node and Sensor components
- Installing the Endpoint Agent component on computers of the corporate IT infrastructure.
As the Endpoint Agent component, you may use following applications: Kaspersky Endpoint Agent for Windows, Kaspersky Endpoint Security for Windows, Kaspersky Endpoint Security for Linux, Kaspersky Endpoint Security for Mac.
Information about the compatibility of versions of applications that represent the Endpoint Agent component with versions of Kaspersky Anti Targeted Attack Platform is provided in the following Help sections: Kaspersky Endpoint Agent for Windows, Kaspersky Endpoint Security for Windows, Kaspersky Endpoint Security for Linux, Kaspersky Endpoint Security for Mac.
The Kaspersky Endpoint Agent application can be used in the following configurations:
- Without integration with the EPP application.
In this case, you only need to install Kaspersky Endpoint Agent for Windows.
- With integration with the EPP application.
In this case, Kaspersky Endpoint Agent also sends information about threats detected by the EPP application and results of threat processing by this application to the Central Node server.
Kaspersky Endpoint Agent for Windows can integrate with the following EPP applications:
- Kaspersky Endpoint Security for Windows
Integration of Kaspersky Endpoint Agent for Windows with Kaspersky Endpoint Security for Windows
- Kaspersky Security for Windows Server.
Integration of Kaspersky Endpoint Agent for Windows with Kaspersky Security for Windows Server
- Kaspersky Security for Virtualization Light Agent for Windows.
- Kaspersky Industrial CyberSecurity for Nodes.
Information about compatibility of Kaspersky Endpoint Agent for Windows versions with EPP applications is provided in the Compatibility of Kaspersky Endpoint Agent for Windows versions with EPP applications section.
For details about installing Kaspersky Endpoint Security, see the Online Help of the application:
- Installing Kaspersky Endpoint Security for Windows
- Installing Kaspersky Endpoint Security for Linux
- Installing Kaspersky Endpoint Security for Mac
If your hosts have earlier versions of applications installed, you can upgrade them. For details, see the following sections.
Installing the Sandbox component
This section provides step-by-step instructions on installing the Sandbox component.
To begin the installation of the Sandbox component:
- Run the disk image containing the Sandbox component.
The Setup Wizard starts.
- Click Ok.
Step 1. Viewing the End User License Agreement and Privacy Policy
To continue installation, please read the End User License Agreement (EULA) and accept its terms and conditions. Installation will not continue until you accept the terms of the End User License Agreement.
You must also read the Privacy Policy and accept its terms and conditions. If the Privacy Policy is not accepted, the installation cannot proceed.
To accept the terms and conditions of the End User License Agreement and the Privacy Policy when installing the Sandbox component based on the Ubuntu Server operating system:
- Select the language for viewing the End User License Agreement and Privacy Policy in the list and press Enter.
This opens a window showing the End User License Agreement text.
- Please read the End User License Agreement.
- If you accept the terms of the End User License Agreement, click I accept.
This opens a window displaying the text of the Privacy Policy.
- Please carefully read the Privacy Policy.
- If you accept the terms of the Privacy Policy, click I accept.
The Setup Wizard proceeds to the next step.
To accept the terms and conditions of the End User License Agreement and the Privacy Policy when installing the Sandbox component based on the Astra Linux operating system:
- If you are installing using BIOS, select the language for viewing the End User License Agreement for Astra Linux operating systems from the list by pressing the F1 key and press Enter.
This opens a window with the text of the Astra Linux End User License Agreement.
- Read the End User License Agreement of the Astra Linux operating systems.
To move up and down, you can use the keys: ↑, ↓, PageUp, and PageDown.
- If you accept the terms and conditions of the End User License Agreement of Astra Linux operating systems, select Yes and press Enter.
This opens a window in which you can select the language for viewing the AO Kaspersky Lab End User License Agreement and Privacy Policy.
- Read the AO Kaspersky Lab End User License Agreement.
To move up and down, you can use the keys: ↑, ↓, PageUp, and PageDown.
- If you accept the terms and conditions of the AO Kaspersky Lab End User License Agreement, select the I accept button and press Enter.
This opens a window with the text of the AO Kaspersky Lab Privacy Policy.
- Read the AO Kaspersky Lab Privacy Policy.
- If you accept the terms and conditions of the AO Kaspersky Lab Privacy Policy, select the I accept button and press Enter.
The Setup Wizard proceeds to the next step.
Step 2. Selecting a disk for installing the Sandbox component
Select a physical disk for installing the Sandbox component.
To select a disk for installing the Sandbox component:
- In the Select device window, in the list of disks, select the disk on which you want to install the Sandbox component and press ENTER.
If the disk is not empty, a window is displayed asking you to confirm that you want to format the disk and install the application.
- Click Install.
The archive with the installation files will be unpacked to the disk. The server is restarted.
The Setup Wizard proceeds to the next step.
Step 3. Assigning the host name
Assign a server host name to be used by DNS servers.
To assign the host name for a server:
- Enter the full domain name of the server into the Hostname field.
Specify the server name in FQDN format (for example: host.domain.com or host.domain.subdomain.com).
- Click Ok.
The Setup Wizard proceeds to the next step.
Step 4. Selecting the controlling network interface in the list
To ensure proper functioning of the Sandbox component, you must connect at least two network cards and configure the following network Interfaces:
- Management network interface. This interface is intended for providing SSH access to the Sandbox server; the Sandbox server also uses this interface to receive objects from the Central Node.
- Network interface used for Internet access of processed objects. Objects that are processed by Sandbox can use this interface to attempt activities on the Internet, and Sandbox can analyze their behavior. If you block Internet access, Sandbox cannot analyze the behavior of objects on the Internet, and will therefore only analyze the behavior of objects without internet access.
The network interface used for Internet access of processed objects must be isolated from the local network of your organization.
Select the network interface that you want to use as the controlling interface.
To select the management network interface:
- In the list of network interfaces, select the network interface that you want to use as the controlling interface.
- Press ENTER.
The Setup Wizard proceeds to the next step.
Step 5. Assigning the address and network mask of the controlling interface
To assign the IP address and network mask of the management network interface:
- In the Address field, enter the IP address that you want to assign to this network interface.
- In the Netmask field, enter the network mask in which you want to use this network interface.
- Click Ok.
The Setup Wizard proceeds to the next step.
Step 6. Adding DNS server addresses
To add DNS server addresses:
- In the DNS servers window, select New and press ENTER.
This opens the DNS server address entry window.
- In the DNS server text box, enter the IP address of the primary DNS server in IPv4 format.
- Click Ok.
The DNS server address entry window is closed.
- If you want to add the IP address of an additional DNS server, repeat the steps in the DNS servers window.
- When you are done adding DNS servers, in the DNS servers window, select Continue and press ENTER.
The Setup Wizard proceeds to the next step.
Step 7. Configuring a static network route
To configure a static network route:
- In the IPv4 Routes window, select New and press ENTER.
This opens the IPv4 Static Route window.
- In the Address/Mask field, enter the IP address and mask of the subnet for which you want to configure the network route.
- If you want to use the default network route, enter 0.0.0.0/0.
- In the Gateway field, enter the IP address of the gateway.
- Click Ok.
- If you want to add other network routes, repeat the steps in the IPv4 Static Route window.
- If you are done adding network routes, click Continue.
The Setup Wizard proceeds to the next step.
Step 8. Configuring the minimum password length for the Sandbox administrator password
To set the minimum length of the administrator password for the Sandbox component:
- In the Minimal length, enter the length in characters. Passwords 12 or more characters long are recommended.
- Click Ok.
The Setup Wizard proceeds to the next step.
Step 9. Creating the Sandbox administrator account
Create an administrator account for working in the Sandbox web interface in the administrator menu and in the management console of the server with the Sandbox component.
To create a Sandbox administrator account:
- In the Username field, enter the name of the administrator account. The 'admin' account is used by default.
- In the password field, enter the password for the administrator account.
The password must satisfy the following requirements:
- Must contain at least 8 characters.
- Must contain at least three types of characters:
- Uppercase character (A-Z).
- Lowercase character (a-z).
- Number.
- Special character.
- Must not be the same as the user name.
- Enter the password again in the Confirm password field.
- Click Ok.
This opens a window with the IP address of the Sandbox server. You can enter this address in your web browser to open the Sandbox web interface. To log in, use the Sandbox administrator account that you have created.
The Sandbox server will restart.
Proceed to configuration of the Sandbox component through the web interface.
Deploying the Central Node component with Embedded Sensor as a cluster
A cluster must include at least 4 servers: 2 storage servers and 2 processing servers. You can use the Sizing Guide determine the right number of servers for your organization.
Deployment of the Central Node component with Embedded Sensor in the form of a cluster includes the following steps:
- Deploying the first storage server
The first step is to deploy the storage server. After the storage server is deployed, you can add additional storage and processing servers to the cluster.
- Deploying processing servers and additional storage servers
You can deploy the servers in any order.
- Configuring the sizing settings of the application
At the final stage of cluster deployment, you need to configure the scaling settings of the application: specify the planned volume of SPAN traffic, email traffic, the number of hosts with the Endpoint Agent component, as well as the size of the Storage and event database.
The Central Node component is always installed together with the Sensor component. If you need to use the Central Node component separately, when deploying the processing server, turn off receipt of mirrored traffic from SPAN ports at step 10.
If you have a cluster deployed on physical servers and want to add more hard drives to these servers or replace some of the existing drives and then reinstall the cluster, you must purge the drives previously allocated for the OSD (Object Storage Daemon) on the storage servers before installing components. Otherwise, the application is not guaranteed to work correctly. If you want to completely disconnect the drives and no longer plan to reconnect them to the server, purging the drives is not necessary.
Deploying a storage server
To deploy a data storage server, you need to run a disk image with the Central Node and Sensor components.
If an error occurred while performing the steps of the Setup Wizard, contact Technical Support.
Step 1. Viewing the End User License Agreement and Privacy Policy
To continue the installation, you must read the End User License Agreement and Privacy Policy and accept their terms and conditions. Installation will not continue until you accept the terms of the End User License Agreement and Privacy Policy.
To accept the terms and conditions of the End User License Agreement and the Privacy Policy when installing the components based on the Ubuntu operating system:
- Select the language for viewing the AO Kaspersky Lab End User License Agreement and Privacy Policy in the list and press Enter.
This opens a window with the text of the AO Kaspersky Lab End User License Agreement.
- Read the AO Kaspersky Lab End User License Agreement.
To move up and down, you can use the keys: ↑, ↓, PageUp, and PageDown.
- If you accept the AO Kaspersky Lab End User License Agreement, select the I accept button and press Enter.
This opens a window with the text of the AO Kaspersky Lab Privacy Policy.
- Read the AO Kaspersky Lab Privacy Policy.
- If you accept the terms and conditions of the AO Kaspersky Lab Privacy Policy, select the I accept button and press Enter.
The Setup Wizard proceeds to the next step.
To accept the terms and conditions of the End User License Agreement and the Privacy Policy when installing the components based on the Astra Linux operating system:
- Select the language for viewing the End User License Agreement for Astra Linux operating systems from the list by pressing the F1 key and press Enter.
This opens a window with the text of the Astra Linux End User License Agreement.
- Read the End User License Agreement of the Astra Linux operating systems.
To move up and down, you can use the keys: ↑, ↓, PageUp, and PageDown.
- If you accept the terms and conditions of the End User License Agreement of Astra Linux operating systems, select Yes and press Enter.
This opens a window in which you can select the language for viewing the AO Kaspersky Lab End User License Agreement and Privacy Policy.
- Select the language for viewing the AO Kaspersky Lab End User License Agreement and Privacy Policy in the list and press Enter.
This opens a window with the text of the AO Kaspersky Lab End User License Agreement.
- Read the AO Kaspersky Lab End User License Agreement.
To move up and down, you can use the keys: ↑, ↓, PageUp, and PageDown.
- If you accept the terms and conditions of the AO Kaspersky Lab End User License Agreement, select the I accept button and press Enter.
This opens a window with the text of the AO Kaspersky Lab Privacy Policy.
- Read the AO Kaspersky Lab Privacy Policy.
- If you accept the terms and conditions of the AO Kaspersky Lab Privacy Policy, select the I accept button and press Enter.
The Setup Wizard proceeds to the next step.
Page top
Step 2. Selecting a server role
To select a server role:
- Select one of the following options:
- storage.
This role is for installing a storage server for deploying the Central Node component as a cluster.
- processing.
This role is for installing a processing server for deploying the Central Node component as a cluster.
The role also includes the installation and configuration of the Sensor component.
- single.
This role is for installing the Central Node and Sensor components on the same server.
- sensor.
This role is for installing the Sensor component on a standalone server.
- storage.
- Press Enter.
The Setup Wizard proceeds to the next step.
Page top
Step 3. Selecting the deployment mode
To select a deployment mode:
- Select one of the following options:
- First node installation.
Select this value when deploying the first server in the cluster.
- Add extra node to the cluster.
Select this value when deploying a server that will be added to an existing cluster.
- First node installation.
- Press Enter.
The Setup Wizard proceeds to the next step.
Page top
Step 4. Selecting a disk for installing the component
You need at least 150 GB of disk space. If less than 150 GB of disk space is available, installation finishes with an error.
To select a disk for installing the component:
- Select one of the suggested drives for installing the component and press Enter.
The confirmation window is displayed.
- Select Yes and press Enter.
The Setup Wizard proceeds to the next step.
Page top
Step 5. Selecting a network mask for server addressing
We recommend using the default value.
The netmask may not match netmasks used in the organization's infrastructure.
To specify the network mask for server addressing:
- If you want to use the predefined value for the network mask, select the Ok button and press Enter.
Default value: 198.18.0.0/16.
- If you want to specify a different network mask, in the Subnet field, enter your value, select the Ok button, and press Enter.
The mask must match the template: x.x.0.0/16.
The Setup Wizard proceeds to the next step.
Page top
Step 6. Selecting a network mask for addressing of application components
We recommend using the default value.
The network for application component addressing must not overlap with the network for cluster server addressing.
To specify the network mask for addressing the main components of the application:
- If you want to use the predefined value for the network mask, select the Ok button and press Enter.
Default value: 198.19.0.0/16.
- If you want to specify a different network mask, in the Bridge/overlay subnets field, enter your value, select the Ok button, and press Enter.
The mask must match the template: x.x.0.0/16.
The Setup Wizard proceeds to the next step.
Page top
Step 7. Selecting the cluster network interface
The cluster network interface is used for communication between cluster servers.
To select the cluster network interface:
- Select the row containing the network interface that is used for the internal network.
To select a row, you can use the ↑, ↓, PageUp, and PageDown keys. The selected row is highlighted in red.
- Press Enter.
The Setup Wizard proceeds to the next step.
Page top
Step 8. Selecting the external network interface
The external network interface is used for SSH access to the server, managing the web interface of Kaspersky Anti Targeted Attack Platform, and other external connections.
To select the external network interface:
- Select the row containing the network interface that is used for the external network.
To select a row, you can use the ↑, ↓, PageUp, and PageDown keys. The selected row is highlighted in red.
- Press Enter.
The Setup Wizard proceeds to the next step.
Page top
Step 9. Selecting the method of obtaining IP addresses for network interfaces
To select a method for obtaining an IP address for network interfaces:
- Select the row containing the Configuration type: and press Enter.
To select a row, you can use the ↑, ↓, PageUp, and PageDown keys. The selected row is highlighted in red.
- In the opened window, select one of the following options:
- dhcp.
- static.
- If you selected static:
- Select the row containing the parameter and press the Enter key.
- In the opened window, enter the required data and press Enter twice.
You need to specify a value for each parameter.
- Select the row containing Save.
- Press Enter.
The Setup Wizard proceeds to the next step.
Page top
Step 10. Creating an administrator account and authenticating the server in the cluster
During this step, you need to do one of the following:
- Create an administrator account if you are deploying the first server in the cluster.
- Authenticate a server in the cluster if you are deploying additional storage servers.
Creating the administrator account
An administrator account is only required when deploying the first server in the cluster. If you are deploying an additional storage server, instead of opening a window that prompts you to create an administrator account, the application prompts you to authenticate the server in the cluster.
When deploying the first server in the cluster, you need to create an administrator account. This user account is used for managing the web interface of the application, the administrator menu of the application, and for managing the application in Technical Support Mode.
By default, the user name of the administrator account is admin. You must enter a password for that user account.
To enter a password for the administrator user account:
- This opens a window; in that window, in the min length field, enter the minimum password length. You must enter a value of 8 or greater.
- Select Ok and press Enter.
This opens the password creation window.
- This opens a window; in that window, in the password field, enter the password for the administrator account.
To select a row, you can use the ↑, ↓, PageUp, and PageDown keys. The selected row is highlighted in red.
- In the confirm field, enter the password again.
- Select Ok and press Enter.
The Setup Wizard proceeds to the next step.
Page top
Authenticating the server in the cluster
Authenticating a server in the cluster is only required when deploying additional storage servers. If you are deploying the first server in the cluster, the application prompts you to create an administrator account instead of authenticating the server.
To authenticate a server in the cluster, you need to enter the admin account password that was set when the first server in the cluster was deployed.
To authenticate a server in the cluster:
- In the password field, enter the password for the administrator account.
- Select Ok and press Enter.
To select a button, you can use the ↑, ↓, PageUp, and PageDown keys.
The server in the cluster will be authenticated. The Setup Wizard proceeds to the next step.
Page top
Step 11. Adding DNS server addresses
This step is available if you are deploying the first server in the cluster.
Configure the DNS settings for the operation of servers with application components.
To add DNS server addresses:
- Select the Add field and press Enter.
- Enter the IP address of the DNS server in the IPv4 format.
- If you want to add the IP address of an additional DNS server, select the Add field, press Enter and enter the address of the server.
- Having added all DNS servers, select the Continue field and press Enter.
The Setup Wizard proceeds to the next step.
Page top
Step 12. Configuring time synchronization with an NTP server
This step is available if you are deploying the first server in the cluster.
Configure synchronization of the server time with the NTP server.
- Select the Add field and press Enter.
- Enter the IP address or name of the NTP server.
- If you want to add the IP address or name of an additional NTP server, select the Add field, press Enter, and enter the IP address or name of the NTP server.
- Having added all NTP servers, select the Continue field and press Enter.
The Setup Wizard proceeds to the next step.
For the cluster to function, time must be synchronized on servers of the cluster. Make sure that the NTP server that you are adding is working correctly and can assure time synchronization among the cluster servers.
Page top
Step 13. Selecting disks for the Ceph storage
Select the disks for the Ceph storage. The number of drives is determined according to the scaling guide.
To select disks for the Ceph storage:
- Select the row containing the required drive.
To select a row, you can use the ↑, ↓, PageUp, and PageDown keys. The selected row is highlighted in red.
- Press Enter.
- Repeat steps 1 to 2 to select more drives if you want to select multiple drives.
- Select the Apply and finish field and press Enter.
The confirmation window is displayed.
- Select Yes and press Enter.
The configuration may take some time. Then the installation is complete. You can proceed to configure the servers of the cluster.
Page top
Deploying the processing server
To deploy a processing server, you need to run a disk image with the Central Node and Sensor components.
If an error occurred while performing the steps of the Setup Wizard, contact Technical Support.
Step 1. Viewing the End User License Agreement and Privacy Policy
To continue the installation, you must read the End User License Agreement and Privacy Policy and accept their terms and conditions. Installation will not continue until you accept the terms of the End User License Agreement and Privacy Policy.
To accept the terms and conditions of the End User License Agreement and the Privacy Policy when installing the components based on the Ubuntu operating system:
- Select the language for viewing the AO Kaspersky Lab End User License Agreement and Privacy Policy in the list and press Enter.
This opens a window with the text of the AO Kaspersky Lab End User License Agreement.
- Read the AO Kaspersky Lab End User License Agreement.
To move up and down, you can use the keys: ↑, ↓, PageUp, and PageDown.
- If you accept the AO Kaspersky Lab End User License Agreement, select the I accept button and press Enter.
This opens a window with the text of the AO Kaspersky Lab Privacy Policy.
- Read the AO Kaspersky Lab Privacy Policy.
- If you accept the terms and conditions of the AO Kaspersky Lab Privacy Policy, select the I accept button and press Enter.
The Setup Wizard proceeds to the next step.
To accept the terms and conditions of the End User License Agreement and the Privacy Policy when installing the components based on the Astra Linux operating system:
- Select the language for viewing the End User License Agreement for Astra Linux operating systems from the list by pressing the F1 key and press Enter.
This opens a window with the text of the Astra Linux End User License Agreement.
- Read the End User License Agreement of the Astra Linux operating systems.
To move up and down, you can use the keys: ↑, ↓, PageUp, and PageDown.
- If you accept the terms and conditions of the End User License Agreement of Astra Linux operating systems, select Yes and press Enter.
This opens a window in which you can select the language for viewing the AO Kaspersky Lab End User License Agreement and Privacy Policy.
- Select the language for viewing the AO Kaspersky Lab End User License Agreement and Privacy Policy in the list and press Enter.
This opens a window with the text of the AO Kaspersky Lab End User License Agreement.
- Read the AO Kaspersky Lab End User License Agreement.
To move up and down, you can use the keys: ↑, ↓, PageUp, and PageDown.
- If you accept the terms and conditions of the AO Kaspersky Lab End User License Agreement, select the I accept button and press Enter.
This opens a window with the text of the AO Kaspersky Lab Privacy Policy.
- Read the AO Kaspersky Lab Privacy Policy.
- If you accept the terms and conditions of the AO Kaspersky Lab Privacy Policy, select the I accept button and press Enter.
The Setup Wizard proceeds to the next step.
Page top
Step 2. Selecting a server role
To select a server role:
- Select one of the following options:
- storage.
This role is for installing a storage server for deploying the Central Node component as a cluster.
- processing.
This role is for installing a processing server for deploying the Central Node component as a cluster.
The role also includes the installation and configuration of the Sensor component.
- single.
This role is for installing the Central Node and Sensor components on the same server.
- sensor.
This role is for installing the Sensor component on a standalone server.
- storage.
- Press Enter.
The Setup Wizard proceeds to the next step.
Page top
Step 3. Selecting a disk for installing the component
You need at least 150 GB of disk space. If less than 150 GB of disk space is available, installation finishes with an error.
To select a disk for installing the component:
- Select one of the suggested drives for installing the component and press Enter.
The confirmation window is displayed.
- Select Yes and press Enter.
The Setup Wizard proceeds to the next step.
Page top
Step 4. Selecting a network mask for cluster server addressing
We recommend using the default value.
The netmask may not match netmasks used in the organization's infrastructure.
To specify the network mask for cluster server addressing:
- If you want to use the predefined value for the network mask, select the Ok button and press Enter.
Default value: 198.18.0.0/16.
- If you want to specify a different network mask, in the Subnet field, enter your value, select the Ok button, and press Enter.
The mask must match the template: x.x.0.0/16.
The Setup Wizard proceeds to the next step.
Page top
Step 5. Selecting a network mask for addressing of application components
We recommend using the default value.
The network for application component addressing must not overlap with the network for cluster server addressing.
To specify the network mask for addressing the main components of the application:
- If you want to use the predefined value for the network mask, select the Ok button and press Enter.
Default value: 198.19.0.0/16.
- If you want to specify a different network mask, in the Bridge/overlay subnets field, enter your value, select the Ok button, and press Enter.
The mask must match the template: x.x.0.0/16.
The Setup Wizard proceeds to the next step.
Page top
Step 6. Selecting the cluster network interface
The cluster network interface is used for communication between cluster servers.
To select the cluster network interface:
- Select the row containing the network interface that is used for the internal network.
To select a row, you can use the ↑, ↓, PageUp, and PageDown keys. The selected row is highlighted in red.
- Press Enter.
The Setup Wizard proceeds to the next step.
Page top
Step 7. Selecting the external network interface
The external network interface is used for SSH access to the server, managing the web interface of Kaspersky Anti Targeted Attack Platform, and other external connections.
To select the external network interface:
- Select the row containing the network interface that is used for the external network.
To select a row, you can use the ↑, ↓, PageUp, and PageDown keys. The selected row is highlighted in red.
- Press Enter.
The Setup Wizard proceeds to the next step.
Page top
Step 8. Selecting the method of obtaining IP addresses for network interfaces
To select a method for obtaining an IP address for network interfaces:
- Select the row containing the Configuration type: and press Enter.
To select a row, you can use the ↑, ↓, PageUp, and PageDown keys. The selected row is highlighted in red.
- In the opened window, select one of the following options:
- dhcp.
- static.
- If you selected static:
- Select the row containing the parameter and press the Enter key.
- In the opened window, enter the required data and press Enter twice.
You need to specify a value for each parameter.
- Select the row containing Save.
- Press Enter.
The Setup Wizard proceeds to the next step.
Page top
Step 9. Authenticating the server in the cluster
To authenticate a server in the cluster, you need to enter the admin account password that was set when the first server in the cluster was deployed.
To authenticate a server in the cluster:
- In the password field, enter the password for the administrator account.
- Select Ok and press Enter.
To select a button, you can use the ↑, ↓, PageUp, and PageDown keys.
The server in the cluster will be authenticated. The Setup Wizard proceeds to the next step.
Page top
Step 10. Selecting the localization language for the NDR functionality and configuring the receipt of mirrored traffic from SPAN ports
If you are deploying the first worker server of the cluster, at this step, you must complete the steps of the Setup Wizard in the following order:
- Select the localization language for the NDR functionality.
- Configure the receipt of mirrored traffic from SPAN ports.
If you are deploying an additional worker server, the NDR localization selection step is omitted. After authenticating the server in the cluster, the Setup Wizard proceeds to the step at which you configure the receipt of mirrored traffic from SPAN ports.
Page top
Selecting the localization language for the NDR functionality
The selected language is used to display the parts of the application that have to do with the NDR functionality.
To select the localization language for the NDR functionality:
Select it in the list and press Enter.
The localization language of the NDR functionality is selected. The Setup Wizard proceeds to the step at which you configure the receipt of mirrored traffic from SPAN ports.
Page top
Configuring receipt of mirrored traffic from SPAN ports
To turn on receipt of mirrored traffic from SPAN ports:
- This opens a window, in that window, select Yes and press Enter.
- In the displayed list, select the network interfaces from which you want to capture network traffic.
- Select the line containing Apply and finish and press Enter.
The configuration may take some time. Then the installation is complete. For the application to work correctly, you must configure the server.
To turn off the receipt of mirrored traffic from SPAN ports:
In the opened window, select No and press Enter.
The configuration may take some time. Then the installation is complete. For the application to work correctly, you must configure the server.
Page top
Purging hard disks on storage servers
If you have a cluster deployed on servers and want to add more hard drives to these servers or replace some of the existing drives and then reinstall the cluster, you must purge the drives previously allocated for the OSD (Object Storage Daemon) on the storage servers before installing components. Otherwise, the application is not guaranteed to work correctly.
To purge the disks allocated for OSD on a live storage server:
- Sign in to the management console of the server where you want to purge the disks over SSH or through the terminal.
- Stop the OSD starter service by running
sudosystemctl stop kata-osd-starter.service. - Stop OSD containers by running
sudodocker ps --filter name=osd -q | xargs docker stop. - Get a list of OSD disks by running
sudoceph-volume --cluster ceph lvm list | grep devices. - Purge these disks by running
sudoceph-volume lvm zap --destroy /dev/<disk name>.You must run this command for each drive that you got at step 4. For example:
sudoceph-volume lvm zap --destroy /dev/sda.
The OSD daemon is removed from the disks.
If the server is not live, you must delete the information about volume groups from each disk allocated for the OSD.
To delete the information about volume groups from each disk allocated for the OSD on a non-live server:
- Start the server with the alternative operating system.
- Get group IDs for each disk allocated for the OSD using the
sudopvscommand.This command outputs a table where
PVare physical volumes,VGindicates logical group membership,Fmtindicates the volume format, andSizeindicates the physical volume size. - Remove the relevant volume groups by running
sudovgremove <volume group ID>.
Information about volume groups on disks allocated for OSD is deleted.
Page top
Installing the Central Node component with Embedded Sensor on a server
Deploying the Central Node component with Embedded Sensor on a server involves the following steps:
- Installing the Central Node component with Embedded Sensor
To install the component on the physical server, you need to boot from a disk image with the Central Node and Sensor components.
To install the component on a virtual server, you need to connect the disk image with the Central Node and Sensor components to the selected virtual machine and boot the virtual machine. The installation starts immediately after the virtual machine is turned on. You can manage the installation process using the console of the virtual machine.
- Configuring the sizing settings of the application
At the final stage of cluster deployment, you need to configure the scaling settings of the application: specify the planned volume of SPAN traffic, email traffic, the number of hosts with the Endpoint Agent component, as well as the size of the Storage and event database.
The Central Node component is always installed together with the Sensor component. If you need to use the Central Node component separately, turn off receipt of mirrored traffic from SPAN ports in step 10.
If an error occurred while performing the steps of the Setup Wizard, contact Technical Support.
Step 1. Viewing the End User License Agreement and Privacy Policy
To continue the installation, you must read the End User License Agreement and Privacy Policy and accept their terms and conditions. Installation will not continue until you accept the terms of the End User License Agreement and Privacy Policy.
To accept the terms and conditions of the End User License Agreement and the Privacy Policy when installing the components based on the Ubuntu operating system:
- Select the language for viewing the AO Kaspersky Lab End User License Agreement and Privacy Policy in the list and press Enter.
This opens a window with the text of the AO Kaspersky Lab End User License Agreement.
- Read the AO Kaspersky Lab End User License Agreement.
To move up and down, you can use the keys: ↑, ↓, PageUp, and PageDown.
- If you accept the AO Kaspersky Lab End User License Agreement, select the I accept button and press Enter.
This opens a window with the text of the AO Kaspersky Lab Privacy Policy.
- Read the AO Kaspersky Lab Privacy Policy.
- If you accept the terms and conditions of the AO Kaspersky Lab Privacy Policy, select the I accept button and press Enter.
The Setup Wizard proceeds to the next step.
To accept the terms and conditions of the End User License Agreement and the Privacy Policy when installing the components based on the Astra Linux operating system:
- Select the language for viewing the End User License Agreement for Astra Linux operating systems from the list by pressing the F1 key and press Enter.
This opens a window with the text of the Astra Linux End User License Agreement.
- Read the End User License Agreement of the Astra Linux operating systems.
To move up and down, you can use the keys: ↑, ↓, PageUp, and PageDown.
- If you accept the terms and conditions of the End User License Agreement of Astra Linux operating systems, select Yes and press Enter.
This opens a window in which you can select the language for viewing the AO Kaspersky Lab End User License Agreement and Privacy Policy.
- Select the language for viewing the AO Kaspersky Lab End User License Agreement and Privacy Policy in the list and press Enter.
This opens a window with the text of the AO Kaspersky Lab End User License Agreement.
- Read the AO Kaspersky Lab End User License Agreement.
To move up and down, you can use the keys: ↑, ↓, PageUp, and PageDown.
- If you accept the terms and conditions of the AO Kaspersky Lab End User License Agreement, select the I accept button and press Enter.
This opens a window with the text of the AO Kaspersky Lab Privacy Policy.
- Read the AO Kaspersky Lab Privacy Policy.
- If you accept the terms and conditions of the AO Kaspersky Lab Privacy Policy, select the I accept button and press Enter.
The Setup Wizard proceeds to the next step.
Page top
Step 2. Selecting a server role
To select a server role:
- Select one of the following options:
- storage.
This role is for installing a storage server for deploying the Central Node component as a cluster.
- processing.
This role is for installing a processing server for deploying the Central Node component as a cluster.
The role also includes the installation and configuration of the Sensor component.
- single.
This role is for installing the Central Node and Sensor components on the same server.
- sensor.
This role is for installing the Sensor component on a standalone server.
- storage.
- Press Enter.
The Setup Wizard proceeds to the next step.
Page top
Step 3. Selecting a disk for installing the component
You need at least 150 GB of disk space. If less than 150 GB of disk space is available, installation finishes with an error.
To select a disk for installing the component:
- Select one of the suggested drives for installing the component and press Enter.
The confirmation window is displayed.
- Select Yes and press Enter.
The Setup Wizard proceeds to the next step.
Page top
Step 4. Allocating the disk for the Targeted Attack Analyzer component's database
For optimal performance of the Targeted Attack Analyzer component, it is advised that you allocate on the server a physical disk of at least 1 TB for the component's database.
In this step, you can allocate a physical disk for the Targeted Attack Analyzer component's database or decline allocating a physical disk.
To allocate the disk for the Targeted Attack Analyzer component's database:
- Select one of the suggested drives for the Targeted Attack Analyzer component database.
If you do not need the database of the Targeted Attack Analyzer component, select Do not allocate a separate disk for TAA line.
The confirmation window is displayed.
- Select Yes and press Enter.
The Setup Wizard proceeds to the next step.
Page top
Step 5. Selecting a network mask for server addressing
We recommend using the default value.
The netmask may not match netmasks used in the organization's infrastructure.
To specify the network mask for server addressing:
- If you want to use the predefined value for the network mask, select the Ok button and press Enter.
Default value: 198.18.0.0/16.
- If you want to specify a different network mask, in the Subnet field, enter your value, select the Ok button, and press Enter.
The mask must match the template: x.x.0.0/16.
The Setup Wizard proceeds to the next step.
Page top
Step 6. Selecting a network mask for addressing of application components
We recommend using the default value.
The network for application component addressing must not overlap with the network for server addressing.
To specify the network mask for addressing the main components of the application:
- If you want to use the predefined value for the network mask, select the Ok button and press Enter.
Default value: 198.19.0.0/16.
- If you want to specify a different network mask, in the Bridge/overlay subnets field, enter your value, select the Ok button, and press Enter.
The mask must match the template: x.x.0.0/16.
The Setup Wizard proceeds to the next step.
Page top
Step 7. Selecting the external network interface
The external network interface is used for SSH access to the server, managing the web interface of Kaspersky Anti Targeted Attack Platform, and other external connections.
To select the external network interface:
- Select the row containing the network interface that is used for the external network.
To select a row, you can use the ↑, ↓, PageUp, and PageDown keys. The selected row is highlighted in red.
- Press Enter.
The Setup Wizard proceeds to the next step.
Page top
Step 8. Selecting the method of obtaining IP addresses for network interfaces
To select a method for obtaining an IP address for network interfaces:
- Select the row containing the Configuration type: and press Enter.
To select a row, you can use the ↑, ↓, PageUp, and PageDown keys. The selected row is highlighted in red.
- In the opened window, select one of the following options:
- dhcp.
- static.
- If you selected static:
- Select the row containing the parameter and press the Enter key.
- In the opened window, enter the required data and press Enter twice.
You need to specify a value for each parameter.
- Select the row containing Save.
- Press Enter.
The Setup Wizard proceeds to the next step.
Page top
Step 9. Creating the administrator account
The administrator account is used for managing the web interface of the application, the administrator menu of the application, and for managing the application in Technical Support Mode.
By default, the user name of the administrator account is admin. You must enter a password for that user account.
To enter a password for the administrator user account:
- This opens a window; in that window, in the min length field, enter the minimum password length. You must enter a value of 8 or greater.
- Select Ok and press Enter.
This opens the password creation window.
- This opens a window; in that window, in the password field, enter the password for the administrator account.
To select a row, you can use the ↑, ↓, PageUp, and PageDown keys. The selected row is highlighted in red.
- In the confirm field, enter the password again.
- Select Ok and press Enter.
The Setup Wizard proceeds to the next step.
Page top
Step 10. Selecting the localization language for the NDR functionality
The selected language is used to display the parts of the application that have to do with the NDR functionality.
To select the localization language for the NDR functionality:
Select it in the list and press Enter.
Page top
Step 11. Adding DNS server addresses
Configure the DNS settings for the operation of servers with application components.
To add DNS server addresses:
- Select the Add field and press Enter.
- Enter the IP address of the DNS server in the IPv4 format.
- If you want to add the IP address of an additional DNS server, select the Add field, press Enter and enter the address of the server.
- Having added all DNS servers, select the Continue field and press Enter.
The Setup Wizard proceeds to the next step.
Page top
Step 12. Configuring time synchronization with an NTP server
Configure synchronization of the server time with the NTP server.
- Select the Add field and press Enter.
- Enter the IP address or name of the NTP server.
- If you want to add the IP address or name of an additional NTP server, select the Add field, press Enter, and enter the IP address or name of the NTP server.
- Having added all NTP servers, select the Continue field and press Enter.
The Setup Wizard proceeds to the next step.
Page top
Step 13. Configuring receipt of mirrored traffic from SPAN ports
To turn on receipt of mirrored traffic from SPAN ports:
- This opens a window, in that window, select Yes and press Enter.
- In the displayed list, select the network interfaces from which you want to capture network traffic.
- Select the line containing Apply and finish and press Enter.
The configuration may take some time. Then the installation is complete. For the application to work correctly, you must configure the server.
To turn off the receipt of mirrored traffic from SPAN ports:
In the opened window, select No and press Enter.
The configuration may take some time. Then the installation is complete. For the application to work correctly, you must configure the server.
Page top
Installing the Sensor component on a standalone server
To install the Sensor component on a physical server, you need to run a disk image with the Central Node and Sensor components.
To install the Sensor component on a virtual server, you need to connect the disk image with the Central Node and Sensor components to the selected virtual machine and run it. The installation starts immediately after the virtual machine is turned on. You can manage the installation process using the console of the virtual machine.
Step 1. Viewing the End User License Agreement and Privacy Policy
To continue the installation, you must read the End User License Agreement and Privacy Policy and accept their terms and conditions. Installation will not continue until you accept the terms of the End User License Agreement and Privacy Policy.
To accept the terms and conditions of the End User License Agreement and the Privacy Policy when installing the components based on the Ubuntu operating system:
- Select the language for viewing the AO Kaspersky Lab End User License Agreement and Privacy Policy in the list and press Enter.
This opens a window with the text of the AO Kaspersky Lab End User License Agreement.
- Read the AO Kaspersky Lab End User License Agreement.
To move up and down, you can use the keys: ↑, ↓, PageUp, and PageDown.
- If you accept the AO Kaspersky Lab End User License Agreement, select the I accept button and press Enter.
This opens a window with the text of the AO Kaspersky Lab Privacy Policy.
- Read the AO Kaspersky Lab Privacy Policy.
- If you accept the terms and conditions of the AO Kaspersky Lab Privacy Policy, select the I accept button and press Enter.
The Setup Wizard proceeds to the next step.
To accept the terms and conditions of the End User License Agreement and the Privacy Policy when installing the components based on the Astra Linux operating system:
- Select the language for viewing the End User License Agreement for Astra Linux operating systems from the list by pressing the F1 key and press Enter.
This opens a window with the text of the Astra Linux End User License Agreement.
- Read the End User License Agreement of the Astra Linux operating systems.
To move up and down, you can use the keys: ↑, ↓, PageUp, and PageDown.
- If you accept the terms and conditions of the End User License Agreement of Astra Linux operating systems, select Yes and press Enter.
This opens a window in which you can select the language for viewing the AO Kaspersky Lab End User License Agreement and Privacy Policy.
- Select the language for viewing the AO Kaspersky Lab End User License Agreement and Privacy Policy in the list and press Enter.
This opens a window with the text of the AO Kaspersky Lab End User License Agreement.
- Read the AO Kaspersky Lab End User License Agreement.
To move up and down, you can use the keys: ↑, ↓, PageUp, and PageDown.
- If you accept the terms and conditions of the AO Kaspersky Lab End User License Agreement, select the I accept button and press Enter.
This opens a window with the text of the AO Kaspersky Lab Privacy Policy.
- Read the AO Kaspersky Lab Privacy Policy.
- If you accept the terms and conditions of the AO Kaspersky Lab Privacy Policy, select the I accept button and press Enter.
The Setup Wizard proceeds to the next step.
Page top
Step 2. Selecting a server role
To select a server role:
- Select one of the following options:
- storage.
This role is for installing a storage server for deploying the Central Node component as a cluster.
- processing.
This role is for installing a processing server for deploying the Central Node component as a cluster.
The role also includes the installation and configuration of the Sensor component.
- single.
This role is for installing the Central Node and Sensor components on the same server.
- sensor.
This role is for installing the Sensor component on a standalone server.
- storage.
- Press Enter.
The Setup Wizard proceeds to the next step.
Page top
Step 3. Selecting a disk for installing the component
You need at least 150 GB of disk space. If less than 150 GB of disk space is available, installation finishes with an error.
To select a disk for installing the component:
- Select one of the suggested drives for installing the component and press Enter.
The confirmation window is displayed.
- Select Yes and press Enter.
The Setup Wizard proceeds to the next step.
Page top
Step 4. Selecting a network mask for server addressing
We recommend using the default value.
The netmask may not match netmasks used in the organization's infrastructure.
To specify the network mask for server addressing:
- If you want to use the predefined value for the network mask, select the Ok button and press Enter.
Default value: 198.18.0.0/16.
- If you want to specify a different network mask, in the Subnet field, enter your value, select the Ok button, and press Enter.
The mask must match the template: x.x.0.0/16.
The Setup Wizard proceeds to the next step.
Page top
Step 5. Selecting a network mask for addressing of application components
We recommend using the default value.
The network for application component addressing must not overlap with the network for server addressing.
To specify the network mask for addressing the main components of the application:
- If you want to use the predefined value for the network mask, select the Ok button and press Enter.
Default value: 198.19.0.0/16.
- If you want to specify a different network mask, in the Bridge/overlay subnets field, enter your value, select the Ok button, and press Enter.
The mask must match the template: x.x.0.0/16.
The Setup Wizard proceeds to the next step.
Page top
Step 6. Selecting the external network interface
The external network interface is used for SSH access to the server, managing the web interface of Kaspersky Anti Targeted Attack Platform, and other external connections.
To select the external network interface:
- Select the row containing the network interface that is used for the external network.
To select a row, you can use the ↑, ↓, PageUp, and PageDown keys. The selected row is highlighted in red.
- Press Enter.
The Setup Wizard proceeds to the next step.
Page top
Step 7. Selecting the method of obtaining IP addresses for network interfaces
To select a method for obtaining an IP address for network interfaces:
- Select the row containing the Configuration type: and press Enter.
To select a row, you can use the ↑, ↓, PageUp, and PageDown keys. The selected row is highlighted in red.
- In the opened window, select one of the following options:
- dhcp.
- static.
- If you selected static:
- Select the row containing the parameter and press the Enter key.
- In the opened window, enter the required data and press Enter twice.
You need to specify a value for each parameter.
- Select the row containing Save.
- Press Enter.
The Setup Wizard proceeds to the next step.
Page top
Step 8. Creating the administrator account
The administrator account is used for managing the web interface of the application, the administrator menu of the application, and for managing the application in Technical Support Mode.
By default, the user name of the administrator account is admin. You must enter a password for that user account.
To enter a password for the administrator user account:
- This opens a window; in that window, in the min length field, enter the minimum password length. You must enter a value of 8 or greater.
- Select Ok and press Enter.
This opens the password creation window.
- This opens a window; in that window, in the password field, enter the password for the administrator account.
To select a row, you can use the ↑, ↓, PageUp, and PageDown keys. The selected row is highlighted in red.
- In the confirm field, enter the password again.
- Select Ok and press Enter.
The Setup Wizard proceeds to the next step.
Page top
Step 9. Adding DNS server addresses
Configure the DNS settings for the operation of servers with application components.
To add DNS server addresses:
- Select the Add field and press Enter.
- Enter the IP address of the DNS server in the IPv4 format.
- If you want to add the IP address of an additional DNS server, select the Add field, press Enter and enter the address of the server.
- Having added all DNS servers, select the Continue field and press Enter.
The Setup Wizard proceeds to the next step.
Page top
Step 10. Configuring time synchronization with an NTP server
Configure synchronization of the server time with the NTP server.
- Select the Add field and press Enter.
- Enter the IP address or name of the NTP server.
- If you want to add the IP address or name of an additional NTP server, select the Add field, press Enter, and enter the IP address or name of the NTP server.
- Having added all NTP servers, select the Continue field and press Enter.
The Setup Wizard proceeds to the next step.
Page top
Step 11. Configuring receipt of mirrored traffic from SPAN ports
To turn on receipt of mirrored traffic from SPAN ports:
- In the displayed list, select the network interfaces from which you want to capture network traffic.
- Select the line containing Apply and finish and press Enter.
The configuration may take some time. Then the installation is complete.
Page top
Optimization of network interface settings for the Sensor component
Follow these instructions if the application encounters network packet loss or performance issues when processing network traffic.
To reduce network packet loss and incomplete extraction of files from traffic:
- Specify the maximum number of RSS queues:
- If the data transfer rate on your network is less than 1 Gbps, set the number to 1.
- If the data transfer rate on your network is greater than 1 Gbps, set the number to 16.
If your network interface does not allow setting the maximum number of RSS queues to 16, set it to the maximum supported number.
- Configure symmetric RSS hashing for the network interface. For details on configuring RSS hashing, refer to the vendor documentation of your network adapter.
- Create an interrupts.sh file with the following content.
- Run the following command:
sudo bash interrupts.sh <dev> <min_cpu> <max_cpu> <step>, where<dev>is the network interface whose interrupts you want to distribute among cores.<min_cpu>is the first core in the range for network adapter interrupt distribution.<max_cpu>is the last core in the range for network adapter interrupt distribution.<step>is the increment for picking the next core to assign to interrupts.Example:
sudo bash interrupts.sh ens192 2 11 1
- If you are using NVIDIA Mellanox network adapters (mlx4), configure the number of RSS queues and RSS hashing by running the following commands:
ethtool -L $dev rx 16ethtool -X $dev equal 16ethtool -X $dev hfunc xor - If you are using Intel network adapters (i40e), configure the number of RSS queues and RSS hashing:
rmmod i40e && modprobe i40eifconfig $dev downethtool -L $dev combined 16ethtool -K $dev rxhash onethtool -K $dev ntuple onifconfig $dev upethtool -X $dev hkey 6D:5A:6D:5A:6D:5A:6D:5A:6D:5A:6D:5A:6D:5A:6D:5A:6D:5A:6D:5A:6D:5A:6D:5A:6D:5A:6D:5A:6D:5A:6D:5A:6D:5A:6D:5A:6D:5A:6D:5A:6D:5A:6D:5A:6D:5A:6D:5A:6D:5A:6D:5A equal 16ethtool -A $dev rx offethtool -C $dev adaptive-rx off adaptive-tx off rx-usecs 125ethtool -G $dev rx 1024ethtool -N $dev rx-flow-hash tcp4 sdfnethtool -N $dev rx-flow-hash tcp6 sdfnethtool -N $dev rx-flow-hash udp4 sdfnethtool -N $dev rx-flow-hash udp6 sdfn
The network interfaces are configured.
After restarting the application, you must reconfigure the network interfaces following the instructions.
Page top
Connecting and configuring external storage for the Sensor component
Kaspersky Anti Targeted Attack Platform saves traffic received from network interfaces as network traffic dump files. If you want to ensure long-term storage of network traffic dump files, you can connect and configure external storage. You can use network traffic dump files in external storage to download network traffic as PCAP files. We recommend using SSD drives as external storage.
To connect and configure external storage for network traffic dump files on a server with the Sensor and Central Node components installed:
- Connect a disk of at least 100 GB that you want to use as external storage.
- Enter Technical Support Mode.
- Run the following commands:
sudo -ifdisk -lMake sure that the disk that you connected for external storage is displayed in the console.
- Run the following commands:
mke2fs -t ext4 -L DATA -m 0 /dev/<name of the connected disk>sudo nano etc/fstabThis opens the fstab file in a text editor.
- Add the following line at the end of the file:
/dev/<name of the connected disk> /data/volumes/dumps/ ext4 defaults 0 0 - Close the text editor.
- Run the following commands:
mountrm -r /data/volumes/dumps/*These commands delete all data from the connected disk.
The connected disk will be configured for use as external storage.
- Run the following commands:
chown kluser:klusers /data/volumes/dumps/ls -lah /data/volumes/dumps/lsblkMake sure that in the
- Run the following commands:
docker stop $(docker ps | grep preprocessor_span | awk '{print $1}')docker ps | grep preprocessor_spanWait until the
- Run the following commands:
docker exec -it $(docker ps | grep preprocessor_span | awk '{print $1}') bashlsblkMake sure that in the
- Select the Sensor servers section in the window of the application web interface.
- Click the card of the relevant Sensor component.
This opens a window with information about the component.
- Click Edit.
- Select the External storage tab and use the Connect external storage for traffic dump files switch to enable external storage mode.
- Set the space limit for storing the traffic dump files under Maximum size.
You can select the unit of measure for the space limit: MB or GB.
- If necessary, in the Filtering using BPF section, enable filtering and enter an expression for filtering using the BPF (Berkley Packet Filter) technology. The BPF filtering expression is written in the libpcap format. For more details about the syntax, please refer to the pcap-filter manual page.
- If necessary, in the Storage time limit section, enable a limit on the minimum storage time for the files and specify the relevant number of days.
- Click Save.
External storage for network traffic dump files on the server with Sensor and Central Node installed is connected and configured.
To connect and configure external storage for network traffic dump files on a standalone server with the Sensor component installed:
- Connect a disk of at least 100 GB that you want to use as external storage.
- Enter Technical Support Mode.
- Run the following commands:
sudo -ifdisk -lMake sure that the disk that you connected for external storage is displayed in the console.
- Run the following commands:
mke2fs -t ext4 -L DATA -m 0 /dev/<name of the connected disk>sudo nano etc/fstabThis opens the fstab file in a text editor.
- Add the following line at the end of the file:
/dev/<name of the connected disk> /data/volumes/dumps/ ext4 defaults 0 0 - Close the text editor.
- Run the following command:
rm -r /data/volumes/dumps/*These commands delete all data from the connected disk.
- Select the Sensor servers section in the window of the application web interface.
- Click the card of the relevant Sensor component.
This opens a window with information about the component.
- Click Edit.
- Select the External storage tab and use the Connect external storage for traffic dump files switch to enable external storage mode.
- Set the space limit for storing the traffic dump files under Maximum size.
You can select the unit of measure for the space limit: MB or GB.
- If necessary, in the Filtering using BPF section, enable filtering and enter an expression for filtering using the BPF (Berkley Packet Filter) technology. The BPF filtering expression is written in the libpcap format. For more details about the syntax, please refer to the pcap-filter manual page.
- If necessary, in the Storage time limit section, enable a limit on the minimum storage time for the files and specify the relevant number of days.
- Click Save.
External storage for network traffic dump files on the standalone server with the Sensor component installed is connected and configured.
Page top
Configuring the sizing settings of the application
If you are using the distributed solution and multitenancy mode, use the web interface of the PCN or SCN server for which you want to configure parameters.
You can change the operational load on the Central Node component. For example, you can connect additional hosts with the Endpoint Agent component or servers with the Sensor component to the Central Node component. To do this, you need to specify the planned volume of SPAN traffic, mail traffic, the number of hosts with the Endpoint Agent component, as well as the size of the Storage and event database. Kaspersky Anti Targeted Attack Platform will determine the optimal configuration of the Central Node server taking into account the specified settings.
If the Central Node component is deployed as a cluster, the application determines the optimal configuration of all servers in the cluster.
For the cluster to function, after configuring the sizing parameters, time must be synchronized on servers of the cluster. Before configuring sizing parameters, make sure that integration with a functioning NTP server is configured for at least one server in the cluster.
You can configure NTP server integration in the web interface of Kaspersky Anti Targeted Attack Platform or in the component administrator menu on any server in the cluster. If you have not previously configured NTP server integration, we recommend restarting the cluster servers after configuring it.
To configure the Central Node servers:
- In a browser on any computer on which access to the Central Node server has been allowed, enter the IP address of the server with the Central Node component into the browser's address bar.
If you are using the high availability version of the application, you can enter the IP address of any server of the Central Node cluster or the fully qualified domain name (FQDN) of the cluster.
An input window for account credentials of the Kaspersky Anti Targeted Attack Platform user opens.
- Enter the user name, "admin", and the password that was set during the installation of the application.
- Click Log in.
- Go to the Server configuration section.
- In the Number of Endpoint Agents field, specify the effective number of Endpoint Agent hosts for your infrastructure.
For details on how to calculate the effective number of Endpoint Agent hosts, see the scaling guide.
If you are not using a KEDR license key, specify 0.
- In the Mail traffic, messages per second field, specify the planned number of emails per second.
If you are not using a KATA license key, specify 0.
- In the SPAN traffic, Mbps field, specify the planned amount of traffic from SPAN ports on servers with the Sensor component.
If you are not using a KATA license key, specify 0.
- If you installed Central Node on a server, in the Disk space section, leave default values in the Events database, GB and Storage, GB fields.
- If you installed Central Node as a cluster, in the Available disk space section, specify the sizes of the event database and Storage in one of the following ways:
- Move the slider separating the Events database and Storage to the left or right.
Keep in mind that reducing the size of the event database or Storage irreversibly deletes the oldest data in accordance with the rotation rules. Enlarging the event database or Storage does not cause data loss.
- Specify the values in the Events database, GB and Storage, GB fields.
If the Central Node component is deployed as a high availability cluster, use the Sizing Guide to calculate the size of the events database.
- If necessary, you can leave free space on disk by moving the last slider on the right.
Disk space is automatically reserved for the alert database when the Central Node component is installed.
- Move the slider separating the Events database and Storage to the left or right.
- Click Configure.
If Central Node is installed on a server, Kaspersky Anti Targeted Attack Platform determines the optimal server configuration in accordance with the specified parameters. If Central Node is installed as a cluster, the application configures the servers of the cluster.
Page top
Configuring firewall rules
For the Kaspersky Anti Targeted Attack Platform application and its components to work correctly, you must configure firewall rules.
Network communication on computers with Kaspersky Anti Targeted Attack Platform components is managed by the iptables utility built into the operating system (Ubuntu, Astra Linux). The ports are described in iptables terms.
Ports used on computers with Kaspersky Anti Targeted Attack Platform components
The described rules apply to all types of hosts, regardless of configuration. The rules are applied via the kata-firewall systemd service, only for the INPUT and DOCKER-USER chains.
INPUT chain
This chain manages all connections to computers with Kaspersky Anti Targeted Attack Platform components.
Networking rules are listed in the table below.
Networking rules for the INPUT chain
Destination service or protocol |
Port |
Protocol |
sport |
dport |
Access from external network |
|---|---|---|---|---|---|
SSH |
22 |
TCP |
|
|
|
SMTP |
25 |
TCP |
|
|
|
DNS |
53 |
TCP |
|
|
|
HTTP |
80 |
TCP |
|
|
|
SNMPD |
161 |
UDP |
|
|
|
HTTPS |
443 |
TCP |
|
|
|
preprocessor_icap |
1334 |
TCP |
|
|
|
docker swarm |
2377 |
TCP |
|
|
|
etcd |
2379 |
TCP |
|
|
|
etcd |
2380 |
TCP |
|
|
|
ceph_mon |
3300 |
TCP |
|
|
|
VXLAN |
4789 |
TCP/UDP |
|
|
|
ceph_mon |
6789 |
TCP |
|
|
|
сeph OSD |
6800:6900 |
TCP |
|
|
|
docker swarm |
7946 |
TCP/UDP |
|
|
|
ipsec_manager |
8084 |
TCP |
|
|
|
pcap_manager |
8085 |
TCP |
|
|
|
HTTPS |
8443 |
TCP/UDP |
|
|
|
HTTPS |
8444 |
TCP/UDP |
|
|
|
kafka_proxy |
9080 |
TCP |
|
|
|
suricata_metrics_exporter |
9103 |
TCP |
|
|
|
node_exporter |
9141 |
TCP |
|
|
|
cadvisor |
9142 |
TCP |
|
|
|
preprocessor_metrics_exporter |
9191 |
TCP |
|
|
|
pcap_manager_metrics_exporter |
9192 |
TCP |
|
|
|
ceph_mgr |
9283 |
TCP |
|
|
|
ceph_rgw |
9284 |
TCP |
|
|
|
NDR sensor |
9443 |
TCP |
|
|
|
kafka bootstrap |
11000:11006 |
TCP |
|
|
|
KICKS EKA |
13520 |
TCP |
|
|
|
DOCKER-USER chain
This chain manages network connections for addressing of application components. Networking rules are listed in the table below.
Networking rules for the DOCKER-USER chain
Destination service or protocol |
Port |
Protocol |
sport |
dport |
|---|---|---|---|---|
SMTP |
25 |
TCP |
|
|
DNS |
53 |
TCP/UDP |
|
|
HTTP |
80 |
TCP |
|
|
HTTPS |
443 |
TCP |
|
|
preprocessor_icap |
1344 |
UDP |
|
|
NDR NATS (KICKS NAT) |
7423 |
TCP |
|
|
NDR public API |
8070 |
TCP |
|
|
deployment API |
8080 |
TCP |
|
|
deployment management API |
8090 |
TCP |
|
|
authorization service |
8091 |
TCP |
|
|
HTTPS |
8443 |
TCP |
|
|
apt collector ssl |
9081 |
TCP |
|
|
Sensor |
9443 |
TCP |
|
|
NDR EKA |
13520 |
TCP |
|
|
Ports used by Kaspersky Anti Targeted Attack Platform services in a cluster configuration
For the application to work correctly in a cluster configuration, you must configure network access for our outgoing connections in accordance with the table below.
Ports used by Kaspersky Anti Targeted Attack Platform services in a cluster configuration
Service |
Port |
Protocol |
|---|---|---|
agent_database_configurator |
2379 |
TCP |
agent_database_configurator |
5432 |
TCP |
agent_database_synchronizer |
2379 |
TCP |
agent_database_synchronizer |
5432 |
TCP |
agent_database_synchronizer |
9092 |
TCP |
agent_database_synchronizer |
9100 |
TCP |
agent_database_synchronizer |
10000:10010 |
TCP |
agent_server |
1080 |
TCP |
agent_server |
2379 |
TCP |
agent_server |
5432 |
TCP |
agent_server |
8100 |
TCP |
agent_server |
9090 |
TCP |
agent_server |
9284 |
TCP |
antiapt_database_configurator |
2379 |
TCP |
antiapt_database_configurator |
5432 |
TCP |
authorization_service |
2379 |
TCP |
authorization_service |
4567 |
TCP |
authorization_service |
8090 |
TCP |
authorization_service |
8443 |
TCP |
authorization_service |
8701 |
TCP |
authorization_service |
8899 |
TCP |
cadvisor |
Any |
Any |
ceph_management_api |
2379 |
TCP |
ceph_management_api |
3300 |
TCP |
ceph_management_api |
6789 |
TCP |
ceph_management_api |
8765 |
TCP |
ceph_management_api |
8080 |
TCP |
ceph_management_api |
9283 |
TCP |
ceph_management_api |
9284 |
TCP |
ceph_mgr |
2379 |
TCP |
ceph_mgr |
3300 |
TCP |
ceph_mgr |
6789 |
TCP |
ceph_mgr |
6800:6900 |
TCP |
ceph_mgr |
9141 |
TCP |
ceph_mgr |
9142 |
TCP |
ceph_mgr |
9283 |
TCP |
ceph_mgr |
9284 |
TCP |
ceph_mon |
2379 |
TCP |
ceph_mon |
3300 |
TCP |
ceph_mon |
6789 |
TCP |
ceph_mon |
6800:6900 |
TCP |
ceph_mon |
9141 |
TCP |
ceph_mon |
9142 |
TCP |
ceph_mon |
9283 |
TCP |
ceph_mon |
9284 |
TCP |
ceph_osd |
2379 |
TCP |
ceph_osd |
3300 |
TCP |
ceph_osd |
6789 |
TCP |
ceph_osd |
6800:6900 |
TCP |
ceph_osd |
9141 |
TCP |
ceph_osd |
9142 |
TCP |
ceph_osd |
9283 |
TCP |
ceph_osd |
9284 |
TCP |
ceph_rgw |
2379 |
TCP |
ceph_rgw |
3300 |
TCP |
ceph_rgw |
6789 |
TCP |
ceph_rgw |
6800:6900 |
TCP |
ceph_rgw |
9141 |
TCP |
ceph_rgw |
9142 |
TCP |
ceph_rgw |
9283 |
TCP |
ceph_rgw |
9284 |
TCP |
ceph_rgw_configurator |
2379 |
TCP |
ceph_rgw_configurator |
3300 |
TCP |
ceph_rgw_configurator |
6789 |
TCP |
ceph_rgw_configurator |
6800:6900 |
TCP |
ceph_rgw_configurator |
9141 |
TCP |
ceph_rgw_configurator |
9142 |
TCP |
ceph_rgw_configurator |
9283 |
TCP |
ceph_rgw_configurator |
9284 |
TCP |
clickhouse |
2379 |
TCP |
clickhouse |
8123 |
TCP |
clickhouse |
9000 |
TCP |
clickhouse_database_configurator |
2379 |
TCP |
clickhouse_database_configurator |
9000 |
TCP |
clickhouse_metrics_importer |
2379 |
TCP |
clickhouse_metrics_importer |
6379 |
TCP |
clickhouse_metrics_importer |
8123 |
TCP |
clickhouse_metrics_importer |
9000 |
TCP |
clickhouse_metrics_importer |
9090 |
TCP |
coredns |
53 |
TCP |
coredns |
53 |
TCP |
coredns |
2379 |
TCP |
deployment_api |
22 |
TCP |
deployment_api |
2377 |
TCP |
deployment_api |
2379 |
TCP |
deployment_api |
4567 |
TCP |
deployment_api |
8080 |
TCP |
deployment_api |
8443 |
TCP |
deployment_api |
8701 |
TCP |
deployment_api |
9141 |
TCP |
deployment_api |
9284 |
TCP |
deployment_management_api |
53 |
TCP |
deployment_management_api |
2379 |
TCP |
deployment_management_api |
4567 |
TCP |
deployment_management_api |
8091 |
TCP |
deployment_management_api |
8443 |
TCP |
deployment_management_api |
8701 |
TCP |
deployment_management_api |
8702 |
TCP |
deployment_management_api |
8765 |
TCP |
deployment_management_api |
8899 |
TCP |
deployment_management_api |
9141 |
TCP |
dhcp_server |
Any |
Any |
edr_synchronizer |
25 |
TCP |
edr_synchronizer |
80 |
TCP |
edr_synchronizer |
514 |
TCP |
edr_synchronizer |
514 |
UDP |
edr_synchronizer |
2379 |
TCP |
edr_synchronizer |
5432 |
TCP |
edr_synchronizer |
6379 |
TCP |
edr_synchronizer |
8081 |
TCP |
edr_synchronizer |
8082 |
TCP |
edr_synchronizer |
8083 |
TCP |
edr_synchronizer |
9092 |
TCP |
edr_synchronizer |
10000:10010 |
TCP |
edr_synchronizer |
33334 |
TCP |
elasticsearch |
2379 |
TCP |
elasticsearch |
9200 |
TCP |
elasticsearch |
9300 |
TCP |
elasticsearch_data |
2379 |
TCP |
elasticsearch_data |
9200 |
TCP |
elasticsearch_data |
9300 |
TCP |
elasticsearch_exporter |
2379 |
TCP |
elasticsearch_exporter |
9200 |
TCP |
elasticsearch_exporter |
9300 |
TCP |
etcd |
2379 |
TCP |
etcd |
2380 |
TCP |
events_api |
80 |
TCP |
events_api |
2379 |
TCP |
events_api |
5432 |
TCP |
events_api |
8080 |
TCP |
events_api |
8081 |
TCP |
events_api |
9092 |
TCP |
events_api |
9100 |
TCP |
events_api |
9284 |
TCP |
events_api |
10000:10010 |
TCP |
fastsearch |
2379 |
TCP |
fastsearch |
8080 |
TCP |
fastsearch |
8180 |
TCP |
fastsearch_events_cleaner |
9200 |
TCP |
fastsearch_events_importer |
2379 |
TCP |
fastsearch_events_importer |
8081 |
TCP |
fastsearch_events_importer |
9092 |
TCP |
fastsearch_events_importer |
9100 |
TCP |
fastsearch_events_importer |
9200 |
TCP |
fastsearch_events_importer |
10000:10010 |
TCP |
hunts_database_configurator |
2379 |
TCP |
hunts_database_configurator |
5432 |
TCP |
hunts_database_synchronizer |
2379 |
TCP |
hunts_database_synchronizer |
5432 |
TCP |
hunts_database_synchronizer |
9092 |
TCP |
hunts_database_synchronizer |
10000:10010 |
TCP |
hunts_event_processor |
2379 |
TCP |
hunts_event_processor |
5432 |
TCP |
hunts_event_processor |
8080 |
TCP |
hunts_event_processor |
8081 |
TCP |
hunts_event_processor |
9092 |
TCP |
hunts_event_processor |
9100 |
TCP |
hunts_event_processor |
10000:10010 |
TCP |
hunts_statistics_api |
2379 |
TCP |
hunts_statistics_api |
5432 |
TCP |
hunts_statistics_api |
8080 |
TCP |
hunts_statistics_api |
8081 |
TCP |
hunts_statistics_api |
9092 |
TCP |
hunts_statistics_api |
9100 |
TCP |
hunts_statistics_api |
10000:10010 |
TCP |
hunts_statistics_processor |
2379 |
TCP |
hunts_statistics_processor |
5432 |
TCP |
hunts_statistics_processor |
8080 |
TCP |
hunts_statistics_processor |
8081 |
TCP |
hunts_statistics_processor |
9092 |
TCP |
hunts_statistics_processor |
9100 |
TCP |
hunts_statistics_processor |
9200 |
TCP |
hunts_statistics_processor |
10000:10010 |
TCP |
edr_synchronizer |
25 |
TCP |
edr_synchronizer |
80 |
TCP |
ids_alert_syncer |
514 |
UDP |
ids_alert_syncer |
2379 |
TCP |
ids_alert_syncer |
5432 |
TCP |
ids_alert_syncer |
777 |
TCP |
ids_alert_syncer |
8083 |
TCP |
ids_alert_syncer |
9092 |
TCP |
ids_alert_syncer |
9200 |
TCP |
ids_alert_syncer |
10000:10010 |
TCP |
ids_alert_syncer |
33334 |
TCP |
ioa_update_validator |
2379 |
TCP |
ipsec_manager |
80 |
TCP |
ipsec_manager |
2379 |
TCP |
kafka |
2379 |
TCP |
kafka |
2181 |
TCP |
kafka |
9092 |
TCP |
kafka |
9095 |
TCP |
kafka |
10000:10010 |
TCP |
kafka_configurator |
2181 |
TCP |
kafka_configurator |
2379 |
TCP |
kafka_configurator |
9092 |
TCP |
kafka_configurator |
10000:10010 |
TCP |
kafka_exporter |
2379 |
TCP |
kafka_exporter |
9092 |
TCP |
kafka_exporter |
9100 |
TCP |
kafka_exporter |
10000:10010 |
TCP |
kafka_proxy |
Any |
Any |
kata_scanner |
25 |
TCP |
kata_scanner |
80 |
TCP |
kata_scanner |
514 |
TCP |
kata_scanner |
514 |
UDP |
kata_scanner |
443 |
TCP |
kata_scanner |
2379 |
TCP |
kata_scanner |
5432 |
TCP |
kata_scanner |
6379 |
TCP |
kata_scanner |
7777 |
TCP |
kata_scanner |
8081 |
TCP |
kata_scanner |
8082 |
TCP |
kata_scanner |
8083 |
TCP |
kata_scanner |
9081 |
TCP |
kata_scanner |
9090 |
TCP |
kata_scanner |
9092 |
TCP |
kata_scanner |
9100 |
TCP |
kata_scanner |
9284 |
TCP |
kata_scanner |
10000:10010 |
TCP |
kata_scanner |
33334 |
TCP |
ksb_agent_server |
80 |
TCP |
ksb_agent_server |
2379 |
TCP |
ksb_agent_server |
5432 |
TCP |
ksb_agent_server |
8082 |
TCP |
ksb_agent_server |
8083 |
TCP |
ksb_agent_server |
9898 |
TCP |
ksn_proxy |
80 |
TCP |
ksn_proxy |
443 |
TCP |
ksn_proxy |
514 |
TCP |
ksn_proxy |
514 |
UDP |
ksn_proxy |
2379 |
TCP |
ksn_proxy |
7777 |
TCP |
ksn_proxy |
8083 |
TCP |
ksn_proxy |
9092 |
TCP |
ksn_proxy |
9102 |
TCP |
ksn_proxy |
10000:10010 |
TCP |
ksn_proxy |
1:65535 |
TCP |
ksqldb_configurator |
2379 |
TCP |
ksqldb_configurator |
5432 |
TCP |
ksqldb_configurator |
8083 |
TCP |
ksqldb_configurator |
8088 |
TCP |
ksqldb_configurator |
9092 |
TCP |
ksqldb_configurator |
10000:10010 |
TCP |
ksqldb_server |
2379 |
TCP |
ksqldb_server |
5432 |
TCP |
ksqldb_server |
9092 |
TCP |
ksqldb_server |
11000:11006 |
TCP |
management_ui |
2379 |
TCP |
management_ui |
8091 |
TCP |
monitoring_grafana |
3000 |
TCP |
monitoring_prometheus |
2379 |
TCP |
monitoring_prometheus |
9090 |
TCP |
monitoring_prometheus |
9100 |
TCP |
monitoring_prometheus |
9102 |
TCP |
monitoring_prometheus |
9141 |
TCP |
monitoring_prometheus |
9142 |
TCP |
monitoring_prometheus |
9191 |
TCP |
monitoring_prometheus |
9192 |
TCP |
monitoring_prometheus |
9283 |
TCP |
multitenancy_management_api |
2379 |
TCP |
multitenancy_management_api |
4567 |
TCP |
multitenancy_management_api |
8443 |
TCP |
multitenancy_management_api |
8701 |
TCP |
multitenancy_management_api |
8090 |
TCP |
multitenancy_management_api |
8899 |
TCP |
nginx_exporter |
2379 |
TCP |
nginx_gateway |
80 |
TCP |
nginx_gateway |
81 |
TCP |
nginx_gateway |
443 |
TCP |
nginx_gateway |
2379 |
TCP |
nginx_gateway |
4443 |
TCP |
nginx_gateway |
4567 |
TCP |
nginx_gateway |
6379 |
TCP |
nginx_gateway |
8080 |
TCP |
nginx_gateway |
8081 |
TCP |
nginx_gateway |
8082 |
TCP |
nginx_gateway |
8083 |
TCP |
nginx_gateway |
8085 |
TCP |
nginx_gateway |
8090 |
TCP |
nginx_gateway |
8100 |
TCP |
nginx_gateway |
8443 |
TCP |
nginx_gateway |
8444 |
TCP |
nginx_gateway |
8701 |
TCP |
nginx_gateway |
8702 |
TCP |
nginx_gateway |
8899 |
TCP |
nginx_gateway |
9393 |
TCP |
nginx_gateway |
9898 |
TCP |
node_exporter |
Any |
Any |
nta_core |
25 |
TCP |
nta_core |
80 |
TCP |
nta_core |
2379 |
TCP |
nta_core |
5433 |
TCP |
nta_core |
8082 |
TCP |
nta_core |
8083 |
TCP |
nta_core |
9443 |
TCP |
nta_database |
- |
- |
nta_database_configurator |
2379 |
TCP |
nta_database_configurator |
5432 |
TCP |
nta_database_configurator |
5432 |
TCP |
nta_sensor_configurator |
2379 |
TCP |
nta_sensor_configurator |
8084 |
TCP |
nta_sensor_configurator |
9443 |
TCP |
nta_sensor_configurator |
50051 |
TCP |
nta_syncer |
80 |
TCP |
nta_syncer |
2379 |
TCP |
nta_syncer |
5422 |
TCP |
nta_syncer |
5423 |
TCP |
nta_syncer |
7777 |
TCP |
nta_syncer |
8084 |
TCP |
nta_syncer |
9092 |
TCP |
nta_syncer |
10000:10010 |
TCP |
nta_syncer |
50051 |
TCP |
postfix |
25 |
TCP |
postfix |
2379 |
TCP |
postgresql_exporter |
2379 |
TCP |
postgresql_exporter |
5432 |
TCP |
postgresql_exporter |
9100 |
TCP |
postgresql_server |
2379 |
TCP |
postgresql_server |
5432 |
TCP |
preprocessor |
Any |
Any |
preprocessor_icap |
80 |
TCP |
preprocessor_icap |
1514 |
TCP |
preprocessor_icap |
1514 |
UDP |
preprocessor_icap |
2379 |
TCP |
preprocessor_icap |
4223 |
TCP |
preprocessor_icap |
6379 |
TCP |
preprocessor_icap |
7777 |
TCP |
preprocessor_icap |
8081 |
TCP |
preprocessor_icap |
8082 |
TCP |
preprocessor_icap |
8083 |
TCP |
preprocessor_icap |
9092 |
TCP |
preprocessor_icap |
9192 |
TCP |
preprocessor_icap |
9284 |
TCP |
preprocessor_icap |
10000:10010 |
TCP |
preprocessor_pop |
110 |
TCP |
preprocessor_pop |
514 |
TCP |
preprocessor_pop |
514 |
UDP |
preprocessor_pop |
2379 |
TCP |
preprocessor_pop |
4223 |
TCP |
preprocessor_pop |
6379 |
TCP |
preprocessor_pop |
7777 |
TCP |
preprocessor_pop |
8081 |
TCP |
preprocessor_pop |
8082 |
TCP |
preprocessor_pop |
8083 |
TCP |
preprocessor_pop |
9081 |
TCP |
preprocessor_pop |
9092 |
TCP |
preprocessor_pop |
10000:10010 |
TCP |
preprocessor_pop |
1:65535 |
TCP |
preprocessor_smtp |
514 |
TCP |
preprocessor_smtp |
514 |
UDP |
preprocessor_smtp |
2379 |
TCP |
preprocessor_smtp |
4223 |
TCP |
preprocessor_smtp |
6379 |
TCP |
preprocessor_smtp |
7777 |
TCP |
preprocessor_smtp |
8081 |
TCP |
preprocessor_smtp |
8082 |
TCP |
preprocessor_smtp |
8083 |
TCP |
preprocessor_smtp |
9081 |
TCP |
preprocessor_smtp |
9092 |
TCP |
preprocessor_smtp |
10000:10010 |
TCP |
preprocessor_span |
Any |
Any |
primary_database_configurator |
2379 |
TCP |
primary_database_configurator |
5432 |
TCP |
redis |
2379 |
TCP |
redis |
6379 |
TCP |
response_actions_processor |
514 |
TCP |
response_actions_processor |
514 |
UDP |
response_actions_processor |
2379 |
TCP |
response_actions_processor |
5432 |
TCP |
response_actions_processor |
8081 |
TCP |
response_actions_processor |
9092 |
TCP |
response_actions_processor |
9100 |
TCP |
response_actions_processor |
10000:10010 |
TCP |
response_api |
514 |
TCP |
response_api |
514 |
UDP |
response_api |
2379 |
TCP |
response_api |
5432 |
TCP |
response_api |
8080 |
TCP |
response_api |
9092 |
TCP |
response_api |
9100 |
TCP |
response_api |
10000:10010 |
TCP |
s3rotator |
80 |
TCP |
s3rotator |
1080 |
TCP |
s3rotator |
2379 |
TCP |
s3rotator |
9283 |
TCP |
s3rotator |
9284 |
TCP |
schema_registry |
2379 |
TCP |
schema_registry |
8081 |
TCP |
schema_registry |
9092 |
TCP |
schema_registry |
10000:10010 |
TCP |
sensor_event_processor |
2379 |
TCP |
sensor_event_processor |
8080 |
TCP |
sensor_event_processor |
8081 |
TCP |
sensor_event_processor |
9092 |
TCP |
sensor_event_processor |
9100 |
TCP |
sensor_event_processor |
10000:10010 |
TCP |
services_configurator |
2379 |
TCP |
siem_proxy |
80 |
TCP |
siem_proxy |
514 |
TCP |
siem_proxy |
514 |
UDP |
siem_proxy |
1080 |
TCP |
siem_proxy |
1514 |
TCP |
siem_proxy |
1514 |
UDP |
siem_proxy |
2080 |
TCP |
siem_proxy |
2379 |
TCP |
siem_proxy |
9284 |
TCP |
siem_proxy |
Any |
Any |
snmpd |
161 |
TCP |
snmpd |
2379 |
TCP |
updater |
80 |
TCP |
updater |
443 |
TCP |
updater |
514 |
TCP |
updater |
514 |
TCP |
updater |
2379 |
TCP |
updater |
5432 |
TCP |
updater |
6379 |
TCP |
updater |
7777 |
TCP |
updater |
8083 |
TCP |
updater |
9100 |
TCP |
updater |
9500 |
TCP |
updater |
1:65535 |
TCP |
updates_consistency_checker |
80 |
TCP |
updates_consistency_checker |
2379 |
TCP |
updates_consistency_checker |
6379 |
TCP |
updates_consistency_checker |
8083 |
TCP |
updates_consistency_checker |
9092 |
TCP |
updates_consistency_checker |
10000:10010 |
TCP |
web_backend |
25 |
TCP |
web_backend |
80 |
TCP |
web_backend |
443 |
TCP |
web_backend |
514 |
TCP |
web_backend |
514 |
UDP |
web_backend |
1080 |
TCP |
web_backend |
2379 |
TCP |
web_backend |
5432 |
TCP |
web_backend |
6379 |
TCP |
web_backend |
7777 |
TCP |
web_backend |
8080 |
TCP |
web_backend |
8081 |
TCP |
web_backend |
8082 |
TCP |
web_backend |
8083 |
TCP |
web_backend |
8085 |
TCP |
web_backend |
8090 |
TCP |
web_backend |
8123 |
TCP |
web_backend |
8283 |
TCP |
web_backend |
8443 |
TCP |
web_backend |
8444 |
TCP |
web_backend |
8899 |
TCP |
web_backend |
9090 |
TCP |
web_backend |
9092 |
TCP |
web_backend |
9284 |
TCP |
web_backend |
9500 |
TCP |
web_backend |
10000:10010 |
TCP |
web_backend |
33334 |
TCP |
zookeeper |
2181 |
TCP |
zookeeper |
2379 |
TCP |
zookeeper |
2888 |
TCP |
zookeeper |
3888 |
TCP |
zookeeper |
9092 |
TCP |
zookeeper |
10000:10010 |
TCP |
Ports used by services of a Central Node deployed as a server
For the application to work correctly with the Central Node component deployed as a server, you must configure network access for outgoing connections in accordance with the table below.
Ports used by services in a configuration with the Central Node component deployed as a server
Service |
Port |
Protocol |
|---|---|---|
agent_database_configurator |
2379 |
TCP |
agent_database_configurator |
5432 |
TCP |
agent_database_synchronizer |
2379 |
TCP |
agent_database_synchronizer |
5432 |
TCP |
agent_database_synchronizer |
9092 |
TCP |
agent_database_synchronizer |
9100 |
TCP |
agent_database_synchronizer |
10000:10010 |
TCP |
agent_server |
1080 |
TCP |
agent_server |
2379 |
TCP |
agent_server |
5432 |
TCP |
agent_server |
8100 |
TCP |
agent_server |
9090 |
TCP |
agent_server |
9284 |
TCP |
antiapt_database_configurator |
2379 |
TCP |
antiapt_database_configurator |
5432 |
TCP |
authorization_service |
2379 |
TCP |
authorization_service |
4567 |
TCP |
authorization_service |
8090 |
TCP |
authorization_service |
8443 |
TCP |
authorization_service |
8701 |
TCP |
authorization_service |
8899 |
TCP |
cadvisor |
Any |
Any |
clickhouse |
2379 |
TCP |
clickhouse |
8123 |
TCP |
clickhouse |
9000 |
TCP |
clickhouse_database_configurator |
2379 |
TCP |
clickhouse_database_configurator |
9000 |
TCP |
clickhouse_metrics_importer |
2379 |
TCP |
clickhouse_metrics_importer |
6379 |
TCP |
clickhouse_metrics_importer |
8123 |
TCP |
clickhouse_metrics_importer |
9000 |
TCP |
clickhouse_metrics_importer |
9090 |
TCP |
coredns |
53 |
TCP |
coredns |
53 |
TCP |
coredns |
2379 |
TCP |
deployment_api |
22 |
TCP |
deployment_api |
2377 |
TCP |
deployment_api |
2379 |
TCP |
deployment_api |
4567 |
TCP |
deployment_api |
8080 |
TCP |
deployment_api |
8443 |
TCP |
deployment_api |
8701 |
TCP |
deployment_api |
9141 |
TCP |
deployment_api |
9284 |
TCP |
deployment_management_api |
53 |
TCP |
deployment_management_api |
2379 |
TCP |
deployment_management_api |
4567 |
TCP |
deployment_management_api |
8091 |
TCP |
deployment_management_api |
8443 |
TCP |
deployment_management_api |
8701 |
TCP |
deployment_management_api |
8702 |
TCP |
deployment_management_api |
8765 |
TCP |
deployment_management_api |
8899 |
TCP |
deployment_management_api |
9141 |
TCP |
dhcp_server |
Any |
Any |
edr_synchronizer |
25 |
TCP |
edr_synchronizer |
80 |
TCP |
edr_synchronizer |
514 |
TCP |
edr_synchronizer |
514 |
UDP |
edr_synchronizer |
2379 |
TCP |
edr_synchronizer |
5432 |
TCP |
edr_synchronizer |
6379 |
TCP |
edr_synchronizer |
8081 |
TCP |
edr_synchronizer |
8082 |
TCP |
edr_synchronizer |
8083 |
TCP |
edr_synchronizer |
9092 |
TCP |
edr_synchronizer |
10000:10010 |
TCP |
edr_synchronizer |
33334 |
TCP |
elasticsearch |
2379 |
TCP |
elasticsearch |
9200 |
TCP |
elasticsearch |
9300 |
TCP |
elasticsearch_data |
2379 |
TCP |
elasticsearch_data |
9200 |
TCP |
elasticsearch_data |
9300 |
TCP |
elasticsearch_exporter |
2379 |
TCP |
elasticsearch_exporter |
9200 |
TCP |
elasticsearch_exporter |
9300 |
TCP |
etcd |
2379 |
TCP |
etcd |
2380 |
TCP |
events_api |
80 |
TCP |
events_api |
2379 |
TCP |
events_api |
5432 |
TCP |
events_api |
8080 |
TCP |
events_api |
8081 |
TCP |
events_api |
9092 |
TCP |
events_api |
9100 |
TCP |
events_api |
9284 |
TCP |
events_api |
10000:10010 |
TCP |
fastsearch |
2379 |
TCP |
fastsearch |
8080 |
TCP |
fastsearch |
8180 |
TCP |
fastsearch_events_cleaner |
9200 |
TCP |
fastsearch_events_importer |
2379 |
TCP |
fastsearch_events_importer |
8081 |
TCP |
fastsearch_events_importer |
9092 |
TCP |
fastsearch_events_importer |
9100 |
TCP |
fastsearch_events_importer |
9200 |
TCP |
fastsearch_events_importer |
10000:10010 |
TCP |
hunts_database_configurator |
2379 |
TCP |
hunts_database_configurator |
5432 |
TCP |
hunts_database_synchronizer |
2379 |
TCP |
hunts_database_synchronizer |
5432 |
TCP |
hunts_database_synchronizer |
9092 |
TCP |
hunts_database_synchronizer |
10000:10010 |
TCP |
hunts_event_processor |
2379 |
TCP |
hunts_event_processor |
5432 |
TCP |
hunts_event_processor |
8080 |
TCP |
hunts_event_processor |
8081 |
TCP |
hunts_event_processor |
9092 |
TCP |
hunts_event_processor |
9100 |
TCP |
hunts_event_processor |
10000:10010 |
TCP |
hunts_statistics_api |
2379 |
TCP |
hunts_statistics_api |
5432 |
TCP |
hunts_statistics_api |
8080 |
TCP |
hunts_statistics_api |
8081 |
TCP |
hunts_statistics_api |
9092 |
TCP |
hunts_statistics_api |
9100 |
TCP |
hunts_statistics_api |
10000:10010 |
TCP |
hunts_statistics_processor |
2379 |
TCP |
hunts_statistics_processor |
5432 |
TCP |
hunts_statistics_processor |
8080 |
TCP |
hunts_statistics_processor |
8081 |
TCP |
hunts_statistics_processor |
9092 |
TCP |
hunts_statistics_processor |
9100 |
TCP |
hunts_statistics_processor |
9200 |
TCP |
hunts_statistics_processor |
10000:10010 |
TCP |
edr_synchronizer |
25 |
TCP |
edr_synchronizer |
80 |
TCP |
ids_alert_syncer |
514 |
UDP |
ids_alert_syncer |
2379 |
TCP |
ids_alert_syncer |
5432 |
TCP |
ids_alert_syncer |
777 |
TCP |
ids_alert_syncer |
8083 |
TCP |
ids_alert_syncer |
9092 |
TCP |
ids_alert_syncer |
9200 |
TCP |
ids_alert_syncer |
10000:10010 |
TCP |
ids_alert_syncer |
33334 |
TCP |
ioa_update_validator |
2379 |
TCP |
ipsec_manager |
80 |
TCP |
ipsec_manager |
2379 |
TCP |
kafka |
2379 |
TCP |
kafka |
2181 |
TCP |
kafka |
9092 |
TCP |
kafka |
9095 |
TCP |
kafka |
10000:10010 |
TCP |
kafka_configurator |
2181 |
TCP |
kafka_configurator |
2379 |
TCP |
kafka_configurator |
9092 |
TCP |
kafka_configurator |
10000:10010 |
TCP |
kafka_exporter |
2379 |
TCP |
kafka_exporter |
9092 |
TCP |
kafka_exporter |
9100 |
TCP |
kafka_exporter |
10000:10010 |
TCP |
kafka_proxy |
Any |
Any |
kata_scanner |
25 |
TCP |
kata_scanner |
80 |
TCP |
kata_scanner |
514 |
TCP |
kata_scanner |
514 |
UDP |
kata_scanner |
443 |
TCP |
kata_scanner |
2379 |
TCP |
kata_scanner |
5432 |
TCP |
kata_scanner |
6379 |
TCP |
kata_scanner |
7777 |
TCP |
kata_scanner |
8081 |
TCP |
kata_scanner |
8082 |
TCP |
kata_scanner |
8083 |
TCP |
kata_scanner |
9081 |
TCP |
kata_scanner |
9090 |
TCP |
kata_scanner |
9092 |
TCP |
kata_scanner |
9100 |
TCP |
kata_scanner |
9284 |
TCP |
kata_scanner |
10000:10010 |
TCP |
kata_scanner |
33334 |
TCP |
ksb_agent_server |
80 |
TCP |
ksb_agent_server |
2379 |
TCP |
ksb_agent_server |
5432 |
TCP |
ksb_agent_server |
8082 |
TCP |
ksb_agent_server |
8083 |
TCP |
ksb_agent_server |
9898 |
TCP |
ksn_proxy |
80 |
TCP |
ksn_proxy |
443 |
TCP |
ksn_proxy |
514 |
TCP |
ksn_proxy |
514 |
UDP |
ksn_proxy |
2379 |
TCP |
ksn_proxy |
7777 |
TCP |
ksn_proxy |
8083 |
TCP |
ksn_proxy |
9092 |
TCP |
ksn_proxy |
9102 |
TCP |
ksn_proxy |
10000:10010 |
TCP |
ksn_proxy |
1:65535 |
TCP |
ksqldb_configurator |
2379 |
TCP |
ksqldb_configurator |
5432 |
TCP |
ksqldb_configurator |
8083 |
TCP |
ksqldb_configurator |
8088 |
TCP |
ksqldb_configurator |
9092 |
TCP |
ksqldb_configurator |
10000:10010 |
TCP |
ksqldb_server |
2379 |
TCP |
ksqldb_server |
5432 |
TCP |
ksqldb_server |
9092 |
TCP |
ksqldb_server |
11000:11006 |
TCP |
management_ui |
2379 |
TCP |
management_ui |
8091 |
TCP |
monitoring_grafana |
3000 |
TCP |
monitoring_prometheus |
2379 |
TCP |
monitoring_prometheus |
9090 |
TCP |
monitoring_prometheus |
9100 |
TCP |
monitoring_prometheus |
9102 |
TCP |
monitoring_prometheus |
9141 |
TCP |
monitoring_prometheus |
9142 |
TCP |
monitoring_prometheus |
9191 |
TCP |
monitoring_prometheus |
9192 |
TCP |
monitoring_prometheus |
9283 |
TCP |
multitenancy_management_api |
2379 |
TCP |
multitenancy_management_api |
4567 |
TCP |
multitenancy_management_api |
8443 |
TCP |
multitenancy_management_api |
8701 |
TCP |
multitenancy_management_api |
8090 |
TCP |
multitenancy_management_api |
8899 |
TCP |
nginx_exporter |
2379 |
TCP |
nginx_gateway |
80 |
TCP |
nginx_gateway |
81 |
TCP |
nginx_gateway |
443 |
TCP |
nginx_gateway |
2379 |
TCP |
nginx_gateway |
4443 |
TCP |
nginx_gateway |
4567 |
TCP |
nginx_gateway |
6379 |
TCP |
nginx_gateway |
8080 |
TCP |
nginx_gateway |
8081 |
TCP |
nginx_gateway |
8082 |
TCP |
nginx_gateway |
8083 |
TCP |
nginx_gateway |
8085 |
TCP |
nginx_gateway |
8090 |
TCP |
nginx_gateway |
8100 |
TCP |
nginx_gateway |
8443 |
TCP |
nginx_gateway |
8444 |
TCP |
nginx_gateway |
8701 |
TCP |
nginx_gateway |
8702 |
TCP |
nginx_gateway |
8899 |
TCP |
nginx_gateway |
9393 |
TCP |
nginx_gateway |
9898 |
TCP |
node_exporter |
Any |
Any |
nta_core |
25 |
TCP |
nta_core |
80 |
TCP |
nta_core |
2379 |
TCP |
nta_core |
5433 |
TCP |
nta_core |
8082 |
TCP |
nta_core |
8083 |
TCP |
nta_core |
9443 |
TCP |
nta_database |
- |
- |
nta_database_configurator |
2379 |
TCP |
nta_database_configurator |
5432 |
TCP |
nta_database_configurator |
5432 |
TCP |
nta_sensor_configurator |
2379 |
TCP |
nta_sensor_configurator |
8084 |
TCP |
nta_sensor_configurator |
9443 |
TCP |
nta_sensor_configurator |
50051 |
TCP |
nta_syncer |
80 |
TCP |
nta_syncer |
2379 |
TCP |
nta_syncer |
5422 |
TCP |
nta_syncer |
5423 |
TCP |
nta_syncer |
7777 |
TCP |
nta_syncer |
8084 |
TCP |
nta_syncer |
9092 |
TCP |
nta_syncer |
10000:10010 |
TCP |
nta_syncer |
50051 |
TCP |
postfix |
25 |
TCP |
postfix |
2379 |
TCP |
postgresql_exporter |
2379 |
TCP |
postgresql_exporter |
5432 |
TCP |
postgresql_exporter |
9100 |
TCP |
postgresql_server |
2379 |
TCP |
postgresql_server |
5432 |
TCP |
preprocessor |
Any |
Any |
preprocessor_icap |
80 |
TCP |
preprocessor_icap |
1514 |
TCP |
preprocessor_icap |
1514 |
UDP |
preprocessor_icap |
2379 |
TCP |
preprocessor_icap |
4223 |
TCP |
preprocessor_icap |
6379 |
TCP |
preprocessor_icap |
7777 |
TCP |
preprocessor_icap |
8081 |
TCP |
preprocessor_icap |
8082 |
TCP |
preprocessor_icap |
8083 |
TCP |
preprocessor_icap |
9092 |
TCP |
preprocessor_icap |
9192 |
TCP |
preprocessor_icap |
9284 |
TCP |
preprocessor_icap |
10000:10010 |
TCP |
preprocessor_pop |
110 |
TCP |
preprocessor_pop |
514 |
TCP |
preprocessor_pop |
514 |
UDP |
preprocessor_pop |
2379 |
TCP |
preprocessor_pop |
4223 |
TCP |
preprocessor_pop |
6379 |
TCP |
preprocessor_pop |
7777 |
TCP |
preprocessor_pop |
8081 |
TCP |
preprocessor_pop |
8082 |
TCP |
preprocessor_pop |
8083 |
TCP |
preprocessor_pop |
9081 |
TCP |
preprocessor_pop |
9092 |
TCP |
preprocessor_pop |
10000:10010 |
TCP |
preprocessor_pop |
1:65535 |
TCP |
preprocessor_smtp |
514 |
TCP |
preprocessor_smtp |
514 |
UDP |
preprocessor_smtp |
2379 |
TCP |
preprocessor_smtp |
4223 |
TCP |
preprocessor_smtp |
6379 |
TCP |
preprocessor_smtp |
7777 |
TCP |
preprocessor_smtp |
8081 |
TCP |
preprocessor_smtp |
8082 |
TCP |
preprocessor_smtp |
8083 |
TCP |
preprocessor_smtp |
9081 |
TCP |
preprocessor_smtp |
9092 |
TCP |
preprocessor_smtp |
10000:10010 |
TCP |
preprocessor_span |
Any |
Any |
primary_database_configurator |
2379 |
TCP |
primary_database_configurator |
5432 |
TCP |
redis |
2379 |
TCP |
redis |
6379 |
TCP |
response_actions_processor |
514 |
TCP |
response_actions_processor |
514 |
UDP |
response_actions_processor |
2379 |
TCP |
response_actions_processor |
5432 |
TCP |
response_actions_processor |
8081 |
TCP |
response_actions_processor |
9092 |
TCP |
response_actions_processor |
9100 |
TCP |
response_actions_processor |
10000:10010 |
TCP |
response_api |
514 |
TCP |
response_api |
514 |
UDP |
response_api |
2379 |
TCP |
response_api |
5432 |
TCP |
response_api |
8080 |
TCP |
response_api |
9092 |
TCP |
response_api |
9100 |
TCP |
response_api |
10000:10010 |
TCP |
s3proxy |
80 |
TCP |
s3proxy |
1080 |
TCP |
s3proxy |
2379 |
TCP |
s3rotator |
80 |
TCP |
s3rotator |
1080 |
TCP |
s3rotator |
2379 |
TCP |
s3rotator |
9283 |
TCP |
s3rotator |
9284 |
TCP |
schema_registry |
2379 |
TCP |
schema_registry |
8081 |
TCP |
schema_registry |
9092 |
TCP |
schema_registry |
10000:10010 |
TCP |
sensor_event_processor |
2379 |
TCP |
sensor_event_processor |
8080 |
TCP |
sensor_event_processor |
8081 |
TCP |
sensor_event_processor |
9092 |
TCP |
sensor_event_processor |
9100 |
TCP |
sensor_event_processor |
10000:10010 |
TCP |
services_configurator |
2379 |
TCP |
siem_proxy |
80 |
TCP |
siem_proxy |
514 |
TCP |
siem_proxy |
514 |
UDP |
siem_proxy |
1080 |
TCP |
siem_proxy |
1514 |
TCP |
siem_proxy |
1514 |
UDP |
siem_proxy |
2080 |
TCP |
siem_proxy |
2379 |
TCP |
siem_proxy |
9284 |
TCP |
siem_proxy |
Any |
Any |
snmpd |
161 |
TCP |
snmpd |
2379 |
TCP |
updater |
80 |
TCP |
updater |
443 |
TCP |
updater |
514 |
TCP |
updater |
514 |
TCP |
updater |
2379 |
TCP |
updater |
5432 |
TCP |
updater |
6379 |
TCP |
updater |
7777 |
TCP |
updater |
8083 |
TCP |
updater |
9100 |
TCP |
updater |
9500 |
TCP |
updater |
1:65535 |
TCP |
updates_consistency_checker |
80 |
TCP |
updates_consistency_checker |
2379 |
TCP |
updates_consistency_checker |
6379 |
TCP |
updates_consistency_checker |
8083 |
TCP |
updates_consistency_checker |
9092 |
TCP |
updates_consistency_checker |
10000:10010 |
TCP |
web_backend |
25 |
TCP |
web_backend |
80 |
TCP |
web_backend |
443 |
TCP |
web_backend |
514 |
TCP |
web_backend |
514 |
UDP |
web_backend |
1080 |
TCP |
web_backend |
2379 |
TCP |
web_backend |
5432 |
TCP |
web_backend |
6379 |
TCP |
web_backend |
7777 |
TCP |
web_backend |
8080 |
TCP |
web_backend |
8081 |
TCP |
web_backend |
8082 |
TCP |
web_backend |
8083 |
TCP |
web_backend |
8085 |
TCP |
web_backend |
8090 |
TCP |
web_backend |
8123 |
TCP |
web_backend |
8283 |
TCP |
web_backend |
8443 |
TCP |
web_backend |
8444 |
TCP |
web_backend |
8899 |
TCP |
web_backend |
9090 |
TCP |
web_backend |
9092 |
TCP |
web_backend |
9284 |
TCP |
web_backend |
9500 |
TCP |
web_backend |
10000:10010 |
TCP |
web_backend |
33334 |
TCP |
zookeeper |
2181 |
TCP |
zookeeper |
2379 |
TCP |
zookeeper |
2888 |
TCP |
zookeeper |
3888 |
TCP |
zookeeper |
9092 |
TCP |
zookeeper |
10000:10010 |
TCP |
Ports used by services in a configuration with the Sensor component installed on a standalone server
For the application to work correctly in a configuration with the Sensor component installed on a standalone server, you must configure network access for outgoing connections in accordance with the table below.
Ports used by services in a configuration with the Sensor component installed on a standalone server
Service |
Port |
Protocol |
|---|---|---|
cadvisor |
Any |
Any |
ksn_proxy |
80 |
TCP |
ksn_proxy |
443 |
TCP |
ksn_proxy |
514 |
TCP |
ksn_proxy |
514 |
UDP |
ksn_proxy |
2379 |
TCP |
ksn_proxy |
7777 |
TCP |
ksn_proxy |
8083 |
TCP |
ksn_proxy |
9092 |
TCP |
ksn_proxy |
9102 |
TCP |
ksn_proxy |
10000:10010 |
TCP |
monitoring_prometheus |
2379 |
TCP |
monitoring_prometheus |
9090 |
TCP |
monitoring_prometheus |
9100 |
TCP |
monitoring_prometheus |
9102 |
TCP |
monitoring_prometheus |
9141 |
TCP |
monitoring_prometheus |
9142 |
TCP |
monitoring_prometheus |
9191 |
TCP |
monitoring_prometheus |
9192 |
TCP |
nginx_gateway |
443 |
TCP |
nginx_gateway |
2379 |
TCP |
nginx_gateway |
8085 |
TCP |
nginx_gateway |
8100 |
TCP |
nginx_gateway |
8283 |
TCP |
node_exporter |
Any |
TCP |
preprocessor_icap |
443 |
TCP |
preprocessor_icap |
1080 |
TCP |
preprocessor_icap |
1344 |
TCP |
preprocessor_icap |
1514 |
TCP |
preprocessor_icap |
1514 |
UDP |
preprocessor_icap |
2379 |
TCP |
preprocessor_icap |
4223 |
TCP |
preprocessor_icap |
6379 |
TCP |
preprocessor_icap |
7777 |
TCP |
preprocessor_icap |
8081 |
UDP |
preprocessor_icap |
8082 |
TCP |
preprocessor_icap |
8082 |
UDP |
preprocessor_icap |
8083 |
TCP |
preprocessor_icap |
8085 |
TCP |
preprocessor_icap |
9092 |
TCP |
preprocessor_pop3 |
1514 |
TCP |
preprocessor_pop3 |
1514 |
UDP |
preprocessor_pop3 |
2379 |
TCP |
preprocessor_pop3 |
4223 |
TCP |
preprocessor_pop3 |
6379 |
TCP |
preprocessor_pop3 |
7777 |
TCP |
preprocessor_pop3 |
8081 |
TCP |
preprocessor_pop3 |
8081 |
UDP |
preprocessor_pop3 |
8082 |
UDP |
preprocessor_pop3 |
8083 |
TCP |
preprocessor_pop3 |
9081 |
TCP |
preprocessor_pop3 |
9092 |
TCP |
preprocessor_pop3 |
11000 |
TCP |
preprocessor_smtp |
1514 |
TCP |
preprocessor_smtp |
1514 |
UDP |
preprocessor_smtp |
2379 |
TCP |
preprocessor_smtp |
4223 |
TCP |
preprocessor_smtp |
6379 |
TCP |
preprocessor_smtp |
7777 |
TCP |
preprocessor_smtp |
8081 |
TCP |
preprocessor_smtp |
8081 |
UDP |
preprocessor_smtp |
8082 |
UDP |
preprocessor_smtp |
8083 |
TCP |
preprocessor_smtp |
9081 |
TCP |
preprocessor_smtp |
9092 |
TCP |
preprocessor_smtp |
11000 |
TCP |
preprocessor_span |
Any |
Any |
preprocessor_span |
13520 |
TCP |
preprocessor_span |
8081 |
UDP |
preprocessor_span |
8082 |
UDP |
preprocessor_span |
9081 |
TCP |
preprocessor_span |
7777 |
TCP |
preprocessor_span |
9092 |
TCP |
preprocessor_span |
8083 |
TCP |
preprocessor_span |
2379 |
TCP |
preprocessor_span |
6379 |
TCP |
redis |
2379 |
TCP |
redis |
6379 |
TCP |
s3proxy |
80 |
TCP |
s3proxy |
1080 |
TCP |
s3proxy |
2379 |
TCP |
s3rotator |
80 |
TCP |
s3rotator |
1080 |
TCP |
s3rotator |
2379 |
TCP |
s3rotator |
9284 |
TCP |
sensor_management_api |
Any |
Any |
services_configurator |
2379 |
TCP |
siem_proxy |
80 |
TCP |
siem_proxy |
514 |
TCP |
siem_proxy |
514 |
UDP |
siem_proxy |
1080 |
TCP |
siem_proxy |
1514 |
TCP |
siem_proxy |
1514 |
UDP |
siem_proxy |
2080 |
TCP |
siem_proxy |
2379 |
TCP |
siem_proxy |
9284 |
TCP |
snmpd |
161 |
TCP |
snmpd |
2379 |
TCP |
Ports for communication between network traffic analysis services
For the application to work correctly, you must make sure that network traffic analysis services can communicate through the ports listed in the table below. Inbound connections for services are allowed by default.
Ports for communication between network traffic analysis services
Service |
Port |
Destination service |
Protocol |
|---|---|---|---|
nta_database_configurator |
5433 |
nta_database |
TCP |
nta_core |
5433 |
nta_database |
TCP |
nta_core |
2379 |
etcd |
TCP |
nta_core |
80 |
web_backend |
TCP |
nta_core |
9443 |
internet |
TCP |
nta_syncer |
9092 |
kafka |
TCP |
nta_syncer |
2379 |
etcd |
TCP |
nta_syncer |
5432 |
postgresql_server |
TCP |
nta_syncer |
5433 |
nta_database |
TCP |
nta_syncer |
50051 |
nta_core |
TCP |
nta_syncer |
8084 |
nta_core |
TCP |
nta_sensor_configurator |
50051 |
nta_core |
UDP |
nta_sensor_configurator |
9443 |
nta_core |
TCP |
preprocessor_span |
13520 |
nta_core |
TCP |
preprocessor_span |
8081 |
kata_scanner |
UDP |
preprocessor_span |
8082 |
kata_scanner |
UDP |
preprocessor_span |
9081 |
kata_scanner |
TCP |
preprocessor_span |
7777 |
ksn_proxy |
TCP |
preprocessor_span |
9092 |
kafka |
TCP |
preprocessor_span |
8083 |
updater |
TCP |
preprocessor_span |
2379 |
etcd |
TCP |
preprocessor_span |
6379 |
redis |
TCP |
preprocessor_icap |
9092 |
kafka |
TCP |
preprocessor_icap |
7777 |
ksn_proxy |
TCP |
preprocessor_icap |
8081 |
kata_scanner |
UDP |
preprocessor_icap |
8082 |
kata_scanner |
UDP |
preprocessor_icap |
2379 |
etcd |
TCP |
preprocessor_icap |
8083 |
updater |
TCP |
preprocessor_icap |
4223 |
preprocessor_span |
TCP |
preprocessor_smtp |
8081 |
kata_scanner |
UDP |
preprocessor_smtp |
8082 |
kata_scanner |
UDP |
preprocessor_smtp |
9081 |
kata_scanner |
TCP |
preprocessor_smtp |
7777 |
ksn_proxy |
TCP |
preprocessor_smtp |
9092 |
kafka |
TCP |
preprocessor_smtp |
8083 |
updater |
TCP |
preprocessor_smtp |
2379 |
etcd |
TCP |
preprocessor_smtp |
6379 |
redis |
TCP |
preprocessor_smtp |
4223 |
preprocessor_span |
TCP |
preprocessor_pop3 |
8081 |
kata_scanner |
UDP |
preprocessor_pop3 |
8082 |
kata_scanner |
UDP |
preprocessor_pop3 |
9081 |
kata_scanner |
TCP |
preprocessor_pop3 |
7777 |
ksn_proxy |
TCP |
preprocessor_pop3 |
9092 |
kafka |
TCP |
preprocessor_pop3 |
8083 |
updater |
TCP |
preprocessor_pop3 |
2379 |
etcd |
TCP |
preprocessor_pop3 |
6379 |
redis |
TCP |
preprocessor_pop3 |
4223 |
preprocessor_span |
TCP |
Configuring integration of the Endpoint Agent component with the KEDR functional block
This section contains information on configuring the integration of the KEDR functional block with applications that are used in the role of the Endpoint Agent component.
Configuring a trusted connection with Kaspersky Endpoint Agent
Actions to configure a trusted connection are performed both on the Kaspersky Anti Targeted Attack Platform side through the web interface and the application administrator menu, and on the Kaspersky Endpoint Agent side through the KSC Administration Console.
You can use one of the following options to configure a trusted connection:
- Without validating the Kaspersky Endpoint Agent TLS certificate on the Kaspersky Anti Targeted Attack Platform side.
- Configuring the connection with the Central Node server without validating the TLS certificate of Kaspersky Endpoint Agent in Kaspersky Anti Targeted Attack Platform.
- Configuring the connection with the Sensor server without validating the TLS certificate of Kaspersky Endpoint Agent in Kaspersky Anti Targeted Attack Platform.
- Validating the Kaspersky Endpoint Agent TLS certificate on the Kaspersky Anti Targeted Attack Platform side.
- Configuring the connection with the Central Node server with validation of the TLS certificate of Kaspersky Endpoint Agent in Kaspersky Anti Targeted Attack Platform.
- Configuring the connection with the Sensor server with validation of the TLS certificate of Kaspersky Endpoint Agent in Kaspersky Anti Targeted Attack Platform.
Configuring the validation of the Kaspersky Endpoint Agent TLS certificate by the Central Node server and uploading a crypto container to Kaspersky Endpoint Agent
To configure the validation of Kaspersky Endpoint Agent TLS certificate by the Central Node server and upload the crypto container with the Kaspersky Endpoint Agent certificate to Kaspersky Endpoint Agent:
- Open the KSC Console.
- In the console tree, open the Policies folder.
- In the Kaspersky Endpoint Agent policy section, select the required policy and double-click it to open its properties.
The properties of the selected policy are displayed.
- In the KATA integration section, select the KATA Central Node subsection.
- Click Configure additional security.
- In the window that opens, select the Secure the connection with client certificate check box.
- Click Upload.
This opens the file selection window on your local computer.
- Select the cryptographic container file of the Kaspersky Endpoint Agent certificate that was generated on the Kaspersky Anti Targeted Attack Platform server and downloaded to the hard drive of your computer.
- Click OK.
The window closes.
- Make sure the toggle switch in the upper right corner of the group of settings is in the Under policy position.
- Click OK.
The crypto container with the Kaspersky Endpoint Agent certificate is uploaded to Kaspersky Endpoint Agent. Kaspersky Anti Targeted Attack Platform now validates the TLS certificate of Kaspersky Endpoint Agent when it tries to connect.
Uploading a TLS certificate of the Central Node server or Sensor to Kaspersky Endpoint Agent
To upload a TLS certificate of the Central Node server or Sensor to Kaspersky Endpoint Agent
- Open the KSC Console.
- In the console tree, open the Policies folder.
- In the Kaspersky Endpoint Agent policy section, select the required policy and double-click it to open its properties.
The properties of the selected policy are displayed.
- In the KATA integration section, select the KATA integration settings subsection.
- Select the Enable KATA integration check box.
- In the Address field, enter the address of the Central Node server of the Kaspersky Anti Targeted Attack Platform program that you want to configure integration with, and select a port to use for the connection. Port 443 is used by default.
- Select the Use pinned certificate to secure connection check box.
- Click Add a TLS certificate....
This opens the Adding TLS certificate window.
- To add a TLS certificate previously created on the Kaspersky Anti Targeted Attack Platform side and downloaded, do one of the following:
- Add a certificate file. To do so, click Browse...; in the window that is displayed, select a certificate file and click Open.
- Paste the content of the certificate file to the Paste TLS certificate data: field.
Kaspersky Endpoint Agent can store only one TLS certificate for the Kaspersky Anti Targeted Attack Platform server. If you have added a TLS certificate before and are adding a TLS certificate again, only the last added certificate is used.
If you have configured traffic redirection to the server with the Sensor component, you must download the TLS certificate of the Sensor server and then upload it here.
- Click Add.
Information about the added TLS certificate is displayed in the section for integration with Kaspersky Anti Targeted Attack Platform.
- Make sure the toggle switch in the upper right corner of the group of settings is in the Under policy position.
- Click OK.
The TLS certificate of the Central Node server is downloaded to Endpoint Agent.
Configuring the integration and trusted connection with Kaspersky Anti Targeted Attack Platform on the Kaspersky Endpoint Agent side
To configure integration with Kaspersky Anti Targeted Attack Platform on the Kaspersky Endpoint Agent side:
- Open the KSC Console.
- In the console tree, open the Policies folder.
- In the Kaspersky Endpoint Agent policy section, select the required policy and double-click it to open its properties.
The properties of the selected policy are displayed.
- In the KATA integration section, select the KATA integration settings subsection.
- Select the Enable KATA integration check box.
- In the Address field, enter the address of the Central Node server of the Kaspersky Anti Targeted Attack Platform program that you want to configure integration with, and select a port to use for the connection. Port 443 is used by default.
- Select the Use pinned certificate to secure connection check box.
- Click Add a TLS certificate....
This opens the Adding TLS certificate window.
- To add a TLS certificate previously created on the Kaspersky Anti Targeted Attack Platform side and downloaded, do one of the following:
- Add a certificate file. To do so, click Browse...; in the window that is displayed, select a certificate file and click Open.
- Paste the content of the certificate file to the Paste TLS certificate data: field.
Kaspersky Endpoint Agent can store only one TLS certificate for the Kaspersky Anti Targeted Attack Platform server. If you have added a TLS certificate before and are adding a TLS certificate again, only the last added certificate is used.
If you have configured traffic redirection to the server with the Sensor component, you must download the TLS certificate of the Sensor server and then upload it here.
- Click Add.
Information about the added TLS certificate is displayed in the section for integration with Kaspersky Anti Targeted Attack Platform.
- Click Add client certificate....
- In the window that is displayed, select the Secure with client certificate check box.
- Click Download.
This opens the file selection window on your local computer.
- Select the cryptographic container file of the Kaspersky Endpoint Agent certificate that was generated on the Kaspersky Anti Targeted Attack Platform server and downloaded to the hard drive of your computer.
- Click OK.
The window closes.
- In the Timeout period (sec.): field, enter the maximum response timeout of the Kaspersky Anti Targeted Attack Platform Central Node server in seconds.
- In the Send sync request to KATA server every (min.) field, enter the period in minutes.
- If you do not want Kaspersky Endpoint Agent to send information about repeated running of processes to the Kaspersky Anti Targeted Attack Platform server, select the Apply TTL period for events transmission check box. If the process is started after the next TTL period expires, Kaspersky Endpoint Agent does not consider this a repeated start of the process.
- If you have set the "Apply TTL period for events transmission" check box, specify the time in the TTL period (min.) field.
- Make sure the toggle switch in the upper right corner of the group of settings is in the Under policy position.
- Click OK.
The integration with Kaspersky Anti Targeted Attack Platform on the Kaspersky Endpoint Agent side is configured.
Configuring a trusted connection with Kaspersky Endpoint Security
To configure a trusted connection, you must perform actions both on the Kaspersky Anti Targeted Attack Platform side and on the Kaspersky Endpoint Security side.
You can use one of the following options to configure a trusted connection:
- Configuring the connection with the Central Node server without validating the TLS certificate of Kaspersky Endpoint Security in Kaspersky Anti Targeted Attack Platform.
- Configuring the connection with the Central Node server with validation of the TLS certificate of Kaspersky Endpoint Security on the Kaspersky Anti Targeted Attack Platform side.
Downloading the TLS certificate of the Central Node server
To download the TLS certificate of the server:
- In the window of the application web interface, select the Settings section, Certificates subsection.
- In the Server certificate section, click Download.
The server certificate file will be saved in the downloads folder of the browser.
Generating a TLS certificate for the Central Node server in the web interface of Kaspersky Anti Targeted Attack Platform
If you are already using a Central Node server TLS certificate, generating a new certificate causes the currently used certificate to be removed and replaced with the newly generated certificate.
You must enter the data of the new certificate everywhere the old certificate was used.
If you replace the TLS certificate, you will need to:
- Reauthorize mail sensors (KSMG, KLMS) on Central Node
- Reconfigure the connection of Central Node, PCN, and SCN to Sandbox
- Reconfigure traffic forwarding from Endpoint Agent to Sensor and trusted connection with Endpoint Agent.
- Upload a new certificate to Active Directory (if you are using Active Directory).
Make sure to delete all Endpoint Agent host isolation rules. Connection with isolated hosts will be lost and you will not be able to manage them.
To generate a TLS certificate for a Central Node server:
- Sign in to the Kaspersky Anti Targeted Attack Platform web interface with the administrator credentials.
- In the window of the application web interface, select the Settings section, Certificates subsection.
- In the Server certificate section, click Generate.
This opens the action confirmation window.
- Click Yes.
Kaspersky Anti Targeted Attack Platform generates a new TLS certificate. The page is automatically refreshed.
Uploading an independently prepared TLS certificate for the Central Node server using the web interface of Kaspersky Anti Targeted Attack Platform.
You can choose to prepare the TLS certificate on your own and upload it using the Kaspersky Anti Targeted Attack Platform web interface.
The TLS certificate file prepared for upload must satisfy the following requirements:
- The file must contain the certificate itself and a private encryption key for the connection.
- The file must be in PEM format.
The application does not support other formats of certificates.
If you have prepared a certificate in a different format, you must convert it to the PEM format.
- The private key length must be 2048 bits or longer.
For more details on preparing TLS certificates for import, please refer to the documentation on Open SSL.
If you are already using a Central Node server TLS certificate, uploading a new certificate causes the currently used certificate to be removed and replaced with the uploaded certificate.
You must enter the data of the new certificate everywhere the old certificate was used.
If you replace the TLS certificate, you will need to:
- Reauthorize mail sensors (KSMG, KLMS) on Central Node
- Reconfigure the connection of Central Node, PCN, and SCN to Sandbox
- Reconfigure traffic forwarding from Endpoint Agent to Sensor and trusted connection with Endpoint Agent
Delete all Endpoint Agent host isolation rules. The connection with isolated hosts is severed and you cannot manage them.
To upload an independently prepared TLS certificate using the Kaspersky Anti Targeted Attack Platform web interface:
- Sign in to the Kaspersky Anti Targeted Attack Platform web interface with the administrator credentials.
- In the window of the application web interface, select the Settings section, Certificates subsection.
- In the Server certificate section, click Upload.
This opens the file selection window.
- Select a TLS certificate file to download and click the Open button.
This closes the file selection window.
The TLS certificate is added to the Kaspersky Anti Targeted Attack Platform.
Make sure to delete all Endpoint Agent host isolation rules. Connection with isolated hosts will be lost and you will not be able to manage them
Enabling the validation of the TLS certificate of the Endpoint Agent component in the web interface of Kaspersky Anti Targeted Attack Platform
To turn on trusted connection with the application that is used in the role of the Endpoint Agent component:
- Sign in to the Kaspersky Anti Targeted Attack Platform web interface with the administrator credentials.
- In the Kaspersky Anti Targeted Attack Platform web interface window, select the Settings section, Certificates subsection.
- In the Endpoint Agent certificates section, turn on the Validate Endpoint Agent TLS certificates switch.
Kaspersky Anti Targeted Attack Platform will check TLS certificate data when the application that is used in the role of the Endpoint Agent component attempts to connect to Kaspersky Anti Targeted Attack Platform.
Generating a TLS certificate of the Endpoint Agent component in the web interface of Kaspersky Anti Targeted Attack Platform and downloading a crypto container
To generate a TLS certificate for the connection of Kaspersky Anti Targeted Attack Platform with the application that is being used in the Endpoint Agent component role:
- Sign in to the Kaspersky Anti Targeted Attack Platform web interface with the administrator credentials.
- In the Kaspersky Anti Targeted Attack Platform web interface window, select the Settings section, Certificates subsection.
- In the Endpoint Agent certificates section, click Generate and export.
The new TLS certificate is displayed in the TLS certificate table. The crypto container file with the Kaspersky Endpoint Agent certificate in the PFX format is downloaded to the browser downloads folder on your local computer.
You can use the crypto container to configure the validation of Kaspersky Endpoint Agent TLS certificate by the Central Node server when attempting to connect to Kaspersky Anti Targeted Attack Platform.
By default, the crypto container is not password-protected. You can protect the crypto container with a password. For details on managing TLS certificates, see the OpenSSL documentation.
The crypto container contains only the certificate file, but not the private key file. Kaspersky Anti Targeted Attack Platform does not store private keys for the TLS encryption of the connection.
Uploading an independently prepared TLS certificate of the Endpoint Agent component using the web interface of Kaspersky Anti Targeted Attack Platform
You can choose to prepare the TLS certificate on your own and upload it using the Kaspersky Anti Targeted Attack Platform web interface.
The TLS certificate file prepared for upload must satisfy the following requirements:
- The file must contain the certificate itself and a private encryption key for the connection.
- The file must be in PEM format.
- The private key length must be 2048 bits or longer.
For more details on preparing TLS certificates for import, please refer to the OpenSSL documentation.
If you want to prepare the TLS certificate of Kaspersky Endpoint Agent on your own, you must create a PFX crypto container with your certificate and upload the crypto container to Kaspersky Endpoint Agent.
You can use the crypto container to configure the validation of Kaspersky Endpoint Agent TLS certificate by the Central Node server when attempting to connect to Kaspersky Anti Targeted Attack Platform.
For details on managing TLS certificates, see the OpenSSL documentation.
The crypto container must contain only the certificate file, but not the private key file. Kaspersky Anti Targeted Attack Platform does not store private keys for the TLS encryption of the connection.
To upload an independently prepared TLS certificate using the Kaspersky Anti Targeted Attack Platform web interface:
- Sign in to the Kaspersky Anti Targeted Attack Platform web interface with the administrator credentials.
- In the Kaspersky Anti Targeted Attack Platform web interface window, select the Settings section, Certificates subsection.
- In the Endpoint Agent certificates section, click Upload.
This opens the file selection window.
- Select a TLS certificate file to download and click the Open button.
This closes the file selection window.
The TLS certificate is added to the Kaspersky Anti Targeted Attack Platform.
Viewing the table of TLS certificates of the Endpoint Agent component in the web interface of Kaspersky Anti Targeted Attack Platform
To view the list of TLS certificates for connection with applications that are used in the role of the Endpoint Agent component using the Kaspersky Anti Targeted Attack Platform web interface:
- Sign in to the Kaspersky Anti Targeted Attack Platform web interface with the administrator credentials.
- In the Kaspersky Anti Targeted Attack Platform web interface window, select the Settings section, Certificates subsection.
- The Endpoint Agent certificates section displays a list of TLS certificate with the following details for each certificate:
- TLS certificate – Fingerprint of the certificate.
- Serial number —Serial number of the certificate.
- Expires —Expiration date of the certificate.
Filtering and searching TLS certificates of the Endpoint Agent component in the web interface of Kaspersky Anti Targeted Attack Platform
You can filter TLS certificate displayed in the table by one or both columns (TLS certificate and Serial number) or enter search criteria to search TLS certificates by these columns.
To filter and search TLS certificates in the table:
- Sign in to the Kaspersky Anti Targeted Attack Platform web interface with the administrator credentials.
- In the Kaspersky Anti Targeted Attack Platform web interface window, select the Settings section, Certificates subsection.
- The Endpoint Agent certificates section displays a list of TLS certificate with the following details for each certificate:
- TLS certificate – Fingerprint of the certificate.
- Serial number —Serial number of the certificate.
- Expires —Expiration date of the certificate.
- If you want to filter or search TLS certificates by certificate fingerprint:
- Click the TLS certificate link to open the filter configuration window.
- In the TLS certificate text box, enter a few characters of the certificate fingerprint.
- Click Apply.
- If you want to filter or search TLS certificates by serial number:
- Click the Serial number link to open the filter configuration window.
- In the Serial number text box, enter a few characters of the serial number.
- Click Apply.
The table displays only those TLS certificates that match the filter criteria you have set.
To clear the filter for one or more filtering criteria:
Click ![]() to the right of the header of the table column for which you want to clear the filter conditions.
to the right of the header of the table column for which you want to clear the filter conditions.
If you want to clear several filter conditions, perform the necessary actions to clear each filter condition.
The selected filters are cleared.
Deleting TLS certificates of the Endpoint Agent component in the web interface of Kaspersky Anti Targeted Attack Platform
To delete one or more TLS certificates for connection with applications that are used in the role of the Endpoint Agent component using the Kaspersky Anti Targeted Attack Platform web interface:
- Sign in to the Kaspersky Anti Targeted Attack Platform web interface with the administrator credentials.
- In the Kaspersky Anti Targeted Attack Platform web interface window, select the Settings section, Endpoint Agent certificates subsection.
The Endpoint Agent certificates section displays a list of TLS certificates.
- Select check boxes next to one or more TLS certificates that you want to delete.
- Click Delete.
This opens the action confirmation window.
- Click Yes.
The selected TLS certificates are deleted.
Configuring traffic redirection from the Endpoint Agent component to the Sensor server
You can use the Sensor server as a proxy server for communication between the Endpoint Agent component and the Central Node to reduce the load on the Central Node.
When configuring the traffic redirection, keep in mind the following limitations:
- The maximum incoming traffic volume for the Sensor may not exceed 1 Gbps.
- The recommended channel bandwidth between Central Node and Sensor servers must be 15% of the SPAN port traffic.
- The maximum allowed packet loss between Sensor servers and the Central Node is 10% with a packet delay of up to 100 ms.
You can only use the Sensor as a proxy server if the Sensor and Central Node are located on different servers.
If you are using Sensor as a proxy server, make sure to enter the IP address of the Sensor instead of the IP address of the Central Node when configuring the integration of Kaspersky Anti Targeted Attack Platform with the application that acts as the Endpoint Agent component on that application's side.
To use the Sensor as a proxy server, connect the Sensor to the Central Node.
Configuring integration of the Endpoint Agent component with the NDR functional block
If you use the NDR functionality, you can configure the integration of Kaspersky Anti Targeted Attack Platform with the Endpoint Agent component represented by Kaspersky Endpoint Security 12.7 for Windows and Kaspersky Endpoint Security 12.2 Linux to receive the following information about the devices on which the component is installed:
- Information about NDR events recorded in the event database as a result of the EPP technology triggering (workstation and server protection events).
- Device information (for example, operating system version, model or vendor information).
- Information about the connections of devices on the network interactions map.
- Information about protocols used to establish connections between devices.
You can connect up to 1000 Endpoint Agent components to a single Central Node component. If you want to connect more components, please contact Technical Support.
To integrate with the NDR functionality, Kaspersky Endpoint Security 12.7 for Windows or Kaspersky Endpoint Security 12.2 Linux must be activated using a KESB Advanced or KESB Total license key.
Data from computers with the Endpoint Agent component is sent to Kaspersky Anti Targeted Attack Platform through integration servers. Any server with Kaspersky Anti Targeted Attack Platform component (Central Node or Sensor) installed can function as an integration server. For integration with Endpoint Agent, add integration servers to the servers that receive data from computers with Endpoint Agent.
Computers hosting Endpoint Agent establish secure connections with integration servers over the HTTPS protocol. The connections are secured by certificates issued by the Central Node server. The following certificates can be used for connections:
- Integration server certificate. This certificate is verified by the computer with Endpoint Agent each time a connection is established. The connection is not established until the certificate is successfully verified.
- Client certificate. This certificate is used to authenticate integration server clients that are computers with Endpoint Agent. The same client certificate can be used by multiple computers with Endpoint Agent. By default, the integration server does not verify client certificates, but you can enable verification to improve the security of connections.
Certificates and public keys are distributed to Endpoint Agent computers using Kaspersky Endpoint Security for Windows or Kaspersky Endpoint Security for Linux. To upload this data into Kaspersky Endpoint Security, you can use a communication data package, which must be created in Kaspersky Anti Targeted Attack Platform after adding the integration server.
Only users with the Administrator role can configure the receipt of data from Endpoint Agent components. Users with the Security auditor role can view the list of integration servers.
Integration servers table
The table of integration servers is displayed in the Settings section, Connection servers subsection, on the Integration servers tab. This table displays information about the integration servers that have been added on the servers with the application components installed.
The table of integration servers contains the following information:
- Node name—Name of the server that has the application component installed.
- IP addresses—List of IP addresses on all network interfaces of the server with the Kaspersky Anti Targeted Attack Platform component (specific network interfaces and IP addresses are not configured for integration servers because any available network interface and IP address of a computer can be used for an external connection to the integration server).
- Requests per second—Average number of successfully processed requests coming from clients to the integration server.
- Status—Current status of the integration server.
- Verify client certificate—Indicates whether client certificate verification is enabled or disabled (if verification is disabled, the table cell is empty).
Scenario for preparing to receive data from the Endpoint Agent component
The scenario for preparing to receive data from the Endpoint Agent component involves the following steps:
- Installing the Endpoint Agent component on computers of the controlled network
At this step, you must install Kaspersky Endpoint Security for Windows or Kaspersky Endpoint Security for Linux, which acts as the Endpoint Agent component, on all computers that you want to receive information about in Kaspersky Anti Targeted Attack Platform. These computers must be on the same network as one of the servers with the Sensor component.
The current version of Kaspersky Anti Targeted Attack Platform supports receiving and processing data only when integrated with Kaspersky Endpoint Security for Windows 12.7 and later or Kaspersky Endpoint Security for Linux 12.2 and later.
- Adding integration servers for Kaspersky Anti Targeted Attack Platform components
This phase involves the completion of procedures for adding integration servers to the servers to which the Endpoint Agent components will connect. Network interactions between servers and Endpoint Agent components are possible only through network interfaces that are not being used as monitoring points. Specific network interfaces and IP addresses are not configured for integration servers because any available network interface and IP address of a computer can be used for an external connection to the integration server.
- Creating communication data packages for clients of integration servers
At this stage, you must create and download communication data packages in which the application stores certificates and keys for connections of clients to the integration servers. Each communication data package is an archive containing the following data:
- Public key of the integration server certificate.
- The certificate for clients of the integration server (with a private key). This certificate is added if client certificate verification is enabled on the integration server. The certificate and key are encrypted using the password specified when creating the communication data package.
- Uploading data for connecting to integration servers to client computers
We recommend using Kaspersky Security Center to do this. For Kaspersky Anti Targeted Attack Platform integration servers, clients are computers with the Endpoint Agent component. Upload certificates and/or keys from communication data packages to the Kaspersky Security Center Administration Server by using the Endpoint Agent administration plug-in. Then, create policies in Kaspersky Security Center for uploading data to computers with Endpoint Agent. For information on managing data and creating policies, see the documentation of the Kaspersky Endpoint Security for Windows and Kaspersky Endpoint Security for Linux.
For each integration server, at least one policy must be created, containing the following data to be uploaded to client computers:
- Public key of the integration server certificate.
- IP address for connecting to the integration server. You can specify any of the available IP addresses of the integration server node. You can view IP addresses in the web interface in the Settings section, Connection servers subsection, on the Integration servers tab. By default, port 8070 is used for the connection.
- The certificate for clients of the integration server (with a private key). This certificate is added if client certificate verification is enabled on the integration server.
- Enabling integration servers
This phase is completed after applying policies and uploading data to computers with the Endpoint Agent component. At this stage, you need to enable all integration servers to which you want data from EPP applications to be sent.
As a result of the scenario, Kaspersky Anti Targeted Attack Platform starts receiving and processing data from EPP applications.
Page top
Adding an integration server
To add an integration server:
- Log in to the web interface with the application administrator account.
- Select the Settings section, Connection servers subsection in the window of the application web interface.
- In the Integration servers tab, click the Add Endpoint Agent integration server button.
- In the Node drop-down list, select the server with the installed Central Node or Sensor component to which you want to add an integration server.
You can only select a node to which an integration server has not been added yet.
- If necessary, enable verification of certificates for client authentication by using the Verify client certificates toggle switch.
- If you have enabled client certificate verification, create one or more certificates for the integration server clients. To create a certificate, click Create new certificate. If necessary, you can remove unnecessary certificates from the list by clicking the
 icon to the right of the field with the certificate fingerprint.
If you have created multiple client certificates, you can select a certificate when creating the communication data package.
- Click Save.
The integration server is added.
Creating a communication data package for clients of an integration server
After adding an integration server or after editing its settings, you need to create and download a communication data package for the clients of this server.
To create a new communication data package for the clients of the integration server:
- Log in to the web interface with the application administrator account.
- Select the Settings section, Connection servers subsection in the window of the application web interface.
- On the Integration servers tab, select the server for whose clients you want to create a new communication data package.
The details area is displayed in the right part of the web interface window.
- Click Get communication data package for clients.
- If client certificate verification is enabled for the integration server, the Generating a new communication data package window is displayed. Do the following:
- In the Certificate for clients drop-down list, select the certificate that will be used for authentication of integration server clients.
- Specify the access password for the selected certificate. The specified password is used to encrypt the certificate in the communication data package of the connector.
- Click Create communication data package.
Central Node generates a new communication data package for the clients of the selected integration server, after which the browser saves the downloaded file. Depending on your browser's settings, a window may be displayed on your screen in which you can specify the path and name of the downloaded file.
You need to upload the contents of the communication data package to the client computers of the integration server. You can upload it using Kaspersky Security Center Administration Server policies. In Kaspersky Security Center policies, specify the IP address for connecting to the integration server (you can use one of the available IP addresses listed in the details area of the selected integration server). For more details on creating and configuring Kaspersky Security Center policies, refer to the documentation of Kaspersky Endpoint Security for Windows or Kaspersky Endpoint Security for Linux.
Page top
Enabling or disabling an integration server
Integration servers can be enabled or disabled. By default, after creation, the integration server is disabled, so data from its clients is not processed by Kaspersky Anti Targeted Attack Platform.
To enable or disable an integration server:
- Log in to the web interface with the application administrator account.
- Select the Settings section, Connection servers subsection in the window of the application web interface.
- On the Integration servers tab, select the server that you want to enable or disable.
The details area is displayed in the right part of the web interface window.
- Click Enable or Disable.
The server is enabled or disabled.
Page top
Editing integration server settings
When you edit integration server settings, you can replace the certificate for the integration server itself, enable or disable verification of client certificates, and change the list of certificates for clients.
To edit integration server settings:
- Log in to the web interface with the application administrator account.
- Select the Settings section, Connection servers subsection in the window of the application web interface.
- On the Integration servers tab, select the server for whose clients you want to edit settings.
The details area is displayed in the right part of the web interface window.
- On the toolbar, click the Edit button.
- If you want to replace the certificate of the integration server itself (issue a new certificate), click Reissue certificate.
Replacing the integration server certificate makes the old certificate invalid.
- If you want to enable or disable certificate verification for client authentication, use the Verify client certificates toggle switch.
- If client certificate verification is enabled and you want to modify the list of certificates for clients, click Create new certificate and/or the
 icon to the right of the field containing the certificate fingerprint.
 - Click Save.
Integration server settings are modified.
If you issued a new certificate for the integration server or generated new client certificates, you need to create and download the communication data package again to propagate the information about these certificates to client computers.
Removing an integration server
To remove an integration server:
- Log in to the web interface with the application administrator account.
- Select the Settings section, Connection servers subsection in the window of the application web interface.
- On the Integration servers tab, select the server that you want to remove.
The details area is displayed in the right part of the web interface window.
- Click Delete.
This opens a confirmation prompt window.
- In the prompt window, click OK.
The integration server is removed.
Page top
Getting started with the application
This section contains information about how to begin managing the application in the web interface, in the administrator menu, and in Technical Support Mode.
Getting started with the application web interface with an administrator account
The web interface of Kaspersky Anti Targeted Attack Platform is protected against CSRF attacks and operates only if the browser used for managing the application web interface provides the Referrer header of an HTTP POST request. Make sure that the browser that you are using to work with the Kaspersky Anti Targeted Attack Platform web interface does not modify the Referrer header of an HTTP POST request. If the connection with the web interface of Kaspersky Anti Targeted Attack Platform is established through a proxy server of your organization, make sure that the proxy server does not modify the Referrer header of an HTTP POST request.
After installing Kaspersky Anti Targeted Attack Platform, you must manage the sizing settings of the application.
If the sizing settings of Kaspersky Anti Targeted Attack Platform are not configured, logging in to the application web interface is not possible.
To get started with the application web interface with an administrator account:
- In a browser on any computer on which access to the Central Node server has been allowed, enter the IP address of the server with the Central Node component into the browser's address bar.
If you are using the high availability version of the application, you can enter the IP address of any server of the Central Node cluster or the fully qualified domain name (FQDN) of the cluster.
An input window for account credentials of the Kaspersky Anti Targeted Attack Platform user opens.
- Enter the username, "admin", and the password that was set when deploying the Central Node component.
- Click Log in.
The Dashboard page of the application web interface is displayed.
You can start using the application with the administrator account.
For each user account, the number of simultaneous application management sessions is limited to one IP address. If the same user name is used to sign in to the application from a different IP address, the earlier session is terminated.
Getting started with the application administrator menu
You can manage the settings of each of the application's Sensor, Central Node, and Sandbox components in the administrator menu in the management console of each server on which the application component is installed.
Make sure that access to Kaspersky Anti Targeted Attack Platform administrator menu and server management console is possible only from computers to which you have granted such access.
Make sure the computers to which you grant access are inside the secure perimeter of your network.
You can configure access to Kaspersky Anti Targeted Attack Platform administrator menu and server management console from certain computers using the iptables command-line utility. For detailed information about managing iptables, see the iptables documentation.
To start working in the Sandbox, Sensor or Central Node component administrator menu in the server management hosting the needed component:
- Sign in to the management console of the server whose settings you want to change via the SSH protocol or through a terminal.
The application component administrator menu is displayed.
- When the system prompts you, enter the administrator user name and the password that was set during the installation of the application.
The application component administrator menu is displayed.
You can begin working in the Sensor or Sandbox component administrator menu.
Getting started with the application in Technical Support Mode
Any actions in Technical Support Mode that are not approved and/or not recommended by Technical Support staff are prohibited and are grounds for withdrawing technical support.
You can manage the Sensor, Central Node and Sandbox components of the application in Technical Support Mode.
Technical Support Mode provides the Kaspersky Anti Targeted Attack Platform administrator with unrestricted access rights (root) to the application and all of its stored data (including personal information).
Working with Kaspersky Anti Targeted Attack Platform from the management console in Technical Support Mode with superuser account rights enables you to:
- Manage application operation settings using configuration files.
You can also modify the settings for data encryption when data is transferred between application nodes, and the settings for storing and processing objects being scanned.
In this case, data is transmitted in unencrypted form. The Kaspersky Anti Targeted Attack Platform administrator must use this data independently to ensure protection of servers. The Kaspersky Anti Targeted Attack Platform administrator is responsible for modifying the configuration files of the application.
- Manage settings.
Trace files may contain confidential data of the user. Such files are retained indefinitely and can be manually deleted by the administrator of Kaspersky Anti Targeted Attack Platform. The path for trace files is specified by the administrator of Kaspersky Anti Targeted Attack Platform.
To start working with the Sandbox, Sensor or Central Node component in Technical Support Mode:
- Sign in to the management console of the server whose settings you want to change via the SSH protocol or through a terminal.
- When the system prompts you, enter the administrator user name and the password that was specified during installation of the component.
The application component administrator menu is displayed.
- In the application administrator menu, select Technical Support Mode.
- Press ENTER.
This opens the Technical Support Mode confirmation window.
- Confirm that you want to manage the application in Technical Support Mode. To do so, select Yes and press ENTER.
You can proceed to manage the Central Node, Sensor, or Sandbox component in Technical Support Mode.
Managing accounts of application administrators and users
Kaspersky Anti Targeted Attack Platform provides accounts for servers with the following components:
- Sensor. Administrator account for managing the application web interface, the application administrator menu, and the server management console (in Technical Support Mode).
The 'admin' account is used by default.
- Sandbox. Administrator account for managing the application web interface, the application administrator menu, and the server management console (in Technical Support Mode).
The 'admin' account is used by default.
- Central Node. The following accounts:
- Administrator account for working in the application administrator menu and in the server management console (in Technical Support Mode).
The "admin" account that was created during application installation is used by default.
- Administrator account of the application web interface.
- Application web interface user accounts with the Security auditor, Security officer, and Senior security officer roles.
- Administrator account for working in the application administrator menu and in the server management console (in Technical Support Mode).
Data from each of these accounts is stored on the server hosting the application component to which the account belongs.
In distributed solution and multitenancy mode, data from each of these accounts is stored on the PCN and on the server hosting the application component to which the account belongs.
The administrator account used for working in the server management console has unlimited rights to manage the server hosting the application component to which the account belongs (superuser rights). Under this account, you can turn off or restart a server, or modify the settings of the application in Technical Support Mode in the server management console.
An administrator account for working in the management console of a server (admin) has unlimited access to data on that server. The password of the administrator account for working in the server management console must be strong. The administrator must take steps to ensure the security of the servers. The administrator bears responsibility for access to data stored on servers.
You can use an account with the Administrator role to manage application user accounts as well as application settings that are available to administrators of the application web interface. In distributed solution and multitenancy mode, user accounts are managed on the PCN.
An account with the Security auditor role can view all sections of the web interface available to the administrator and security personnel. A user with the Security auditor role can view data but cannot edit this data.
The Senior security officer and Security officer roles are intended for employees of your organization whose job description involves managing events, alerts, tasks of Kaspersky Anti Targeted Attack Platform and managing response actions. When logged in to the application under accounts that have these roles, you can see all sections of the application web interface that are available to security officers. Users with the Senior security officer role have access to all operations. The restrictions for users with the Security officer role are listed in the table below.
Access restrictions for application users with the Security officer role
Functional scope / Section of the web interface |
Restrictions |
|---|---|
Dashboard |
Widgets of VIP group events are not available. It is not possible to use a link in the widget to go to the Alerts section. |
Alerts |
The following actions are not available:
|
Threat Hunting |
Events that are associated with hosts from VIP group alerts are not available. |
Tasks |
No access. |
Prevention |
No access. |
Custom rules |
Read access. |
Storage |
There is no access to objects that are placed in Storage as a result of tasks. Full access to objects that were manually downloaded by the user. |
Endpoint Agents |
Access to view tables of computers with the Endpoint Agent component, and restrictions on viewing data related to tasks, policies, and network isolation. |
Network isolation of hosts |
No access. |
Reports |
No access. |
Settings: IOC scanning schedule |
Read access. |
Settings: Endpoint Agents |
Read access. |
Settings: KPSN reputation database |
No access. |
Settings: Notification rules |
No access to rules for sending notifications about alerts. Full access to rules for sending notifications about problems in application operation. |
Settings: VIP status |
Read access. |
Custom rules: YARA |
Access only to export rules. |
Settings: TAA exclusions |
Access to read and export. |
Settings: Passwords for archives |
No access. |
Settings: License |
Read access. |
If you are using the distributed solution and multitenancy mode, access to tenants and the web interface of the SCN server can be allowed or denied for each account.
Creating an administrator account for the application web interface
To create an application administrator account:
- Log in to the web interface with the application administrator account.
- In the window of the application web interface, select the Settings section, Users subsection.
- Click Add.
This opens the New user window.
- To enable an account, turn on the Status toggle switch.
By default, the account is enabled.
If the user account is enabled, the user is allowed to gain access to the application web interface. If the user account is disabled, the user is prohibited from gaining access to the application web interface.
- In the Role drop-down list, select Administrator.
- Under Authentication type, select one of the following options:
- KATA user account.
In this case, to connect to the application web interface, the user must enter the user name and password that were configured when the account was created.
- Domain user account.
In this case, to connect to the application web interface, the user does not have to enter the user name and password; the user is authenticated with the domain account.
The KATA user account and Domain user account fields are available if Active Directory integration is configured.
- KATA user account.
- If you selected KATA user account:
- In the User name field, enter a user name for the account you want to create.
The user name must satisfy the following requirements:
- Must be unique in the list of user names (case-sensitive).
- Must contain no more than 32 characters.
- Can contain letters A–Z, a–z, digits 0–9, hyphens (-), and underscores (_).
- Must begin with a letter (A–Z or a–z).
- In the New password field, enter a user password that will be used to access the web interface.
The password must satisfy the following requirements:
- Must not be the same as the user name.
- Must not contain dictionary words, popular combinations of letters, or examples of a keyboard layout (for example, Qwerty or passw0rd).
- Must contain at least 8 characters.
- Must contain at least three types of characters:
- Uppercase character (A–Z).
- Lowercase character (a–z).
- Number.
- Special character.
- In the Confirm password field, re-enter the user password that will be used to access the web interface.
- In the User name field, enter a user name for the account you want to create.
- If you selected Domain user account, in the User name field, enter the user's domain name.
- Click Add.
The application administrator account is created.
If you are using the distributed solution and multitenancy mode, the PCN server administrator account has access to the data of all organizations associated with that server.
Creating a user account for the application web interface
You can create user accounts with the Senior security officer, Security officer, and Security auditor roles.
To create a user account for the application web interface:
- Log in to the web interface with the application administrator account.
- In the window of the application web interface, select the Settings section, Users subsection.
- Click Add.
This opens the New user window.
- If necessary, disable the user account using the Status toggle switch.
By default, the account is enabled.
If the user account is enabled, the user is allowed to gain access to the application web interface. If the user account is disabled, the user is prohibited from gaining access to the application web interface.
- Under Authentication type, select one of the following options:
- KATA user account.
In this case, to connect to the application web interface, the user must enter the user name and password that were configured when the account was created.
- Domain user account.
In this case, to connect to the application web interface, the user does not have to enter the user name and password; the user is authenticated with the domain account.
If you have selected the Domain user account authentication type, note that the user will not be able to log in to the application web interface with a different user account.
The KATA user account and Domain user account fields are available if Active Directory integration is configured.
- KATA user account.
- In the Role drop-down list, select one of the following roles:
- Senior security officer
- Security officer.
- Security auditor
- If you select KATA user account:
- In the User name field, enter a user name for the account you want to create.
The user name must satisfy the following requirements:
- Must be unique in the list of user names (case-sensitive).
- Must contain no more than 32 characters.
- Can contain letters A–Z, a–z, digits 0–9, hyphens (-), and underscores (_).
- Must begin with a letter (A–Z or a–z).
- In the New password field, enter a user password that will be used to access the web interface.
The password must satisfy the following requirements:
- Must not be the same as the user name.
- Must not contain dictionary words, popular combinations of letters, or examples of a keyboard layout (for example, Qwerty or passw0rd).
- Must contain at least 8 characters.
- Must contain at least three types of characters:
- Uppercase character (A–Z).
- Lowercase character (a–z).
- Number.
- Special character.
- In the Confirm password field, re-enter the user password that will be used to access the web interface.
- In the User name field, enter a user name for the account you want to create.
- If you selected Domain user account, in the User name field, enter the user's domain name.
- In the Access section, configure access rights:
- Turn on the SCN web interface toggle switch to allow the user to access not only the web interface of this PCN server, but also to web interfaces of all available SCN servers.
- To the right of the Tenants setting title, select check boxes for one or more tenants to whose web interfaces you want to grant access.
You can use the Select all and Clear all links to select or unselect all tenants.
- Click Add.
Configuring user account table display
You can show or hide columns and change the order of columns in the table of user accounts.
To configure user account table display:
- Log in to the web interface with the application administrator account.
- In the window of the application web interface, select the Settings section, Users subsection.
- In the heading part of the table, click
 .
.This opens the Customize table window.
- If you want to show a column in the table, select the check box next to the name of the parameter that you want displayed in the table.
If you want to hide a parameter in the table, clear the check box.
At least one check box must be selected.
- If you want to change the order of columns in the table, move the mouse cursor to the row with the relevant parameter, click
 and move the row to its new place.
 - If you want to restore default table display settings, click Default.
- Click Apply.
User account table display is configured.
Page top
Viewing the user account table
The event table is displayed in the Settings section, Users subsection of the application web interface window. You can sort events in the table by the User name, Role, Tenants, and Status columns.
The table contains the following information:
- User name is the user name configured when creating the account.
- Authentication type is the authentication type of the user. Possible values:
- KATA user account.
In this authentication type is selected, to connect to the application web interface, the user must enter the user name and password that were configured when the account was created.
- Domain user account.
If this authentication type is selected, to connect to the application web interface, the user does not have to enter the user name and password; the user is authenticated with the domain account.
- KATA user account.
- Role is the role assigned to the user.
- Tenants is a list of tenants to which the user has access.
This column is displayed only in distributed solution and multitenancy mode.
- Status is the status of the account. Can have the following values:
- Enabled
If the user account is enabled, the user is allowed to gain access to the application web interface.
- Disabled
If the user account is disabled, the user is prohibited from gaining access to the application web interface.
- Enabled
Filtering user accounts
To filter or search for user accounts by required criteria:
- Log in to the web interface with the application administrator account.
- In the window of the application web interface, select the Settings section, Users subsection.
- Depending on the filtering criterion, do the following:
The table displays accounts that correspond to configured filter criteria.
You can use multiple filters at the same time.
Clearing the account filter
To clear the user account filter by one or more filtering conditions:
- Log in to the web interface with the application administrator account.
- In the window of the application web interface, select the Settings section, Users subsection.
- Click
 to the right of the header of the user account table column for which you want to clear the filtering conditions.
If you want to clear several filter conditions, perform the necessary actions to clear each filter condition.
The selected filters are cleared.
The table displays only user accounts that match the specified criteria.
Changing access rights of an application web interface user account
You can change access rights of users with Senior security officer and Security officer roles to data of PCN and SCN servers as well as tenants to which those servers belong.
To change access rights of an application web interface user account, do the following in the web interface of the PCN:
- Log in to the web interface with the application administrator account.
- In the window of the application web interface, select the Settings section, Users subsection. Select the account whose access rights you want to change.
This opens the Edit user account window.
- If you want to enable or disable an account, move the Status toggle switch.
- In the Access section, move the SCN web interface toggle switch as necessary:
- Set the toggle switch to Enabled if you want to grant the user access to web interfaces of all available SCN servers in addition to the web interface of this PCN server.
- Set the toggle switch to Disabled if you want to grant the user access only to the web interface of this PCN server.
- To the right of the Tenants setting name, select or clear check boxes of one or more tenants for which you want to change the access rights of server web interfaces.
You can use the Select all and Clear all links to select or unselect all tenants.
- Click Save.
The access rights of the account are changed.
Enabling and disabling an administrator account or user account of the application web interface
To enable or disable an administrator account or user account for the application web interface, do the following in the web interface of the PCN:
- Log in to the web interface with the application administrator account.
- In the window of the application web interface, select the Settings section, Users subsection.
- In the list of accounts, select the user account that you want to enable or disable.
- In the Status column, do one of the following:
- Turn on the toggle switch next to the name of an account if you want to enable the account.
- Turn off the toggle switch next to the name of an account if you want to disable the account.
The action confirmation window is displayed.
- Click Yes.
The state of the account is modified.
Changing the password of an application administrator or user account
Only users with the KATA user account authentication type can change the password of their user account.
To change the password of an application administrator account or user account, do the following in the web interface of the PCN:
- Log in to the web interface with the application administrator account.
- In the window of the application web interface, select the Settings section, Users subsection. In the list of accounts, select the user account whose password you want to change.
This opens the Edit user account window.
- In the New password field, enter a new password for the application web interface.
The password must satisfy the following requirements:
- Must not be the same as the user name.
- Must not contain dictionary words, popular combinations of letters, or examples of a keyboard layout (for example, Qwerty or passw0rd).
- Must contain at least 8 characters.
- Must contain at least three types of characters:
- Uppercase character (A–Z).
- Lowercase character (a–z).
- Number.
- Special character.
- In the Confirm password field, enter the new password again.
- Click Save.
The password of the application administrator account or user account is changed.
Changing the password of your account
Only users with the KATA user account authentication type can change the password of their user account.
To change the password of your user account:
- Sign in to the web interface with your account.
- In the lower part of the program web interface window, click the link with the name of your account to expand the action list.
- Select the Change password action.
This opens the Change password window.
- In the Old password field, enter the current password for the application web interface.
- In the New password field, enter a new password for the application web interface.
The password must satisfy the following requirements:
- Must not be the same as the user name.
- Must not contain dictionary words, popular combinations of letters, or examples of a keyboard layout (for example, Qwerty or passw0rd).
- Must contain at least 8 characters.
- Must contain at least three types of characters:
- Uppercase character (A–Z).
- Lowercase character (a–z).
- Number.
- Special character.
- In the Confirm password field, enter the new password again.
- Click Change password.
The user account password for accessing the application web interface is changed.
Authentication using domain accounts
If authentication using domain accounts is configured, users do not have to enter Kaspersky Anti Targeted Attack Platform account credentials to connect to the application web interface.
To enable authentication using domain accounts:
- Configure integration with Active Directory.
To set up the Active Directory integration, you must create a keytab file containing the
for the Central Node server on which you want to set up the integration. - Select the Domain user account authentication type for the user when creating the account.
Creating a keytab file
You can create one user account to authenticate at multiple Central Node servers. Service principal name (SPN)To do so, you must create a
that contains service principal names (hereinafter also SPN) for each of these servers. When you create the keytab file, you must use an attribute to generate a salt (hash function input modifier).The generated salt must be saved in any convenient way for adding more SPNs to the keytab file in the future.
You can also create a separate Active Directory user account for each Central Node server for which you want to set up Kerberos authentication.
To create a keytab file using one user account:
- On the domain controller, in the Active Directory Users and Computers snap-in, create a user account (for example, with
control-useras its name). - If you want to use the AES256-SHA1 encryption algorithm, in the Active Directory Users and Computers snap-in:
- Open the properties of the user account that you have created.
- On the Account tab, select the This account supports Kerberos AES 256 bit encryption check box.
- Use the ktpass utility to create a keytab file for the
control-useruser. To do so, run the following command on the command line:C:\Windows\system32\ktpass.exe -princ HTTP/<fully qualified domain name (FQDN) of the Central Node server>@<realm name of the Active Directory domain in uppercase> -mapuser control-user@<realm name of the Active Directory domain in uppercase> -crypto AES256-SHA1 -ptype KRB5_NT_PRINCIPAL -pass * +dumpsalt -out <path to the file>\<file name>.keytabThe utility requests the
control-userpassword when executing the command.The SPN of the selected server is added to the created keytab file. The generated salt is displayed on screen:
Hashing password with salt "<hash value>". - Add an SPN record for each subsequent Central Node server to the keytab file. To do so, run the following command:
C:\Windows\system32\ktpass.exe -princ HTTP/<fully qualified domain name (FQDN) of the Central Node server>@<realm name of the Active Directory domain in uppercase> -mapuser control-user@<realm name of the Active Directory domain in uppercase> -crypto AES256-SHA1 -ptype KRB5_NT_PRINCIPAL -pass * -in <path and name of the previously created file>.keytab -out <path and new name>.keytab -setupn -setpass -rawsalt "<hash value of the salt obtained when creating the keytab file at step 3>"The utility requests the
control-userpassword when executing the command.
The keytab file is created. This file contains all added SPNs of selected servers.
Example: For example, you need to create a keytab file containing SPN names of 3 servers: To create a
Let's say you got To add another SPN, run the following command:
To add a third SPN:
This creates a |
To create a keytab file using a separate account for each Central Node server:
- On the domain controller server, in the Active Directory Users and Computers snap-in, create a separate user account for each server (for example,
control-user,secondary1-user,secondary2-user, etc). - If you want to use the AES256-SHA1 encryption algorithm, in the Active Directory Users and Computers snap-in:
- Open the properties of the user account that you have created.
- On the Account tab, select the This account supports Kerberos AES 256 bit encryption check box.
- Use the ktpass utility to create a keytab file for the
control-useruser. To do so, run the following command on the command line:C:\Windows\system32\ktpass.exe -princ HTTP/<fully qualified domain name (FQDN) of the Central Node server>@<realm name of the Active Directory domain in uppercase> -mapuser control-user@<realm name of the Active Directory domain in uppercase> -crypto AES256-SHA1 -ptype KRB5_NT_PRINCIPAL -pass * -out <path to the file>\<file name>.keytabThe utility requests the
control-userpassword when executing the command.The SPN of the selected server is added to the created keytab file.
- Add an SPN record for each subsequent Central Node server to the keytab file. To do so, run the following command:
C:\Windows\system32\ktpass.exe -princ HTTP/<fully qualified domain name (FQDN) of the Central Node server>@<realm name of the Active Directory domain in uppercase> -mapuser secondary1-user@<realm name of the Active Directory domain in uppercase> -crypto AES256-SHA1 -ptype KRB5_NT_PRINCIPAL -pass * -in <path and name of the previously created file>.keytab -out <path and new name>.keytabThe utility requests the
secondary1-userpassword when executing the command.
The keytab file is created. This file contains all added SPNs of selected servers.
Example: For example, you need to create a keytab file containing SPN names of 3 servers: To create a
To add another SPN, run the following command:
To add a third SPN:
This creates a |
Configuring integration with Active Directory
To configure integration with Active Directory:
- Log in to the web interface with the application administrator account.
- In the window of the application web interface, select the Settings section, Users subsection.
- Go to the Active Directory integration tab.
- Select the Integration check box if you want to enable integration with Active Directory.
- Click Browse to upload the keytab file.
- Select the keytab file and click Open.
After you upload the file, the following fields are displayed:
- Keytab file status. Possible values:
- File contains SPN for this server means the uploaded keytab file contains the SPN for that Kaspersky Anti Targeted Attack Platform server.
- No SPN for this server means the uploaded keytab file does not contain the SPN for that Kaspersky Anti Targeted Attack Platform server.
- File contents is the list of SPNs that the file contains.
- Keytab file status. Possible values:
- Click Apply.
Integration with Active Directory is configured.
In distributed solution and multitenancy mode, Active Directory integration settings configured on the PCN server are not applied to SCN servers connected to that PCN server. If you want to set up Active Directory integration on individual SCN servers, you must complete the steps above on each of the selected SCN servers.
Page top
Disabling integration with Active Directory.
When integration with Active Directory is disabled, user authentication with domain accounts is not available.
To disable integration with Active Directory:
- Log in to the web interface with the application administrator account.
- In the window of the application web interface, select the Settings section, Users subsection.
- Go to the Active Directory integration tab.
- Clear the Integration check box.
- Click Apply.
Integration with Active Directory is disabled. The uploaded keytab file is permanently deleted.
In distributed solution and multitenancy mode, Active Directory integration settings configured on the PCN server are not applied to SCN servers connected to that PCN server. If you want to disable Active Directory integration on individual SCN servers, you must complete the steps above on each of the selected SCN servers.
Page top
Participation in Kaspersky Security Network and use of Kaspersky Private Security Network
To protect the user's computer more effectively, Kaspersky Anti Targeted Attack Platform uses data that is obtained from users around the globe. Kaspersky Security Network is designed to obtain such data.
Kaspersky Security Network (hereinafter also "KSN") is an infrastructure of online services that provides users with access to the Kaspersky online knowledge base containing information on the reputation of files, web resources, and software. Use of data from Kaspersky Security Network ensures that Kaspersky Anti Targeted Attack Platform responds faster to new objects that have not yet been added to the anti-virus databases, improves the performance of some protection components, and reduces the likelihood of false alarms.
Thanks to users who participate in Kaspersky Security Network, Kaspersky is able to promptly receive information about the types and sources of objects that have not yet been added to the anti-virus databases, develop solutions for neutralizing them, and minimize the number of false alarms. User participation also helps other users of Kaspersky Security Network promptly receive information about threats to the IT infrastructure of their organizations.
When you participate in Kaspersky Security Network, Kaspersky Anti Targeted Attack Platform sends Kaspersky Security Network requests about the reputation of files, web resources and software, and receives a response containing data about the reputation of those objects.
Personal information of the user is not collected, processed, or stored. For information about data that Kaspersky Anti Targeted Attack Platform sends to Kaspersky Security Network, refer to the KSN Statement.
Participation in Kaspersky Security Network is voluntary. The decision to participate in Kaspersky Security Network is made during installation of Kaspersky Anti Targeted Attack Platform, and that decision can be changed at any time.
If you do not want to participate in KSN, you can use Kaspersky Private Security Network (hereinafter also referred to as "KPSN"). KPSN is a solution that allows users to access the reputation databases of Kaspersky Security Network and other statistical data without actually sending data from their own computers to Kaspersky Security Network.
If you want to purchase the Kaspersky Private Security Network application, please contact Kaspersky partners in your region.
Participation in KSN is configured on the Central Node server and is applied to all connected Sensor servers.
If you are using the distributed solution and multitenancy mode, participation in KSN is configured on the PCN server. Configured participation in KSN is applied to all SCN servers connected to the PCN.
The update functionality (including anti-virus signature updates and code base updates), as well as the KSN functionality may be unavailable in the territory of the USA.
Viewing the KSN Statement and configuring participation in KSN
To configure the participation in Kaspersky Security Network:
- Log in to the application web interface with the administrator account.
- Select the Settings section, KSN/KPSN and MDR subsection.
- On the right of the Connection type parameter name, click the KSN button.
- Carefully read the Kaspersky Security Network Statement and select one of the following options:
- I agree to participate in KSN, if you accept the terms of the KSN Statement and want to participate in KSN.
- I do not agree to participate in KSN, if you do not accept the terms of the KSN Statement and do not want to participate in KSN.
If you do not agree with the terms of the Statement, use of Kaspersky Security Network will not be enabled.
- Click Apply.
Participation in Kaspersky Security Network will be configured.
Enabling the use of KPSN
To enable the use of KPSN:
- Log in to the application web interface with the administrator account.
- Select the Settings section, KSN/KPSN and MDR subsection.
- On the right of the Connection type parameter name, click the KPSN button.
- In the KPSN configuration files section, upload the client_config.xms, helper_config.xms and keystore.dat files by clicking Browse.
- Click Apply.
Use of Kaspersky Private Security Network will be enabled.
Configuring a connection to a local reputation database of KPSN
The application can save information about Sandbox component alerts to the
. In this case, the Untrusted status is assigned to objects. Data of local reputation databases is available only to corporate LAN computers.If you are using the distributed solution and multitenancy mode, use the web interface of the PCN or SCN server for which you want to configure parameters.
To configure the connection of Kaspersky Anti Targeted Attack Platform to a local KPSN reputation database:
- Log in to the application web interface with the administrator account.
- Select the Settings section, KPSN reputation database subsection.
- In the Host field, specify the IP address of the KPSN server on which the local reputation database of KPSN is stored.
- Click Browse to the right of the TLS certificate field.
This opens the file selection window.
- Select the certificate file for user authentication in KPSN and click the Open button.
- Click Browse to the right of the TLS encryption key field.
This opens the file selection window.
- Select the file containing the private encryption key, and click the Open button.
The connection to the local reputation database of KPSN will be configured.
Configuring information to be saved to a local reputation database of KPSN
The application can save MD5 and SHA256 hashes of objects detected by the Sandbox component in the
. In this case, the Untrusted status is assigned to objects. Data of local reputation databases is available only to corporate LAN computers.To configure the saving of objects detected by the Sandbox component to the local reputation database of KPSN:
- Log in to the application web interface under the senior security officer account.
- Select the Settings section, KPSN reputation database subsection.
- Do one of the following:
- Turn on the Assign the "Untrusted" status to objects switch if you want the application to set the status of objects to Untrusted and save information about them in the local reputation database of KPSN.
- Turn off the Assign the "Untrusted" status to objects switch if you do not want to save information about detected objects in the local reputation database of KPSN.
- Click Save.
The saving of information to the local reputation database of KPSN is configured.
Declining participation in KSN and use of KPSN
To decline participation in Kaspersky Security Network and the use of KPSN:
- Log in to the application web interface with the administrator account.
- Select the Settings section, KSN/KPSN and MDR subsection.
- On the right of the Connection type parameter name, click the Not connected button.
- Click Apply.
You will not participate in KSN and will not use KPSN.
Managing the Sandbox component through the web interface
The Sandbox web interface is located on the server hosting the Sandbox component.
The Sandbox web interface is protected against CSRF attacks and operates only if the web interface user's browser provides the Referrer header of an HTTP POST request. Make sure that the browser that you are using to work with the Sandbox web interface does not modify the Referrer header of an HTTP POST request. If the connection with the web interface is established through a proxy server of your organization, check the settings and make sure that the proxy server does not modify the Referrer header for an HTTP POST request.
To get started with the web interface of the Sandbox application:
- In a browser on any computer on which access to the server with the Sandbox component is allowed, enter the IP address of the server with the Sandbox component.
This opens the Sandbox component administrator credentials input window.
- Enter the Sandbox component administrator user name and password that you specified when installing the Sandbox component.
You can now start working in the Sandbox web interface.
If you use more than one servers with the Sandbox component, configure settings of each Sandbox component from the Sandbox web interface of such server.
Updating the Sandbox component databases
The Sandbox component databases are files with records that make it possible to detect a malicious code and signs of suspicious behavior in scanned objects.
Virus analysts at Kaspersky detect hundreds of new threats daily, create records to identify them, and include them in database upgrade packages (or upgrade packages). Upgrade packages consist of one or more files containing records to identify threats that were detected since the previous upgrade package was released. We recommend that you regularly receive upgrade packages.
During the license validity period, you can obtain update packages automatically once every hour or update the databases manually.
Updating databases manually
To start a database update manually:
- Select the Database update section in the Sandbox web interface window.
The Last update settings group will show time and status of the last Sandbox database update.
- Click Start.
Selecting a database update source
To select a database update source:
- Select the Database update section in the Sandbox web interface window.
- In the Update source settings group, select a source from which you want to receive upgrade packages:
- Kaspersky update server.
The program connects to Kaspersky update server over HTTP and downloads up-to-date databases.
- Kaspersky update server (secure connection).
The program connects to Kaspersky update server over HTTPS and downloads up-to-date databases. It is recommended to use HTTPS for database updates.
- Custom server.
The program connects to your FTP or HTTP server or to the folder with program databases on your computer to download up-to-date databases.
- Kaspersky update server.
- If you select Custom server, in the field under the name of the setting, enter the full path to the folder that contains the application database update package.
- Click Apply in the lower part of the window.
Enabling and disabling a proxy server for database update
To enable or disable a proxy server for updating the Sandbox component databases:
- Select the Database update section in the Sandbox web interface window.
- In the workspace, do one of the following:
- Enable the switch next to the Proxy server settings group name if you want to use the proxy server for the Sandbox component database update.
- Disable the switch next to the Proxy server settings group name if you do not want to use the proxy server for the Sandbox component database update.
Configuring proxy server connection settings for database update
To configure the proxy server connection for updating Sandbox component databases:
- Select the Database update section in the Sandbox web interface window.
- Enable the switch next to the Proxy server settings group name.
- In the Address field, enter the proxy server address.
- In the Port field, enter the proxy server port number.
- In the User name field, enter the proxy server user name.
- In the Password field, enter the password to obtain connection to the proxy server.
- Do one of the following:
- Select the Bypass proxy server for local addresses check box if you do not want to use the proxy server for internal IP addresses of your organization.
- Clear the Bypass proxy server for local addresses check box if you want to use the proxy server irrespective of whether the IP addresses belong to your organization.
- Click Apply in the lower part of the window.
Configuring connection between the Sandbox and Central Node components
The following procedure is used to configure the Sandbox component connection with the Central Node component:
- A request for connection to the Sandbox component is created in the application web interface.
- The Sandbox web interface shows connection requests.
You can accept or reject the request.
After configuring the connection, the Sandbox server needs 5 to 10 minutes to get ready for operation. During this time, the System health window of the application web interface display a warning: A problem occurred with the standard configuration. When the server is ready for operation, the warning disappears.
Processing connection requests from the Central Node servers in the Sandbox web interface
You can accept, reject, or revoke a previously accepted connection request from the Central Node servers in the Sandbox web interface.
To accept, reject, or revoke a connection request from Central Node servers:
- Select the Authorization section in the window of the Sandbox web interface.
The Central Node connection requests section will show a list of connection requests from the Central Node components.
Each connection request contains the following information:
- IP—IP address of the Central Node server.
- Certificate fingerprint—Thumbprint of the Central Node TLS certificate used to establish an encrypted connection between servers.
- State—Status of the connection request.
May have the values Pending or Accepted.
- Make sure that the Central Node certificate thumbprint matches the certificate thumbprint configured for the Central Node.
You can check the Central Node certificate thumbprint from the Central Node server administrator menu in the Manage Server Certificate section.
- Click one of the following buttons in the line containing the connection request from the Central Node component:
- Accept if you want to accept the connection request.
- Reject if you want to reject the connection request.
- Revoke if you want to revoke a previously accepted connection request.
- Click Apply in the lower part of the window.
Configuring the Sandbox component network interfaces
This section describes configuration of the Sandbox component network interfaces.
Configuring DNS settings
To configure DNS:
- Select the Network interfaces section in the window of the Sandbox web interface.
- In the Host name field, enter the name of the server on which you are installing the Sandbox component in FQDN format (for example, sandbox).
- To the right of the DNS servers parameter name, click the Add button.
This will add an empty field for the DNS server IP address input.
- Enter the IP address of the primary DNS server in IPv4 format.
- Click the
 button to the right of the entry field.
The DNS server will be added.
- If you want to add an additional DNS server, repeat steps 2-5.
- If you want to remove a previously added DNS server, click the
 button to the right of the line containing the DNS server IP address.
You can only remove additional DNS servers. You cannot remove the primary DNS server. If you added 2 and more DNS servers, you can remove any of them, and the remaining DNS server will be used as the primary server.
Configuring settings of the management network interface
A management network interface is intended for providing access to the server with the Sandbox component via the SSH protocol, and the Sandbox component will also receive objects from the Central Node component via this interface.
You can configure a management network interface during installation of the Sandbox component.
You can also configure a management network interface from the Sandbox web interface.
To configure a management network interface from the Sandbox web interface:
- Select the Network interfaces section in the window of the Sandbox web interface.
- In the Management interface settings group from the Interface drop-down list, select a network interface, which you want to use as a management interface.
- In the IP field, enter the IP address that you want to assign to this network interface if no IP address is assigned.
- In the Mask field, enter the network mask in which you want to use this network interface.
- Click Apply in the lower part of the window.
Configuring settings of a network interface used for Internet access of processed objects
Objects processed by the Sandbox component may attempt activities on the Internet via the network interface used for Internet access of processed objects. The Sandbox component can analyze the behavior of these objects.
If you block Internet access, the Sandbox component cannot analyze the behavior of objects on the Internet, and will therefore only analyze the behavior of objects without Internet access.
The network interface used for Internet access of processed objects must be isolated from the local network of your organization.
If the security policy of your organization denies access to the Internet from computers of local network users, and you have configured the Sandbox network interface for Internet access of processed objects, there is a risk of the following scenario:
A hacker can attach a malicious application to a random file and initiate a Sandbox scan of this file from the computer of a local network user. This file will be taken over outside the local network through the network interface used for Internet access of processed objects in the course of scanning the file by the Sandbox component.
Unavailability of the Sandbox network interface for Internet access of processed objects eliminates any risk of such data transfer but compromises the quality of alerts.
To configure the network interface used for Internet access of processed objects:
- Select the Network interfaces section in the window of the Sandbox web interface.
- In the Internet interface settings group from the Interface list, select a network interface that you want to use for Internet access of processed objects.
The management network interface that you configured previously cannot be selected from this list of network interfaces.
- In the IP field, enter the IP address that you want to assign to this network interface.
- In the Mask field, enter the network mask in which you want to use this network interface.
- In the Default gateway field, enter the gateway address of the network in which you want to use this network interface.
- Click Apply in the lower part of the window.
Adding, changing and removing static network routes
You can configure static network routes during installation of the Sandbox component.
You can also add, remove or change static network routes from the Sandbox web interface.
To add a static network route:
- Select the Network interfaces section in the window of the Sandbox web interface.
- In the Static routes settings group, click the Add button.
A line with empty fields will be added in the list of static network routes.
- In the IP field, enter the IP address of the server for which you want to configure a static network route.
- In the Mask field, enter the subnet mask.
- In the Gateway field, enter the IP address of the gateway.
- From the Interface list, select a network interface for which you want to add a static network route.
- Click .
- Click Apply in the lower part of the window.
To remove a static network route, proceed as follows:
- Select the Network interfaces section in the window of the Sandbox web interface.
- In the Static routes settings group in the line containing the static network route that you want to remove, click the button.
- Click Apply in the lower part of the window.
To modify a static network route:
- Select the Network interfaces section in the window of the Sandbox web interface.
- In the Static routes settings group in the line containing the static network route that you want to change, click the
 button.
The static network route line will become editable. You can change one or more parameters of a static network route.
- In the IP field, change the IP address of the server for which you want to configure a static network route.
- In the Mask field, change the subnet mask.
- In the Gateway field, change the IP address of the gateway.
- From the Interface list, select the network interface for which you are editing the network route.
- Click .
- Click Apply in the lower part of the window.
Setting the Sandbox system date and time
To set the date and time on the server hosting the Sandbox component:
- In the Sandbox web interface window, select Date and time.
- In the Country drop-down list, select the relevant country.
- In the Time zone drop-down list, select the relevant time zone.
- If you prefer to synchronize the time with the NTP server, select Synchronization with NTP servers.
- If you prefer to set the date and time manually, do not enable the switch to the right of the Synchronization with NTP servers parameter name and proceed as follows:
- In the Date field, enter the current date or click the
 button and select a date in the calendar.
 - In the Time field, enter the current time.
- In the Date field, enter the current date or click the
- Click Apply in the lower part of the window.
Installing and configuring images of operating systems and applications required for the operation of the Sandbox component
To scan objects, you can use your own (hereinafter also referred to as "custom") images of operating systems as well as preset images from the distribution kit. If you are using custom images, you can install any applications on these operating systems. The selection of applications for the preset images from the distribution kit cannot be modified.
The distribution kit includes preset ISO images of operating systems and applications required for the Sandbox component to work. Some operating systems and applications require activation.
The Sandbox component runs objects in selected operating systems and analyzes the behavior of these objects to detect malicious activity and indicators of targeted attacks and intrusions into the corporate IT infrastructure.
You can use custom and preset operating system images at the same time.
To use an operating system image for scanning objects by the Sandbox component, you must create a virtual machine for that image.
We strongly recommend that you use all of the necessary and available preset operating system images from the distribution kit on each Sandbox server. If only some of the images from the distribution kit or only custom images are used, objects may be scanned with a reduced quality. |
Creating virtual machines with preset images of operating systems from the distribution kit
Creating virtual machines with preset images of operating systems involves the following steps:
Creating virtual machines with custom images of operating systems
Creating virtual machines with custom images of operating systems involves the following steps:
- Uploading the image of the operating system and applications that you want to install on the operating system to the Sandbox Storage.
You can skip this step and upload the images while creating and editing a template.
- Create or import a custom template.
- Creating a virtual machine
- Installing the virtual machine
In case of problems with activation of operating systems or applications, the web interface of the Sandbox component displays an error message. If this happens, please contact Kaspersky Technical Support.
Page top
Managing operating system and application images in the Sandbox Storage
Custom images of operating systems and applications that you want to install on these operating systems are placed in Sandbox Storage.
You can upload the following custom operating system images to Storage:
- Windows XP SP3 or later
- Windows 7
- Windows 8.1 64-bit
- Windows 10 64-bit (up to version 1909)
Uploaded files must have the .ISO extension.
Uploading custom images of Linux operating systems is not supported.
If you want to use custom operating system images in a template, you must configure those operating systems.
Page top
Viewing the table of operating system and application images in Sandbox Storage
To view the table of operating system and application images in Sandbox Storage:
- In the Sandbox web interface window, select the Templates & Storage section.
- Go to the Storage section.
The table of operating system and application images in Sandbox Storage is displayed.
The table contains the following information:
- Uploaded is the image upload time.
- Name is the name of the image.
- Size is the size of the image.
- Actions are operations available for the image. Possible values: Create VM, Export, Delete.
Uploading operating system and application images to Storage
To upload to Storage the custom images of operating systems and applications that you want to install on these operating systems:
- In the Sandbox web interface window, select the Templates & Storage section.
- Go to the Storage section.
- Click Upload.
- This opens the file upload window.
- Select the .ISO file that you want to upload to Storage.
- Click Open.
If you want to upload multiple images, repeat steps 1 to 6 for each image.
The image is uploaded to Storage and displayed in the table of objects.
Page top
Activating operating system and application images in Sandbox Storage
You can create a virtual machine with non-activated images of Windows 7 (64-bit), Windows 10 (64-bit) and applications required by the Sandbox component and activate them using your own license code after installing the virtual machine.
Windows images and the Microsoft Office suite can be activated using the kata_images.py file. This file is part of the distribution kit.
Correct activation of Windows images and the Microsoft Office suite requires Internet access. Make sure Internet access is configured correctly.
During the activation procedure in the Dashboard section, the Central Node alerts you to a self-diagnostics error of Sandbox. After successful activation, the Sandbox self-diagnostics error is no longer displayed. During activation, objects are not sent to Sandbox for scanning.
To activate Windows images and the Microsoft Office suite:
- Make sure that virtual machines with non-activated images of Windows 7 (64-bit), Windows 10 (64-bit) and the Microsoft Office suite are created and installed.
- Use SSH to place the kata_images.py file on the Central Node server:
scp ./kata_images.py admin@<IP address of the Sandbox server>: - Log in to the management console of the server with the Sandbox component via the SSH protocol or through a terminal.
- When the system prompts you, enter the administrator user name and the password that was set during the installation of the application.
The administrator menu of the Sandbox server is displayed.
- In the application administrator menu, select Technical Support Mode.
- Press ENTER.
This opens the Technical Support Mode confirmation window.
- Select Yes and press ENTER.
- Activate the Windows images and the Microsoft Office suite by running the following sequence of commands:
cd /var/opt/kaspersky/apt/filessudo -s./kata_images.py activate --vm_id Win7_x64 --component Win7 --key <Windows 7 64 bit activation code>./kata_images.py activate --vm_id Win7_x64 --component Office2010 --key <Microsoft Office 2010 activation code>./kata_images.py activate --vm_id Win10_x64 --component Win10 --key <Windows 10 64 bit activation code>./kata_images.py activate --vm_id Win10_x64 --component Office2016 --key <Microsoft Office 2016 activation code>
The activation code has the following format: XXXXX-XXXXX-XXXXX-XXXXX-XXXXX.
- Create recovery points for virtual machines with added license keys:
./kata_images.py snapshot --vm_ids Win7_x64,Win10_x64The process may take some time.
- Make sure the Dashboard section of the application web interface does not display any warnings about the Sandbox component not working.
Windows images and the Microsoft Office suite are activated. You must activate images of Windows operating systems and the Microsoft Office application suite on all Sandbox servers.
Deleting operating system and application images from Sandbox Storage
To remove an operating system or application image from Sandbox Storage:
- In the Sandbox web interface window, select the Templates & Storage section.
- Go to the Storage section.
- In the Action column next to the relevant image, click Delete.
This opens the action confirmation window.
- Click Yes.
The image is deleted.
Page top
Managing virtual machine templates
Virtual machines are created from templates. To create a virtual machine, you must first import or create a template for it. Multiple virtual machines can be created based on the same template.
You can perform the following operations with templates: view the table of templates, enable or disable templates, edit, export, or delete templates.
Operations with the template are not available if a virtual machine with a custom operating system image is being created or installed from this template. After the virtual machine creation and installation process is complete, you can again perform operations with the template.
Page top
Creating a virtual machine template
To create a virtual machine with the selected operating system, you must first create a template for it.
To create a template for a virtual machine:
- In the Sandbox web interface window, select the Templates & Storage section.
- Go to the Templates section.
- From the Add drop-down list, select Create template.
This opens the template creation window.
- At the Preparing the image step:
- In the Name field, type the name of the template.
- In the Description field, enter the template description. This field is optional.
- In the OS image drop-down list, do one of the following:
- Select the operating system image that you want to use for the template from the list of available images.
For an image to be displayed in the list, you must first upload it to Storage.
- To upload the operating system image, click the Upload link, select the relevant file, and click Open.
The uploaded file must have the ISO extension.
- Select the operating system image that you want to use for the template from the list of available images.
- Click Proceed.
- At the Customizing the template step, do one of the following:
- In the Mount ISO drop-down list, select the image of the application that you want to install in the operating system.
For the image to be displayed in the list, do one of the following:
- Upload the image to Storage.
- In the Mount ISO drop-down list, click the Upload link, select the relevant file, and click Open.
The uploaded file must have the ISO extension.
- If you want to unmount the installed image, in the Mount ISO drop-down list, click the
 icon next this image.
 - Configure the operating system and installed software.
- In the Shut down drop-down list, you can do one of the following:
- Shut down if you want to shut down the system while saving the results of running applications.
- Power off if you want to shut down the system without saving the results.
If a template is enabled, you cannot create a virtual machine from it, and you cannot export the template. If you want to continue configuring the template, enable it.
- In the Mount ISO drop-down list, select the image of the application that you want to install in the operating system.
The virtual machine template is created. You can create a virtual machine based on it.
Page top
Viewing the table of templates
To view the table of templates:
- In the Sandbox web interface window, select the Templates & Storage section.
- Go to the Templates section.
The table of templates is displayed.
The table contains the following information:
- Created is the template creation time.
- Type is the type of operating system: custom or preset.
- Name is the name of the template.
- Status is the status of the template, for example, Power on or Powered off.
- Size is the size of the template.
- OS is the version of the operating system used for the template.
- VMs is the virtual machine created based on this template.
- Actions are operations available for the template. The following operations are available: Create VM, Export (
 ), Delete (
 ).
). - Description is the description specified when creating a template.
Turning a template on or off
If the template is turned off, you can perform the following operations with it: create a virtual machine based on the template, export, or delete it. If a template is turned on, you can edit it.
To turn a template on or off:
- In the Sandbox web interface window, select the Templates & Storage section.
- Go to the Templates section.
- Select the relevant template.
- In the Customizing the template section, do one of the following:
- If you want to turn on the template, click Power on in the template management console.
- If you want to turn off the template, select one of the options in the Shut down drop-down list in the template management console:
- Shut down if you want to shut down the system while saving the results of running applications.
- Power off if you want to shut down the system without saving the results.
The template is turned on or off.
Page top
Edit template
To edit a template:
- In the Sandbox web interface window, select the Templates & Storage section.
- Go to the Templates section.
- Select the relevant template.
- If the template is turned off, turn it on by clicking Power on.
- If you want to install an application on the operating system that is used for the template, select the relevant application image from the Mount ISO drop-down list.
For an image to be displayed in the list, you must first upload the image to Storage.
- If you want to unmount the installed image, in the Mount ISO drop-down list, click the Unmount icon next to that image.
- Configure the operating system and installed software.
The template is edited.
Page top
Configuring the operating system and software
Preparing operating systems for use
When installing Windows 7, 8.1, or 10 operating systems, you must satisfy the following requirements:
- Disable the screen saver.
- Select the Always On power plan.
- Disable automatic updates.
- Disable Windows Firewall.
If you are using Windows 7, support of the SHA-2 hash algorithm is required. To make sure this hash algorithm is supported, install the Security Update for Windows 7 for x64-based Systems (KB3033929). For 32-bit Windows 7 operating systems, update KB3033929 must also be installed.
Do not install update KB4474419. This update may cause a crash during virtual machine deployment.
To use Windows 7, you must enable TLS 1.1 and TLS 1.2 in the operating system settings. To do this, in Windows 7, in the Control Panel → Internet Options → Advanced section, select the Use TLS 1.1 and Use TLS 1.2 check boxes.
When using Windows 8.1 and 10 operating systems, you must disable fast startup and enable autologon.
Localization of operating systems
You can select a localization language when installing the system or install the system with English localization and additionally install a localization package in that system. You can select one of the following languages: Russian, English, Chinese (Simplified), Arabic, Spanish (Mexico). If you select a different localization, the quality of object scanning is diminished.
For the Windows XP operating system, only Russian and English are supported.
Configuring operating systems
When the operating system is installed:
- Make sure the default command shell is configured.
- Activate the operating system and other licensed software.
You can do the following with the installed operating system:
- Assign a static name to the computer.
- Create user accounts.
In this case, you need to configure automatic logon.
- Install software.
Limitations on software installation:
- Only one image at a time can be connected to one template. After the template has been saved, you can disconnect one image and mount another.
- Versions of Microsoft Office later than 2016 are not supported.
- Installing the following types of software is strongly discouraged:
- Software that injects its code into another running process
- Drivers for protection
- Anti-virus applications including Windows Defender
- Detection of malicious activity of files that rely on highly specialized software to run is not guaranteed.
Kaspersky Anti Targeted Attack Platform does not notify about problems with software installed on the operating system.
Page top
Exporting a template
You can export a template in one of the following ways:
- In the table of templates.
- When viewing a template.
The template must be turned off.
To export a template in the table of templates:
- In the Sandbox web interface window, select the Templates & Storage section.
- Go to the Templates section.
- In the Action column next to the relevant image, click .
The template is exported. The file download starts automatically.
To export a template when viewing a template:
- In the Sandbox web interface window, select the Templates & Storage section.
- Go to the Templates section.
- Select the relevant template.
- In the Actions drop-down list, select Export.
The file download starts automatically. The file download starts automatically.
Page top
Importing a template
You can import a previously created template.
To import a template:
- In the Sandbox web interface window, select the Templates & Storage section.
- Go to the Templates section.
- In the Add drop-down list, select Import template.
- This opens the file upload window.
- Select the file that you want to import.
- Click Open.
The template appears in the list of templates.
You can edit a template, create a virtual machine from it, export, or delete it.
Page top
Deleting a template
When you delete a template, all virtual machines created based on that template are deleted.
You can delete a template in one of the following ways:
- In the table of templates.
- When viewing a template.
The template must be turned off.
To delete a template in the table of templates:
- In the Sandbox web interface window, select the Templates & Storage section.
- Go to the Templates section.
- In the Action column next to the relevant image, click .
This opens the action confirmation window.
- Click Yes.
The template is deleted.
To delete a template when viewing a template:
- In the Sandbox web interface window, select the Templates & Storage section.
- Go to the Templates section.
- Select the relevant template.
- In the Actions drop-down list, select Delete.
This opens the action confirmation window.
- Click Yes.
The template is deleted.
Page top
Managing virtual machines
You can create, install, or delete installed virtual machines and virtual machines pending installation. You can also view lists of virtual machines with preset and custom operating systems.
Page top
Creating the virtual machine
You can create a virtual machine in one of the following ways:
- In the Virtual machines section.
- In the table of templates.
- In the template view.
The virtual machine template must be turned off. After the virtual machines is created, it must be installed.
Internet access is required to create a virtual machine with a custom operating system image.
Page top
Creating a virtual machine in the Virtual machines section
To create a virtual machine with a preset operating system image in the Virtual machines section:
- In the Sandbox web interface window, select the Templates & Storage section.
- Go to the Virtual machines section.
- Click Create VM.
This opens the virtual machine creation window.
- In the Template drop-down list, select a template for the virtual machine.
If the list does not contain a suitable template, you can import or create a template in the Templates section of the Sandbox web interface window.
- In the Name field, type the name of the virtual machine.
- In the Description field, enter the description of the virtual machine. This field is optional.
- Click Save.
- Some operating systems from the distribution kit require accepting the terms of the relevant end user license agreement. Read the text of the end user license agreement and click Accept.
The virtual machine with a preset operating system image is created.
To create a virtual machine with a custom operating system image in the Virtual machines section:
- In the Sandbox web interface window, select the Templates & Storage section.
- Go to the Virtual machines section.
- Click Create VM.
This opens the virtual machine creation window.
- In the Template drop-down list, select a template for the virtual machine.
If the list does not contain a suitable template, you can import or create a template in the Templates section of the Sandbox web interface window.
- In the Name field, type the name of the virtual machine.
The name must consist of Latin characters.
- In the Description field, enter the description of the virtual machine. This field is optional.
- Click Save.
- If internet access is not configured for the server on which you are creating the virtual machine, the No internet access error message is displayed in the Templates window. To complete the virtual machine creation process, you must download debug symbols.
The virtual machine with a custom operating system image is created.
Page top
Creating a virtual machine in the table of templates
To create a virtual machine with a preset operating system image in the template table:
- In the Sandbox web interface window, select the Templates & Storage section.
Go to the Templates section.
- In the Actions column next to the template, click Create VM.
This opens the virtual machine creation window.
- In the Template drop-down list, select a template for the virtual machine.
If the list does not contain a suitable template, you can import or create a template in the Templates section of the Sandbox web interface window.
- In the Name field, type the name of the virtual machine.
- In the Description field, enter the description of the virtual machine. This field is optional.
- Click Save.
- Some operating systems from the distribution kit require accepting the terms of the relevant end user license agreement. Read the text of the end user license agreement and click Accept.
The virtual machine with a preset operating system image is created.
To create a virtual machine with a custom operating system image in the template table:
- In the Sandbox web interface window, select the Templates & Storage section.
Go to the Templates section.
- In the Actions column next to the template, click Create VM.
This opens the virtual machine creation window.
- In the Template drop-down list, select a template for the virtual machine.
If the list does not contain a suitable template, you can import or create a template in the Templates section of the Sandbox web interface window.
- In the Name field, type the name of the virtual machine.
The name must consist of Latin characters.
- In the Description field, enter the description of the virtual machine. This field is optional.
- Click Save.
- If internet access is not configured for the server on which you are creating the virtual machine, the No internet access error message is displayed in the Templates window. To complete the virtual machine creation process, you must download debug symbols.
The virtual machine with a custom operating system image is created.
Page top
Creating a virtual machine in the template view
To create a virtual machine with a preset operating system image in the template view:
- In the Sandbox web interface window, select the Templates & Storage section.
- Go to the Templates section.
- Select the relevant template.
- Click Create VM.
This opens the virtual machine creation window.
- In the Template drop-down list, select a template for the virtual machine.
If the list does not contain a suitable template, you can import or create a template in the Templates section of the Sandbox web interface window.
- In the Name field, type the name of the virtual machine.
- In the Description field, enter the description of the virtual machine. This field is optional.
- Click Save.
- Some operating systems from the distribution kit require accepting the terms of the relevant end user license agreement. Read the text of the end user license agreement and click Accept.
The virtual machine with a preset operating system image is created.
To create a virtual machine with a custom operating system image in the template view:
- In the Sandbox web interface window, select the Templates & Storage section.
- Go to the Templates section.
- Select the relevant template.
- Click Create VM.
This opens the virtual machine creation window.
- In the Template drop-down list, select a template for the virtual machine.
If the list does not contain a suitable template, you can import or create a template in the Templates section of the Sandbox web interface window.
- In the Name field, type the name of the virtual machine.
The name must consist of Latin characters.
- In the Description field, enter the description of the virtual machine. This field is optional.
- Click Save.
- If internet access is not configured for the server on which you are creating the virtual machine, the No internet access error message is displayed in the Templates window. To complete the virtual machine creation process, you must download debug symbols.
The virtual machine with a custom operating system image is created.
Page top
Viewing the table of virtual machines with preset operating systems
To view the list of virtual machines with preset operating systems:
- Select the Virtual machines section in the window of the Sandbox web interface.
- Select the Preconfigured tab.
The table of virtual machines with preset operating systems is displayed.
The table contains the following information:
- Name is the name of the virtual machine.
- Status is the status of the virtual machine, for example, Enabled or Disabled.
- Actions are operations available for the virtual machine. The following operations may be available: Delete.
The Not installed virtual machines section displays virtual machines that are ready for installation but have not yet been installed.
Page top
Viewing the table of virtual machines with custom operating systems
To view the list of virtual machines with custom operating systems:
- Select the Virtual machines section in the window of the Sandbox web interface.
- Select the Custom tab.
The table of virtual machines with custom operating systems is displayed.
The table contains the following information:
- Created is the time when the virtual machine was created.
- Name is the name of the virtual machine.
- Status is the status of the virtual machine, for example, Enabled or Disabled.
- Actions are operations available for the virtual machine. The following operations may be available: Delete.
- Description is the description specified when creating the virtual machine.
Installing a virtual machine
After creating a virtual machine, it must be installed.
To install a virtual machine with a preset operating system image:
- Select the Virtual machines section in the window of the Sandbox web interface.
- Select the Preconfigured tab.
- In the Not installed virtual machines section, click Install ready VMs.
All virtual machines pending installation are installed.
To install a virtual machine with a custom operating system image:
- Select the Virtual machines section in the window of the Sandbox web interface.
- Select the Custom tab.
- Next to the relevant virtual machine in the Actions column, click the Install link.
- When the virtual machine is installed, in the Actions column, click the Enable link.
The virtual machine is installed and ready to use.
Page top
Deleting a virtual machine
To delete an installed virtual machine:
- Select the Virtual machines section in the window of the Sandbox web interface.
- Select the Preconfigured or Custom tab.
- In the Actions column next to the relevant virtual machine, click Delete.
The virtual machine is deleted.
To delete a non-installed virtual machine with a preset operating system image:
- Select the Virtual machines section in the window of the Sandbox web interface.
- In the Not installed virtual machines section, click Delete all pending VMs.
All virtual machines with preset operating system images that are pending installation are deleted.
To delete a non-installed virtual machine with a custom operating system image:
- Select the Virtual machines section in the window of the Sandbox web interface.
- Select the Custom tab.
- Next to the relevant virtual machine in the Actions column, click the Delete link.
The virtual machine with a custom operating system image that is pending installation is deleted.
Page top
Downloading debug symbols
If internet access is not configured for the server on which the virtual machine with the custom image is installed, you must download the Microsoft debug symbols to correctly complete the virtual machine installation.
You can download debug symbols during virtual machine installation in the Templates window or after the virtual machine receives the Failed status in the list of virtual machines.
For debug symbols to download correctly, the operating system used for the virtual machine template must have Windows Debug Tools installed and the name of the host connected to the network (hostname) must contain only Latin letters, numerals, and special characters.
To download debug symbols during virtual machine installation in the Templates window:
- In the Sandbox web interface window, select the Templates & Storage section.
- Go to the Templates section.
- Select the relevant template.
- In the window with the No internet access error, click Download manifesto.
The Download manifesto is not available until the virtual machine gets the Failed status.
An archive is downloaded to your computer.
- Unpack the downloaded archive.
- Run the sbsymtool.ps1 using Windows PowerShell.
The archive with debug symbols is downloaded to the folder where this file is located.
- In the Sandbox web interface window, select the Templates & Storage section.
- Go to the Templates section.
- Select the template for which you have downloaded debug symbols.
- In the Actions drop-down list, select Upload symbols.
- This opens a window; in that window, select the archive with the debug symbols and click Open.
Debug symbols are downloaded. The virtual machine is installed and displayed in the list of virtual machines running custom operating systems.
To download debug symbols after a virtual machine has received the Failed status in the list of virtual machines:
- In the Sandbox web interface window, select the Templates & Storage section.
- Go to the Templates section.
- Select the relevant template.
- In the Actions drop-down list, select Download manifesto.
An archive is downloaded to your computer.
- Unpack the downloaded archive.
- Run the sbsymtool.ps1 using Windows PowerShell.
The archive with debug symbols is downloaded to the folder where this file is located.
- In the Templates window, expand the Actions list and select Upload symbols.
- This opens a window; in that window, select the archive with the debug symbols and click Open.
Debug symbols are downloaded. The virtual machine is installed and displayed in the list of virtual machines running custom operating systems.
Page top
Setting the maximum number of simultaneously running virtual machines
Set a limit on the number of simultaneously running virtual machines with operating systems in which the Sandbox component will process objects.
The number of simultaneously running virtual machines cannot exceed 200.
Calculate the number of simultaneously running virtual machines with images of operating systems as follows: multiply the number of logical cores by 1.5.
To set the maximum number of simultaneously running virtual machines:
- In the Sandbox web interface window, select the Administration section.
- In the Guest virtual machines group of settings, in the Maximum simultaneous VMs field, enter the number of simultaneously running virtual machines.
You can enter a number ranging from 1 to 200.
- Click Save.
Changing the number of license keys for a virtual machine with a custom operating system image
When creating a virtual machine with a custom operating system image, Kaspersky Anti Targeted Attack Platform specifies the number of license keys for software that is used inside that virtual machine. By default, the number of license keys is equal to the number of virtual machines running at the same time. Your license must cover this number. If necessary, you can change the number of license keys for the virtual machine.
If the number of license keys configured for a virtual machine is less than the number of simultaneously running virtual machines, the overall performance of the Sandbox server may be degraded.
It is not recommended to change the specified number of simultaneously running virtual machines.
To change the number of license keys for a virtual machine with a custom operating system image:
- Enter the management console of the Sandbox server via the SSH protocol or through a terminal.
- Get a list of servers by running the
sb-custom-images list-vmcommand.The table of virtual machines is displayed, where
idis the ID of the virtual machine,nameis the name of the virtual machine, andlicensesis the number of license keys. - Set the number of license keys for the selected virtual machine by running the
sb-custom-images licenses -id <virtual machine ID> -ln <number of licenses>command.
The number of license keys is changed.
To get help for the script, run the sb-custom-images --help command.
Downloading the Sandbox system log to the hard drive
Log data in the Sandbox system is stored in open, non-encrypted form. The data is stored for the last 7 days.
To download the Sandbox system log to the hard drive:
- In the Sandbox web interface window, select the Administration section.
- In the System log settings group, click the Download button.
- The Sandbox system log is downloaded to your computer's hard drive into the folder set as the file download folder in the settings of the browser that you use for working with the application.
Exporting Sandbox settings
To export the settings of a Sandbox system:
- In the Sandbox web interface window, select the Administration section.
- In the Settings settings group, click the Export button.
This opens the Warning window containing a warning on specifics of exporting the system parameters.
The Sandbox system parameters are dependent on hardware and software parameters of the server, on which the Sandbox component is installed. The Sandbox system exported parameters are intended to be imported to the same or another server strictly identical in configuration. Any attempt to restore the configuration of the Sandbox system with parameter values saved to another Sandbox system may disrupt the Sandbox system.
- Click Save.
A tar.gz file is downloaded to your computer's hard drive into the folder set as the file download folder in the settings of the browser that you use for working with the application. The file contains all the Sandbox system current parameters.
Archives with backup copies of the system parameters can contain confidential information, such as passwords and privacy keys. The Kaspersky Anti Targeted Attack Platform administrator must independently ensure the security of this data.
Importing Sandbox settings
To import Sandbox settings:
- In the Sandbox web interface window, select the Administration section.
- In the Settings settings group, click the Import button.
This open the Warning window containing a warning on specifics of importing the system parameters.
The Sandbox component parameters are dependent on hardware and software parameters of the server, on which the Sandbox is installed. The Sandbox exported parameters are intended to be imported to the same or another server strictly identical in configuration. Any attempt to restore the configuration of one Sandbox system with parameter settings saved to another Sandbox system may disrupt the system.
- Click Restore.
This opens the file selection window.
- Select a tar.gz file with the Sandbox parameters that you want to download and click the Open button.
This closes the file selection window.
If the Sandbox parameters have been successfully imported, the Sandbox server will restart. A few minutes later, you need to refresh the browser window and log in again.
Archives with backup copies of the system configuration can contain confidential information, such as passwords and privacy keys. The Kaspersky Anti Targeted Attack Platform administrator must independently ensure the storage security of this data.
Restarting the Sandbox server
To restart the Sandbox server:
- In the Sandbox web interface window, select the Administration section.
- In the Power settings group, click the Restart button.
This opens the Sandbox server restart confirmation window.
- Click Yes.
The Sandbox server will restart. In a few minutes, you will be able to log in to the system.
Powering off the Sandbox server
To power off the Sandbox server:
- In the Sandbox web interface window, select the Administration section.
- In the Power settings group, click the Power off button.
This opens the Sandbox server shutdown confirmation window.
- Click Yes.
The Sandbox server powers off.
Changing the Sandbox administrator account password
To change the Sandbox administrator account password:
- In the Sandbox web interface window, select the Administration section.
- The Change password settings group will show the Sandbox administrator account name that you set during installation of the Sandbox and the fields for changing the password.
- In the Current password field, enter the current password for the Sandbox administrator account.
- In the New password field, enter a new password for the Sandbox administrator account.
- In the Confirm password field, enter the new password for the Sandbox administrator account again.
- Click Change password.
The Sandbox administrator account password will be changed.
For administrators: Getting started with the application web interface
The intended audience of this section are personnel who install and administer Kaspersky Anti Targeted Attack Platform and manage PCN and SCN servers and tenants in distributed solution and multitenancy mode.
Kaspersky Anti Targeted Attack Platform Interface
The application is managed through the web interface. Sections of the application web interface differ depending on the role of the user: Administrator or Senior security officer (Senior security officer, Security officer, Security auditor).
The window of the application web interface contains the following:
- Sections in the left part and in the lower part of the application web interface window.
- Tabs in the upper part of the application web interface window for certain sections of the application.
- The workspace in the lower part of the application web interface window.
Sections of the application web interface window
The application web interface for the Administrator role contains the following sections:
- Dashboard. Contains Kaspersky Anti Targeted Attack Platform Monitoring data.
- Operating mode. Contains information about PCN and SCN servers and about tenants in distributed solution and multitenancy mode.
- Assets. Contains information about connected computers with the Kaspersky Endpoint Agent component and their settings.
- Logs: User activity, Application messages, Audit. Contains information about the application performance and audit records for user activity in the web interface.
- Settings. Contains the settings of the server with the Central Node component.
- Sensor servers. Contains information about connected Sensor components and their settings.
- Sandbox servers. Contains information about the connection of the Central Node component to Sandbox components.
- External systems. Contains information about application integration with mail sensors.
- Server configuration. Contains information about the sizing parameters of the application.
Workspace of the application web interface window
The workspace displays the information you choose to view in the sections and on the tabs of the application web interface window. It also contains control elements that you can use to configure how the information is displayed.
Users with the Security auditor role can also view these sections of the application web interface.
Monitoring the performance of the application
You can monitor application operation using the widgets in the Dashboard section of the application web interface window. You can add, delete, and move widgets, configure the display scale of widgets, and select the data display period.
About widgets and layouts
You can use widgets to monitor application operation.
A layout is the appearance of the workspace of the application web interface window in the Dashboard section. You can add, delete, and move widgets in the layout.
The following widgets are available in the application:
- Administration:
- Sandbox processing time. Displays how long it took on average for objects to be scanned by Sandbox.
- Processed. Displays the processing state for traffic coming from Sensors and Endpoint Agents to the Central Node.
- Queues. Displays information on the number and volume of objects waiting to be scanned by application modules and components.
If you are using the distributed solution and multitenancy mode, the section displays information about the tenant and server that you chose.
- NDR:
- Custom widget. Widget with arbitrary static content. For example, you can use custom widgets to logically separate groups of widgets in the Dashboard section.
- Traffic. Rate of incoming traffic. The widget can display information for all monitoring points of all nodes with installed application components, for monitoring points of a selected node, or for an individual monitoring point.
- CPU usage. CPU load on the selected node that has an application component installed.
- RAM usage. Amount of physical RAM being used on the selected node that has an application component installed.
- NDR health. Information about the current state of application performance. This widget can display the following values:
- OK—No messages regarding performance issues, or all performance issues have been resolved.
- Non-critical malfunction—Non-critical malfunctions reported. This value is displayed until the performance problem is resolved.
- Operation disrupted—Disruptions of the application reported. This value is displayed until the performance problem is resolved.
- Maintenance mode—The application is running in maintenance mode.
- Storage—Information about the drive in the local file system on the selected node with the application component installed. In this widget, you can select the following information to be displayed:
- Disk usage—Percentage of time taken to process data read/write operations.
- Occupied on disk—Filled disk space.
- Read from disk—Rate of reading data from the disk.
- Write to disk—Rate of writing data to the disk.
- Traffic processing latency. The current latency while processing traffic, counting from the moment it arrives at the monitoring point of the node. The maximum latency from among all enabled monitoring points is displayed. The widget can display information for all monitoring points of all nodes with installed application components, for monitoring points of a selected node.
- Status of protection functions. General information about the current state of protection functions in the application. This widget can display the following values:
- All are enabled—All technologies and methods intended for continuous use are enabled, and all created monitoring points are enabled.
- Not all are enabled—Some protection functions are disabled or are enabled in learning mode, or not all monitoring points are enabled.
- Uptime. Uptime of Kaspersky Anti Targeted Attack Platform. In this widget, you can select the following information to be displayed:
- Effective uptime—Duration of normal operation of the application (without malfunctions) since the most recent launch up to the current moment.
- Total uptime—Time from the first launch of the application up to the current moment. Includes periods of normal operation of the application and periods of malfunctioning.
- Since first start of application—The total time elapsed from the first launch of the application up to the current moment. Includes periods of normal operation, periods of malfunctioning, and periods of inoperability.
Widgets employ various means of drawing attention, depending on the incoming information. For example, widgets with information about the application and hardware resources can automatically change color if the information requires attention (in particular, when the load on a hardware resource is close to critical).
Widgets display only basic information that changes dynamically. If you need to view detailed information, you can navigate from the Dashboard section to other sections of the application web interface. You can navigate the web interface by clicking widgets.
For correct information to be displayed in NDR widgets, you must configure the synchronization of date and time between Central Node and Sensor components.
Selecting a tenant and a server to manage in the Dashboard section
If you are using the distributed solution and multitenancy mode, before using the Dashboard section, you must select the tenant and server whose data you want to view. Widgets of the NDR functionality will display information for the current node or for the node that is selected in widget settings.
To select a tenant and server for which you want to display data in widgets of the Dashboard section:
- In the upper right part of the application web interface window, click the arrow next to the server name.
- In the drop-down list, select the tenant and server from the list.
Data for the selected server is displayed. If you want to select a different tenant and server, repeat the steps to select a tenant and server.
Page top
Adding a widget to the current layout
To add a widget to the current layout:
- Select the Dashboard section in the application web interface window.
- In the upper part of the window, click the
 button.
 - In the drop-down list, select Customize.
- Click Widgets.
- In the Manage widgets window that opens:
- If you want to add the Sandbox processing time widget, turn on the toggle switch next to the name of this widget.
- If you want to add a different widget, click
 next to the name of that widget.
- Close the Manage widgets window and click Apply.
The selected widget is added to the current layout.
Moving a widget in the current layout
To move a widget in the current layout:
- Select the Dashboard section in the application web interface window.
- In the upper part of the window, click the button.
- In the drop-down list, select Customize.
- Select the widget that you want to move within the layout.
- Click and hold the upper part of the widget to drag and drop the widget to a different place in the layout.
- Click Apply.
The current layout is saved.
Changing the display of information in NDR widgets
After an NDR widget is added, it displays information in accordance with the default settings. If necessary, you can edit the display settings.
To edit NDR widget display settings:
- Select the Dashboard section in the application web interface window.
- In the upper part of the window, click the button.
- In the drop-down list, select Customize.
- In the upper-right corner of the NDR widget that you want to configure, click the
 button.
This opens the display settings window.
- Manage the display settings of the NDR widget.
Depending on the selected NDR widget, the window may contain the following settings:
- Change name – if the Change name check box is selected, you can define any name for the widget (different from the default name) in the Widget name field. The Change name setting is absent from custom widgets.
- Widget name – field for entering a widget name different from the default name.
- Edit description – if the Edit description check box is selected, you can provide any description for the widget (different from the default description) in the Widget description field. The Edit description setting is absent from custom widgets.
- Widget description – field for entering a widget name different from the default name.
- Refresh period – the time in seconds after which the displayed information is updated.
- Display – defines the type of displayed data (for widgets that let you select which data to display).
- Data source – the host with installed application components whose information the widget displays. If Entire application is selected, the widget displays data from all nodes.
- Change color based on status – if this check box is selected, the background color of the widget automatically changes depending on the severity of the incoming data. Critical (maximum) importance level is represented by a red background. If this check box is cleared, background color is disabled.
- Defined background – defines the color of the background on the custom widget. You can choose a background color that corresponds to one of the severity levels (Info, Warning, or Critical) or select Neutral to disable background coloring.
- Click Apply.
Removing a widget from the current layout
To remove a widget from the current layout:
- Select the Dashboard section in the application web interface window.
- In the upper part of the window, click the button.
- In the drop-down list, select Customize.
- Click the
 icon in the upper right corner of the widget that you want to remove from the layout.
The widget is removed from the workspace of the application web interface window.
- Click Apply.
The widget is removed from the current layout.
Saving a layout to PDF
NDR widgets in the layout are not saved to PDF.
To save a layout to PDF:
- Select the Dashboard section in the application web interface window.
- In the upper part of the window, click the button.
- In the drop-down list, select Save as PDF.
This opens the Saving as PDF window.
- In the lower part of the window, in the Layout drop-down list, select the page orientation.
- Click Download.
The layout in PDF format is saved to the hard drive of your computer in the downloads folder of the browser.
- Click Close.
Configuring the data display period in widgets
You can configure the display of data in widgets for the following periods:
- Day.
- Week.
- Month.
For NDR widgets, you can use the following periods:
- 1h
- 12h
- 24h
- 7d
You can configure a data display period for each individual NDR widget.
Changing the display of information in widgets
To configure the display of data in widgets for a day (from 00:00 a.m. to 11:59 p.m.):
- Select the Dashboard section in the application web interface window.
- In the upper-right corner of the application web interface window, in the drop-down list of data display periods, select Day.
- In the calendar to the right of the Day period name, select the date for which you want to display data in the widget.
All widgets on the Dashboard page display data for the period you selected.
To configure the display of data on widgets for a week (Monday through Sunday):
- Select the Dashboard section in the application web interface window.
- In the upper-right corner of the application web interface window, in the drop-down list of data display periods, select Week.
- In the calendar to the right of the Week period name, select the week for which you want to display data in the widget.
All widgets on the Dashboard page display data for the period you selected.
To display data display in widgets for a month (calendar month):
- Select the Dashboard section in the application web interface window.
- In the upper-right corner of the application web interface window, in the drop-down list of data display periods, select Month.
- In the calendar to the right of the Month period name, select the month for which you want to display data in the widget.
All widgets on the Dashboard page display data for the period you selected.
Changing the display of information in widgets
To configure the display of information in an NDR widget:
- Select the Dashboard section in the application web interface window.
- In the upper-right corner of the NDR widget that you want to configure, click the button that stands for the time interval that you need.
The NDR widget displays information for the selected period.
Monitoring the receipt and processing of incoming data
In the Processed widget, you can assess the processing status of data coming from Sensors and Endpoint Agents to the Central Node, and track data processing errors.
To select the component (Sensor or Endpoint Agent) for which you want to assess incoming data, use the drop-down list to the right of the Processed widget name.
You can select the type of data display in the drop-down list to the right of the component name (Sensor or Endpoint Agent):
- Current load—The last 5 minutes.
- Selected period. In this case, you can also configure the period for which data is displayed in widgets.
The left part of each widget displays the legend for colors used in the widget itself.
If the Current load data display type is selected, the average data processing rate over the past 5 minutes is displayed to the right of the key.
Example: The Processed widget that has (SPAN) or (ICAP) Sensor type and Current load data display type selected displays the data processing rate for SPAN and ICAP traffic coming from the Sensor to the Central Node at a certain time. The following information is displayed:
|
If the Selected period data display type is selected, to the right of the legend, you can see the average rate of incoming traffic to the Central Node and the number of objects processed during the selected period.
Example: The Processed widget with an (SPAN) or (ICAP) Sensor, Selected period data display type, and Month data display period selected displays the rate of SPAN and ICAP traffic coming to the Central Node server, as well as the number of files and URLs extracted from mail traffic during the selected month. The following information is displayed:
The Processed widget with (LOAD) Endpoint Agents Sensor type, Selected period data display type, and Month data display period selected displays the number of events coming from Endpoint Agent hosts to the Central Node server during the selected month. When you move the mouse cursor over a widget, you see a pop-up window that displays the number of events for a specific time period. |
Monitoring the queues for data processing by application modules and components
You can use the Queues widget to assess the status of data processing by the
and application modules and the and monitor the amount of unprocessed data.Data transfer in the queue is measured in messages.
You can select the type of data display in the drop-down list to the right of the Queues widget name:
- Current load—The last 5 minutes.
- Selected period. In this case, you can also configure the period of data display on widgets.
The left part of the widget displays the legend for colors used in the widget.
The Queues widget displays the following data:
- Number of messages and Data volume processed by application modules and components:
- YARA—blue.
- Sandbox—violet.
- AM Engine—green.
- Unprocessed – amount of unprocessed data indicated by vertical red lines.
When you hover the mouse cursor over a widget, you see a pop-up window that displays the status of data processing by the YARA and AM Engine application modules and the Sandbox component, as well as the amount of unprocessed data during a specific time period.
Monitoring the processing of data by the Sandbox component
The Sandbox processing time widget displays the average time elapsed from the moment data is sent to one or multiple Sandbox component servers (including the time spent in the queue before getting sent) to the moment when the Sandbox processing results are displayed in the web interface of Kaspersky Anti Targeted Attack Platform for the selected period.
Example: If Month is configured as the period of data display in widgets, the Sandbox processing time widget displays orange-colored bars for each day of the month. When you move the mouse cursor over each column, you will see a pop-up window that displays the average time that elapses from the moment data is sent to one or several servers with the Sandbox component until the results from data processing by the Sandbox component are displayed in the web interface of Kaspersky Anti Targeted Attack Platform during the selected day. |
You can increase the rate at which data is processed by the Sandbox component and the throughput of the Sandbox component by increasing the number of servers with the Sandbox component and by distributing the data to be processed among those servers.
Viewing the working condition of modules and components of the application
If modules or components of the application encounter errors that the administrator is advised to look at, a yellow warning box is displayed in the upper part of the Dashboard section of the application web interface.
Users with the Administrator or Security auditor role can gain access to information about the working condition of the Central Node, PCN, or SCN server that the user is currently managing.
Users with the Senior security officer, Security officer, or Security auditor role can gain access to the following information about the working condition:
- If you are using a standalone Central Node server, the user can access information about the working condition of the Central Node server which the user is currently managing.
- If you are using the distributed solution and multitenancy mode, and the user is managing an SCN server, the user can gain access to information about the working condition of that SCN server for tenants to whose data the user has access.
- If you are using the distributed solution and multitenancy mode, and the user is managing the PCN server, the user can gain access to information about the working condition of the PCN server and all SCN servers connected to that server, for tenants to whose data the user has access.
For details about the working condition of application modules and components,
click View details to open the System health window.
In the System health window, one of the following icons is displayed depending on the working condition of the application modules and components:
 if the modules and components of the application are working normally.
- An icon with the number of problems (for example,
 ) if problems are found that the administrator is recommended to pay attention to. In this case, detailed problem information is displayed in the right part of the System health window.
The System health window contains the following sections:
- Component health contains information on the operational status of application modules and components, quarantine, and database update on all servers where the application is running.
Example:
If the databases of one or more application components have not been updated in 24 hours, the
 icon is displayed next to the name of the server on which the application modules and components are installed.
To resolve the problem, make sure that update servers are accessible. If you are using a proxy server to connect to update servers, make sure the proxy server has no errors pertaining to the connection to Kaspersky Anti Targeted Attack Platform servers.
- Processed—Status of receiving and processing incoming data. The status is generated based on the following criteria:
- State of receiving data from servers with the Sensor component, from the server or virtual machine with the mail sensor, from hosts with the Endpoint Agent component.
- Information about exceeding the maximum allowed time that objects wait in the queue to be scanned by application modules and components.
- Connection with servers—Status of the connection between the PCN server and connected SCN servers (displayed if you are using the distributed solution and multitenancy mode).
If problems are detected with the performance of application modules or components and you cannot resolve those problems on your own, please contact Kaspersky Technical Support.
Managing Central Node or Sensor server information
Information about servers with the Central Node or Sensor components is displayed in the Sensor servers of the application web interface window.
This section displays cards of components (on the left) and cards of network interfaces detected on these components (to the right of each component).
Above the card of the Sensor component is the card of the Central Node component to which the Sensor is connected. If the Central Node component is deployed with a built-in Sensor component, the name of that Sensor component is displayed the card as Embedded Sensor.
You can view component cards and network interface cards.
Page top
Viewing information about Central Node or Sensor servers
To view information about a Central Node or Sensor component:
- Select the Sensor servers section in the window of the application web interface.
- Click the card of the relevant component.
This opens a window with information about the component.
The Settings tab for the Central Node and Sensor components displays the following information:
- Status is the current status of the component indicated by an icon and text description.
- Node type indicates the application component: Server (Central Node component) or Sensor (Sensor component).
- Disk space currently used by the application is the disk space occupied by application files. Includes installed files and files created by the application in the course of its operation.
- Maximum disk space that can be used by the application is the disk space that can be occupied by application files. Includes installed files and the sum total of all space limits configured in data storage rules. This value may not exceed the amount of available disk space.
- Occupied on disk is the disk space used by all files. Includes application files, operating system files, and files of other applications. The space is calculated on the disk that contains the /var directory in the file system of the component.
- Free disk space is the disk space that is not used by files. The space is calculated on the disk that contains the /var directory in the file system of the component.
- Total disk space is the total volume of disk space on the drive that contains the /var directory in the file system of the component.
- BPF filtering indicates whether filtering using the Berkley Packet Filter (BPF) technology based on address parameters in network packets is enabled or disabled.
- External storage for traffic dump files indicates the connection status of the external storage. The following statuses may be displayed: Connected, Not connected.
- Retention rules indicate current and maximum values of size, number of items, and storage duration of application data.
For the Sensor component, in addition to the Settings tab, the External storage, Other, ICAP integration, POP3 integration, and SMTP integration tabs are also displayed.
- The External storage tab displays information about the configuration of the external storage for mirrored SPAN traffic.
- On the Other tab, the following information is displayed:
- Maximum size of scanned file is the current limit on the size of files that can be scanned by the component.
- Dump HTTP body indicates whether HTTP body content dumping is enabled or disabled.
- The ICAP Integration tab displays the settings of integration with a proxy server via ICAP.
- The POP3 Integration tab displays the POP3 mail server integration settings.
- The SMTP Integration tab displays the SMTP mail server integration settings.
Viewing network interface information
The network interface card in the Sensor servers section of the application web interface displays the following information:
- Network interface name
- MAC address of the network interface
- IP address of the network interface
- Network interface bandwidth
- Blink. This link lets you identify the Ethernet port associated with a network interface
If a monitoring point has been added to the network interface, the following information about the monitoring point is displayed in the card of the network interface:
- Monitoring point name.
- Technology mode is the state of the technology inheritance functionality. It can be Enabled or Disabled.
You can view network interface details.
To view network interface details:
- Select the Sensor servers section in the window of the application web interface.
- Click the card of the relevant network interface.
This opens a window with information about the network interface.
The network interface card displays the following information:
- Network interface is the name of the network interface in the operating system.
- Connection is the icon indicating that a network cable is connected to the Ethernet port of the network interface:
 – the network cable is connected.
 – the network cable is disconnected.
 The icon blinks when the Ethernet port indication mode is enabled.
- MAC address is the MAC address of the network interface.
- IP address is the IP address of the network interface.
If multiple IP addresses are found on the network interface, a maximum of 16 IP addresses are displayed in the details area.
If a monitoring point has been added to the network interface, the following information is displayed in the card of the network interface:
- Status is the current status of the monitoring point indicated by an icon and a text description:
 OК. The monitoring point is available.
 Switchover. The operating mode of the monitoring point is being changed.
 Error. An error was detected when switching over the operating mode of the monitoring point.
- Connection is the icon indicating that a network cable is connected to the Ethernet port of the network interface:
- – the network cable is connected.
- – the network cable is disconnected.
The icon blinks when the Ethernet port indication mode is enabled.
- Network interface is the name of the network interface in the operating system.
- Mode is the current mode of the monitoring point:
- Enabled.
- Disabled.
- On the Settings tab:
- The Inheritance of technologies indicates whether inheritance of technologies is enabled or disabled for the server.
- MAC address is the MAC address of the network interface.
- IP address is the IP address of the network interface.
Identifying the Ethernet port associated with a network interface
The server on which application components are installed can have multiple Ethernet ports for connecting to the local network. You can use the application to enable blink mode for a network interface and find out which Ethernet port is associated with this interface. In blink mode, the LED next to the Ethernet port blinks for 15 seconds.
If the network interface does not support LED indication (for example, if the Ethernet port is not equipped with a LED, or the network interface is a logical bonded interface), an error is displayed when attempting to enable blinking mode.
To identify the Ethernet port associated with a network interface:
- Select the Sensor servers section in the window of the application web interface.
- In the card of the relevant network interface, click the Blink button.
If the network interface supports LED indication, the network cable connection icon starts blinking in the card of the network interface. At the same time, the LED next to the Ethernet port starts blinking on the corresponding network adapter of the computer.
When a network interface is in blinking mode, you cannot turn on blinking mode for any other network interface on the same server.
Page top
Managing Central Node, PCN, or SCN servers using the application web interface
You can use the application web interface to perform the following actions with the server on which the Central Node component is installed:
- Configure the date and time on the server.
- Power off and restart the server.
- Generate or upload a server certificate that you can prepare on your own.
- Configure the network settings of the server.
- Monitor the disk space usage on the server.
If you are using the distributed solution and multitenancy mode, use the web interface of the PCN or SCN server for which you want to configure parameters.
Changing the server name
To rename the Central Node server:
- Select the Sensor servers section in the window of the application web interface.
- Click the card of the relevant Central Node component.
This opens a window with information about the component.
- Click Edit.
- Go to the General tab.
- In the Server name field, enter a new name.
The name must be unique (may not be the same as the name of another component) and may contain up to 100 characters. You can use letters of the English alphabet, numerals, a space, and the special characters: _ and - (for example, Server_1). The name must begin and end with any valid character other than a space.
- Click Save.
The server is renamed.
Page top
Configuring the date and time on the server
If you are using the distributed solution and multitenancy mode, use the web interface of the PCN or SCN server for which you want to configure parameters.
To configure the date and time on the server.
- In the window of the application web interface, select the Settings section, Date and time subsection.
- In the Time zone drop-down list, select the time zone of the physical location of the Central Node server.
- Under NTP servers, specify the value of the Maximum packet transmission time setting, which limits the maximum possible time it takes to deliver a packet from the Central Node server to the NTP server.
The default setting is 5 seconds.
- In the NTP servers section:
- If you want to add a new :
- Click Add.
- In the field that opens, enter the IP address or domain name of the NTP server.
- Click the button to the right of the field.
- If you want to edit the IP address or domain name of the NTP server, click the
 button in the line containing the server.
 - If you want to delete an NTP server, click the button in the line containing the server.
- If you want to add a new :
- Click Apply.
The date and time of the server will be configured.
Page top
Generating or uploading a TLS certificate of the server
If you are already using a server TLS certificate, generating or uploading a new certificate causes the currently used certificate to be removed and replaced with the new certificate.
You must enter the data of the new certificate everywhere the old certificate was used.
If you replace the TLS certificate, you will need to:
- Reauthorize mail sensors (KSMG, KLMS) on Central Node
- Reconfigure the connection of Central Node, PCN, and SCN to Sandbox
- Reconfigure traffic forwarding from Endpoint Agent to Sensor and trusted connection with Endpoint Agent
Make sure to delete all Endpoint Agent host isolation rules. Connection with isolated hosts will be lost and you will not be able to manage them
You can generate a new certificate in the web interface: of the Central Node server or upload a certificate that you have created independently.
If you are using the distributed solution and multitenancy mode, use the web interface of the PCN or SCN server for which you want to configure parameters.
To generate a TLS certificate for a Central Node server:
- Sign in to the Kaspersky Anti Targeted Attack Platform web interface with the administrator credentials.
- In the window of the application web interface, select the Settings section, Certificates subsection.
- In the Server certificate section, click Generate and export.
This opens the action confirmation window.
- Click Yes.
Kaspersky Anti Targeted Attack Platform generates a new TLS certificate. The page is automatically refreshed.
Communication with the mail sensors, the Sandbox component, and the Kaspersky Endpoint Agent application is interrupted until reauthorization.
You can choose to prepare the TLS certificate on your own and upload it using the Kaspersky Anti Targeted Attack Platform web interface.
The TLS certificate file prepared for upload must satisfy the following requirements:
- The file must contain the certificate itself and a private encryption key for the connection.
- The file must be in PEM format.
The application does not support other formats of certificates.
If you have prepared a certificate in a different format, you must convert it to the PEM format.
- The private key length must be 2048 bits or longer.
For more details on preparing TLS certificates for import, please refer to the documentation on Open SSL.
Upload the TLS certificate in the web interface of the PCN or SCN server to which you want to upload the certificate.
To upload an independently prepared TLS certificate using the Kaspersky Anti Targeted Attack Platform web interface:
- Sign in to the Kaspersky Anti Targeted Attack Platform web interface with the administrator credentials.
- In the window of the application web interface, select the Settings section, Certificates subsection.
- In the Server certificate section, click Upload.
This opens the file selection window.
- Select a TLS certificate file to download and click the Open button.
This closes the file selection window.
The TLS certificate is added to the Kaspersky Anti Targeted Attack Platform.
Communication with the mail sensors, the Sandbox component, and the Kaspersky Endpoint Agent application is interrupted until reauthorization.
Downloading the TLS certificate of the server
If you are using the distributed solution and multitenancy mode, use the web interface of the PCN or SCN server for which you want to configure parameters.
To download the TLS certificate of the server:
- In the window of the application web interface, select the Settings section, Certificates subsection.
- In the Server certificate section, click Download.
The server certificate file will be saved in the downloads folder of the browser.
Assigning a server DNS name
If you are using the distributed solution and multitenancy mode, use the web interface of the PCN or SCN server for which you want to configure parameters.
To assign the server name to be used by DNS servers:
- In the window of the program web interface, select the Settings section, Network settings subsection.
- Enter the full domain name of the server into the Server name (FQDN) field.
Specify the server name in FQDN format (for example:
host.domain.comorhost.domain.subdomain.com). - Click Apply.
The server name will be assigned.
Page top
Configuring DNS settings
If you are using the distributed solution and multitenancy mode, use the web interface of the PCN or SCN server for which you want to configure parameters.
To configure DNS:
- In the window of the program web interface, select the Settings section, Network settings subsection.
- In the DNS settings group, enter the IP addresses of the DNS servers in the DNS servers field.
- Click Apply.
The DNS settings will be configured.
Page top
Configuring settings of the network interface
If you are using the distributed solution and multitenancy mode, use the web interface of the PCN or SCN server for which you want to configure parameters.
To configure the network interface:
- In the window of the program web interface, select the Settings section, Network settings subsection.
- Select the network interface whose settings you want to configure.
This opens the Edit network interface window.
- In the State settings group, select one of the following options:
- Disabled
- Enabled, using DHCP server if you want the settings received from the DHCP server to be used for the network interface.
- Enabled, manual configuration if you want the manually configured network interface to be used.
- If you selected Enabled, manual configuration, specify values for the following parameters:
- In the IP field, specify the IP address of the network interface.
- In the Subnet mask field, specify the subnet mask of the network interface.
- In the Gateway text box, enter the IP address of the gateway.
- Click Save.
The settings of the network interface will be configured.
Page top
Configuring the default network route
If you are using the distributed solution and multitenancy mode, use the web interface of the PCN or SCN server for which you want to configure parameters.
To configure the default network route:
- In the window of the program web interface, select the Settings section, Network settings subsection.
- In the Network route settings group, in the Network interface drop-down list, select the network interface for which you want to configure the network route.
- In the Gateway text box, enter the IP address of the gateway.
- Click Apply.
The default network route will be configured.
Page top
Configuring proxy server connection settings
If you are using the distributed solution and multitenancy mode, use the web interface of the PCN or SCN server for which you want to configure parameters.
To configure the proxy server connection:
- In the window of the application web interface, select the Settings section, Network settings subsection.
- In the Proxy server settings group, set the toggle switch to Enabled.
- In the Host field, specify the URL of the proxy server.
- In the Port field, specify the port for connecting to the proxy server.
- In the User name field, specify the user name for authentication on the proxy server.
- In the Password field, specify the password for authentication on the proxy server.
- If you do not want to use a proxy server when connecting to local addresses, select the Bypass proxy server for local addresses check box.
- Click Apply.
The proxy server connection settings will be configured.
Page top
Configuring the mail server connection
If you are using the distributed solution and multitenancy mode, use the web interface of the PCN or SCN server for which you want to configure parameters.
The application can send notifications about alerts and system performance. To do so, you must configure the settings of the server used for sending notifications.
To configure the server for sending notifications:
- In the main window of the application web interface, select the Settings section, Notifications subsection.
- Go to the Mail server configuration tab.
- In the Host field, specify the IP address of the mail server.
- In the Port field, specify the port for connecting to the mail server.
- In the Email from field, specify the email address from which the notifications will be sent.
- If you want to enable authentication on the mail server, select the Use SMTP authentication of message recipients check box.
- In the User name field, specify the user name for authentication on the server used for sending notifications.
- In the Password field, specify the password for authentication on the server used for sending notifications.
- If you want to use TLS encryption when sending notifications, select the Use TLS encryption check box.
- If you want to validate the certificate of the mail server, select the Validate TLS encryption check box.
The Certificate fingerprint field displays the fingerprint of the mail server certificate.
If the Validate TLS encryption check box is not selected, the application will consider any certificate of the mail server as trusted.
- Click Apply.
The settings of the server used for sending notifications will be configured.
Managing traffic saving settings
The application can save traffic received at the time when an event was registered. Traffic is saved in the database of the Central Node server when registering events for which traffic saving is enabled. The application can also directly save traffic in the server database upon a traffic download request, using temporary traffic dump files.
The application stores traffic data in blocks. If a block of traffic is associated with multiple events (for events recorded within a short period of time), such a block of traffic is not duplicated in the database.
To manage the settings for saving traffic in the server database:
- Select the Sensor servers section in the window of the application web interface.
- Click the card of the relevant Central Node component.
This opens a window with information about the component.
- Click Edit.
- Go to the General tab.
- Under Traffic for events, specify the maximum volume of traffic to be saved in the Max volume field.
You can select the unit of measure for the size limit: MB or GB.
When editing the value, you also need to take into account that the sum total of all size limits may not exceed the specified maximum storage capacity for the server.
- Click Save.
Traffic saving settings are modified.
Page top
Managing the settings for saving traffic dump files
The application saves traffic received through monitoring points as traffic dump files. The application uses these files for analysis of incoming traffic. You can also use these files to perform the following actions in the application:
- Downloading traffic when managing the network interactions map
- Downloading network session traffic
- Downloading traffic for events (traffic dump files allow you to load traffic for events, even if traffic saving is disabled for the relevant event type)
Traffic dump files are saved in internal storage on servers with the Sensor component. If you use the Central Node component with built-in Sensor, traffic dump files are saved in the internal storage of the Central Node server.
The application stores traffic dump files on a temporary basis. As traffic arrives, the application automatically deletes the oldest traffic dump files from storages if the total size of files approaches the limit set for the storage. You can configure the settings for storing traffic in the internal storage.
To configure the saving of traffic dump files to the internal storage:
- Select the Sensor servers section in the window of the application web interface.
- Click the card of the relevant Central Node component.
This opens a window with information about the component.
- Click Edit.
- Go to the General tab.
- If necessary, in the Filtering stored traffic section, enable filtering and enter a filtering expression using the Berkeley Packet Filter (BPF) technology based on the address settings of the network packets.
Filtering can reduce the size of stored traffic by discarding network packets that do not match the filter. However, if you rely on filtering, consider that filtered traffic may not provide all data that the application needs for high-quality traffic analysis. You need to configure filtering in such a way that all network packets that the application needs to analyze traffic are saved in the traffic dump files.
- Under Traffic dump files, use the Max volume setting to set the size limit for stored traffic dump files.
You can select the unit of measure for the space limit: MB or GB.
When editing the value, you also need to take into account the amount of received traffic, the rate at which it is received, and the fact that the sum total of all size limits may not exceed the specified maximum storage capacity for the node.
- Click Save.
Traffic dump saving in internal storage is configured.
Page top
Selecting operating systems to use when scanning objects in Sandbox
You can select a set of operating systems that will be used to generate tasks for scanning objects using the Sandbox component. On the Sandbox server, you must install virtual machines with operating systems that match the configured set.
To select the set of operating systems:
- Select the Sandbox servers section in the window of the application web interface.
- Go to the Settings tab.
- Under OS set, select one of the following options:
- Windows 7, Windows 10.
- CentOS 7.8, Windows 7, Windows 10.
- Astra Linux 1.7, Windows 7, Windows 10.
- Custom.
- If you selected Custom, under Set composition, select the check boxes next to the operating systems that you want to include in the set.
Custom operating systems are displayed in the list if virtual machines with these operating systems are installed on the Sandbox server. Preset operating systems are always displayed in the list, but if virtual machines running these operating systems are not deployed, the Unknown status is displayed next to the name of the operating system.
Kaspersky Anti Targeted Attack Platform will create tasks for scanning objects in Sandbox in accordance with the selected set.
If the set of operating systems installed on the Sandbox server does not match the set selected on the Central Node server, objects are not sent to be scanned by that Sandbox server. If multiple Sandbox servers are connected to the Central Node server, the application sends objects to those Sandbox servers whose installed operating systems match the set selected on Central Node.
You can change the set of operating systems in the course of using the application. In this case, you need to make sure that the configuration of the Sandbox server satisfies hardware requirements.
In distributed solution and multitenancy mode, the settings of the operating system set configured on the PCN server are not applied to SCN servers connected to that PCN server. You can select the set of operating systems for each PCN and SCN server individually.
Page top
Password policies
You can configure password policies for users of Kaspersky Anti Targeted Attack Platform: enforce password change after the first successful authentication in the application web interface and/or regularly.
These policies apply to all Kaspersky Anti Targeted Attack Platform users with the KATA user account account type regardless of the assigned role.
Enforced password change after the first successful authentication
If this functionality is enabled, passwords are changed in accordance with the following scenario:
- The administrator creates a user account.
- The user authenticates in the Kaspersky Anti Targeted Attack Platform web interface.
- The next time this user logs in to the web interface, the application prompts the user to change the account password. The old password becomes invalid.
The first login of the user to the main web interface of the application is counted as the first authentication. No password change prompt is displayed if the user comes back and logs in to the web interface for sizing management or the administrator menu of the application. Neither is a password change prompt displayed if the user account is used for connecting the SCN to the PCN.
Regular password change
If regular password change is enabled, the application prompts the user to change the password after the period set by the administrator expires. The countdown starts from the moment when the account password is changed and is tracked individually for each user.
Distributed solution and multitenancy mode
In distributed solution and multitenancy mode, password policy settings specified on the PCN are applied to the SCNs.
Page top
Enforced password change after the first successful authentication
For details on this feature, see the Password policies section.
To enable enforced password change after the first successful authentication:
- Select the Settings section in the application web interface window.
- Go to the Authentication policies tab.
- In the Change password after first authentication section, set the Request password change toggle switch to Enabled.
- Click Apply.
Enforced password change after the first authentication is enabled.
Page top
Enforced regular password change
For details on this feature, see the Password policies section.
To enable and configure enforced regular password change:
- Select the Settings section in the application web interface window.
- Go to the Authentication policies tab.
- In the Change password regularly section, set the Request password change toggle switch to Enabled.
- In the Change password after field, enter the number of days after which you want to change the password.
- Click Apply.
Enforced password change after the specified period is enabled and configured.
Page top
Managing the Sensor component
The Sensor component receives data from network traffic and mail traffic.
You can install the Sensor and Central Node components on the same server or on separate servers. The Sensor component installed on a standalone server must be connected to the server with the Central Node component. If you are using the distributed solution and multitenancy mode, follow the steps to connect the Sensor component on the PCN or SCN server to which you want to connect the component.
Centralized management of Sensor components with the PCN in distributed solution and multitenancy mode is not supported. The Sensor component can be configured only from the specific Central Node server to which the component is connected.
Connecting the Sensor component to the Central Node
When the Sensor component is added, a configuration package is generated on the Central Node, containing the certificate and configuration data for the Sensor component. The added component is connected using the web interface of the Sensor component. The web interface of the component lets you upload a configuration package and connect the component in the following ways:
- Using a communication data package.
In this case, the configuration package is saved as a file in which the certificate is password-protected. This file is called a communication data package. The communication data package must be uploaded to the web interface of the Sensor component. After uploading the communication data package, the Sensor component automatically connects to the Central Node on which the communication data package was created.
- Automatically over the network.
In this case, the configuration package is sent over the network to the specified IP address of the server with the Sensor component. The Sensor processes the configuration package, generates a certificate signing request (CSR) based on it, and sends this request to the Central Node component. After receiving the CSR, the fingerprint of the CSR is displayed in the web interface of Kaspersky Anti Targeted Attack Platform as a sequence of characters. The same fingerprint is displayed at the same time in the web interface of the Sensor component. You must make sure that the fingerprints are identical before terminating the connection.
If the connection between the Central Node and Sensor components is established outside of a trusted medium, to protect the connection from traffic interception, you need to use external cryptographic information protection facilities that support encryption algorithms approved in your country. If the components are connected by a trusted medium, for example, a patch cord within a server rack that precludes third-party access, using external cryptographic information protection facilities is not necessary.
Connecting the Sensor component using a communication data package
To connect the Sensor component using a communication data package:
- Select the Sensor servers section in the window of the application web interface.
- Click Add sensor.
This opens the Adding a new sensor window.
- In the Sensor name field, enter a name for the Sensor component that you want to connect.
After the connection to the Central Node is established, the title of the browser tab with the web interface page of the component displays the name that you configure at this step.
- In the Server address field, enter the IP address of the Central Node server to which you want to connect the Sensor component.
- In the Sensor IP address field, enter the IP address of the server with the Sensor component that you want to connect to the Central Node component.
- In the Encryption of certificate in communication data package section, set the certificate protection password that you want to use.
The password must satisfy the following requirements:
- Contains 8 to 256 ASCII characters.
- Contains one or more uppercase letters of the Latin alphabet.
- Contains one or more lowercase letters of the Latin alphabet.
- Contains one or more numerals.
- Does not contain four or more identical characters in a row.
- Click Create communication data package. Your browser saves the downloaded file. Depending on your browser's settings, a window may be displayed on your screen in which you can specify the path and name of the downloaded file.
- In a browser on any computer that allows access to the Sensor server, in the address bar of the browser, enter: https://<IP address of the Sensor component>:<9443>.
- On the sensor web interface page, click Select file.
This opens the standard browser window for selecting a file.
- Specify the path to the communication data package.
- Click the open file button.
- After the file finishes uploading, enter the password for the certificate that you set at step 6 of these instructions.
The Sensor component is connected to the Central Node component, after which the connection information in the web interfaces of the Sensor and Central Node components.
Adding and connecting the Sensor component automatically over the network
To connect the Sensor component automatically over the network:
- Select the Sensor servers section in the window of the application web interface.
- Click Add sensor.
This opens the Adding a new sensor window.
- Go to the Automatically over the network tab.
- In the Sensor name field, enter a name for the Sensor component that you want to connect.
After the connection to the Central Node is established, the title of the browser tab with the web interface page of the component displays the name that you configure at this step.
- In the Server address field, enter the IP address of the Central Node server to which you want to connect the Sensor component.
- In the Sensor IP address field, enter the IP address of the server with the Sensor component that you want to connect to the Central Node component.
The application establishes a connection with the server on which the Sensor component is installed, and a prompt is displayed in the web interface of the application asking you to confirm the fingerprint of the received certificate signing request.
- In a browser on any computer that allows access to the Sensor server, in the address bar of the browser, enter: https://<IP address of the Sensor server>:<9443>.
The web interface of the Sensor component is displayed in the browser. The web interface displays a message with information about the fingerprint of the certificate signing request that was sent to the Central Node component.
- Make sure that the character sequences representing the fingerprint of the certificate request are identical in the web interfaces of the Sensor and Central Node components.
- In the application web interface, click the button to confirm the received fingerprint of the certificate signing request.
The Sensor component is connected to the Central Node component, after which the connection information in the web interfaces of the Sensor and Central Node components.
Page top
Managing the certificate of the Sensor component
This section describes how to manage the TLS certificate of the Sensor component.
The certificate can be managed in the application administrator menu.
Page top
Generating a TLS certificate for the Sensor server in the administrator menu of the Sensor server
To create a TLS certificate for the server with the Sensor component, do the following in the administrator menu of the Sensor server:
- In the main window of the administrator menu, select Program settings.
- Press ENTER.
This opens the next window of the administrator menu.
- Select Manage server certificate.
- Press ENTER.
This opens the Certificate management window.
- In the lower part of the window, select New.
- Press ENTER.
This opens a window containing information about the new certificate.
- Click Continue.
This opens the action confirmation window.
- Click Generate.
Creation of the certificate starts.
- After creation of the certificate is completed, press ENTER.
This opens a window containing information about the installed certificate.
- Click Continue.
This opens the action confirmation window.
- Click Ok.
The certificate will be created. The data of previously installed certificates will be overwritten.
Uploading your own TLS certificate in the administrator menu of the Sensor server
You can prepare your own TLS certificate and upload it to the Sensor server using SCP. For more details on the methods for uploading files via the SCP protocol, see the documentation for the operating system installed on the computer from which you want to upload the TLS certificate.
The TLS certificate file prepared for upload to the server must satisfy the following requirements:
- The file must contain the certificate itself and a private encryption key for the connection.
- The file must be in PEM format.
- The file name must be kata.pem.
- The private key length must be 2048 bits or longer.
For more details on preparing TLS certificates for import, please refer to the documentation on Open SSL.
To upload your own TLS certificate to the Sensor server using SCP, do the following in your computer's SCP interface (Linux is used in the example):
- Run the following command:
scp kata.pem admin@<IP address of the server with the Sensor component>: - At the password prompt, enter the administrator password for managing the administrator menu of the Sensor server that was set during installation.
The TLS certificate is uploaded to the server with the Sensor.
To apply the uploaded TLS certificate on the Sensor server, do the following in the administrator menu of the Sensor server:
- In the main window of the administrator menu, select Program settings.
- Press ENTER.
This opens the next window of the administrator menu.
- Select Manage server certificate.
- Press ENTER.
This opens the Certificate management window.
- In the lower part of the window, select Install from file.
- Press ENTER.
The certificate will be applied. The data of previously installed certificates will be overwritten.
Downloading the TLS certificate of the Sensor server to your computer
You can download a TLS certificate from the Sensor server to any computer that can connect to the Sensor server over the SCP protocol. For more details on the methods for uploading files via the SCP protocol, see the documentation for the operating system installed on the computer to which you want to download the TLS certificate.
To download the TSL certificate from the server with the Sensor component over the SCP protocol, do the following in your computer's interface used for working over the SCP protocol (using the Linux operating system as an example):
- Run the following command:
scp admin@<IP address of the server with the Sensor component>:ssl/kata.crt. - At the password prompt, enter the administrator password for working in the administrator menu of the server with the Sensor component that was set during installation.
The TLS certificate is downloaded from the server with the Sensor component to the current directory.
Logging in to the web interface of the Sensor component
The Sensor web interface is located on the server hosting the Sensor component.
The Sensor web interface is protected against CSRF attacks and works only if the user's browser provides the Referer header of an HTTP POST request. Make sure that the browser that you are using to work with the Sensor web interface does not modify the Referer header of an HTTP POST request. If the connection with the web interface is established through a proxy server of your organization, check the settings and make sure that the proxy server does not modify the Referrer header for an HTTP POST request.
To get started with the web interface of the Sensor application:
In a browser on any computer that allows access to the Sensor server, in the address bar of the browser, enter: https://<IP address of the server with the Sensor component>:<9443>.
The web interface of the Sensor component is displayed in the browser. The name of the browser tab with the web interface page contains the name of the Sensor component that was specified when the component was connected to the Central Node.
In the web interface of the Sensor component, you can do the following:
- Upload a communication data package to connect the component to the Central Node component.
- View the fingerprint of the certificate signing request to compare it with the fingerprint in the web interface of Kaspersky Anti Targeted Attack Platform, when the component is connected to the Central Node automatically over the network.
- View the status of the connection of the component to the Central Node.
Changing the server name
To rename the Central Node server:
- Select the Sensor servers section in the window of the application web interface.
- Click the card of the relevant Sensor component.
This opens a window with information about the component.
- Click Edit.
- Go to the General tab.
- In the Sensor name field, enter a new name.
The name must be unique (may not be the same as the name of another component) and may contain up to 100 characters. You can use letters of the English alphabet, numerals, a space, and the special characters: _ and - (for example, Server_1). The name must begin and end with any valid character other than a space.
- Click Save.
The server is renamed.
Page top
Managing monitoring points
Kaspersky Anti Targeted Attack Platform uses
to receive and process mirrored SPAN traffic. Monitoring points can be added and removed for the Central Node and Sensor components.Each monitoring point must be associated with a network interface that receives a copy of traffic from a certain network segment. To add monitoring points, you can use network interfaces that satisfy the following conditions:
- Network interface type: Ethernet.
- MAC address: not 00:00:00:00:00:00.
- The network interface is designated for receiving a copy of network traffic and is not used for other purposes (for example, for connecting servers with installed application components).
Monitoring points can be enabled or disabled. You can disable a monitoring point to temporarily stop monitoring a network segment from which a copy of the traffic is received on the network interface. When you need to resume monitoring, you can re-enable the monitoring point.
After disabling or removing a monitoring point, the application may log events involving this monitoring point for some time. This is due to a possible lag in processing incoming traffic when the Central Node component is under high load.
Monitoring point details are displayed in the card of the network interface to which this monitoring point is linked. If necessary, you can rename the monitoring point.
Adding a monitoring point
To receive and process traffic from the network on a network interface of a node, you need to add a monitoring point to that network interface.
To add a monitoring point to a network interface:
- Select the Sensor servers section in the window of the application web interface.
- In the card of the relevant network interface, click the Add monitoring point link.
This opens the window for adding a monitoring point.
- In the Monitoring point name field, enter a name for the monitoring point.
You can use uppercase and lowercase letters of the Latin alphabet, numbers, and
_and-characters.The name of the monitoring point must satisfy the following requirements:
- Is unique (not assigned to any other monitoring point).
- Contains 1 to 100 characters.
- Click Add monitoring point.
The monitoring point is added.
Renaming a monitoring point
You can rename the monitoring point associated with a network interface.
The new name of the monitoring point is reflected in the events logged after the renaming. Previously logged events keep the old name of the monitoring point.
To rename a monitoring point:
- Select the Sensor servers section in the window of the application web interface.
- Click the card of the relevant network interface.
- This opens a window with information about the network interface.
- Click Edit.
- In the Monitoring point name field, enter a new name.
You can use uppercase and lowercase letters of the Latin alphabet, numbers, and
_and-characters.The name of the monitoring point must satisfy the following requirements:
- Is unique (not assigned to any other monitoring point).
- Contains 1 to 100 characters.
- Click Save.
The monitoring point is renamed.
Page top
Enabling monitoring points
If a monitoring point is disabled, the application does not receive or process traffic arriving at its network interface. If you want to resume receiving and processing traffic, you must enable the monitoring point.
You can enable monitoring points individually or all at once, for one component or for all components.
Only users with the Administrator role can enable monitoring points.
To enable monitoring points:
- Select the Sensor servers section in the window of the application web interface.
- Do one of the following:
- If you want to enable an individual monitoring point, in the card of the relevant component, click the Enable button. The button is available if the monitoring point is disabled.
- If you want to enable all monitoring points, in the card of the relevant component, click the Enable all button. The button is available if the component has network interfaces with disabled monitoring points.
- If you want to enable all monitoring points for all components, click the Enable on all nodes link in the toolbar.
- Wait for the changes to be applied.
The selected monitoring points are enabled.
Page top
Disabling monitoring points
You can disable a monitoring point if you want to temporarily stop receiving and processing traffic on the network interface of that monitoring point.
You can disable monitoring points individually or all at the same time, for all components.
To disable monitoring points:
- Select the Sensor servers section in the window of the application web interface.
- Do one of the following:
- If you want to disable an individual monitoring point, in the card of the relevant component, click the Disable button. The button is available if the monitoring point is enabled.
- If you want to disable all monitoring points, in the card of the relevant component, click the Disable all button. The button is available if the component has network interfaces with enabled monitoring points.
- If you want to disable all monitoring points for all components, click the Disable on all nodes link in the toolbar.
- Wait for the changes to be applied.
The selected monitoring points are disabled.
Page top
Deleting a monitoring point
You can delete the monitoring point associated with a network interface. Deleting a monitoring point may be necessary if the network interface will no longer be used to receive traffic.
If you need to temporarily stop receiving traffic on the network interface of the monitoring point (for example, during maintenance and commissioning), you can disable the monitoring point without deleting it.
Traffic received from the monitoring point before it was deleted is not deleted from the database. Also, information about this monitoring point is kept in the table of logged events.
To delete a monitoring point:
- Select the Sensor servers section in the window of the application web interface.
- Click the card of the relevant network interface.
- This opens a window with information about the network interface.
- Click Delete.
A window with a confirmation prompt opens. If the monitoring point is enabled, the application prompts you to disable the monitoring point.
- In the prompt window, confirm the deletion of the monitoring point.
The monitoring point is deleted.
Page top
Configuring the maximum size of a scanned file
If you are using the distributed solution and multitenancy mode, use the web interface of the PCN or SCN server for which you want to configure parameters.
To configure the maximum size of a scanned file:
- Select the Sensor servers section in the window of the application web interface.
- Click the card of the relevant Sensor component.
This opens a window with information about the component.
- Click Edit.
- Go to the Other tab.
- Set the Set size limit toggle switch to Enabled.
- In the Unit of measure field, select a unit of measure.
- In the Space field, enter the maximum allowed size of a file.
- Click Save.
The maximum size of a scanned file will be configured.
If you want to set the maximum size of a scanned file to a value greater than 100 MB:
- Enter the management console of the Sensor server via the SSH protocol or through a terminal.
- When the system prompts you, enter the administrator user name and the password that was specified during installation of the component.
- The application component administrator menu is displayed.
- Select the Technical Support Mode.
- Press ENTER.
- This opens the Technical Support Mode confirmation window.
- Confirm that you want to manage the application in Technical Support Mode. To do so, select Yes and press ENTER.
- To view the current scanned file size limit, run the following command:
docker exec $(docker ps -q -f name=nta_core) grep body-limit /var/opt/kaspersky/kics4net/ids/client/templates/suricata.yaml.templ | grep -v '#' - The current limit is displayed in the request-body-limit and response-body-limit fields. The current limit is displayed in bytes.
- To change the current limit, run the following command:
exec $(docker ps -q -f name=nta_core) sed -i 's/<previous value in bytes>/<new value in bytes>/' /var/opt/kaspersky/kics4net/ids/client/templates/suricata.yaml.templ - Complete steps 1–8 of the instructions above.
You can set the maximum size for a scanned file over 100 MB.
Page top
Configuring HTTP packet body dumping
If you are using the distributed solution and multitenancy mode, use the web interface of the PCN or SCN server for which you want to configure parameters.
To configure HTTP packet body dumping:
- Select the Sensor servers section in the window of the application web interface.
- Click the card of the relevant Sensor component.
This opens a window with information about the component.
- Click Edit.
- Go to the Other tab.
- In the Dump HTTP body section:
- If you want to enable HTTP packet body dumping, set the Enable http-body toggle switch to Enabled.
By default, the toggle switch is in the Disabled position.
- If you want to disable HTTP packet body dumping, set the Enable http-body toggle switch to Disabled.
- If you want to enable HTTP packet body dumping, set the Enable http-body toggle switch to Enabled.
- Click Save.
HTTP packet body dumping is enabled or disabled.
Page top
Configuring integration with a mail server via SMTP
If you are using the distributed solution and multitenancy mode, use the web interface of the PCN or SCN server for which you want to configure parameters.
To configure integration with a mail server over SMTP:
- Select the Sensor servers section in the window of the application web interface.
- Click the card of the relevant Sensor component.
This opens a window with information about the component.
- Click Edit.
- Go to the SMTP integration tab.
- If you want to enable integration with a mail server via SMTP, set the Enable SMTP integration toggle switch to Enabled.
- In the Destination domains field, specify the name of the mail domain or subdomain. The application will scan email messages sent to mailboxes of the specified domains.
To disable a domain or subdomain, enclose it in the
!domain.tldform.If you leave the mail domain name blank, the application will receive messages sent to any email address.
- In the Clients field, specify the IP addresses of hosts and/or masks of subnets (in CIDR notation) with which the application is allowed to interact over the SMTP protocol.
To disable a host or subnet, enclose the address in the
!hostform.If you leave this field blank, the application will receive the following messages:
- From any email addresses if you specified email domains in the Destination domains field.
- From a mail server in the same subnet as the Sensor server component if no domain is indicated in the Destination domains field.
- If you want to set the maximum allowed size of incoming messages, set the Set message size toggle switch to Enabled.
- In the Unit of measure field, select a unit of measure.
- In the Space field, enter the maximum allowed size of a file.
- If you want to configure TLS encryption of SMTP connections to the mail server, under Client TLS security level, select one of the following options:
- No TLS encryption.
The application will not employ TLS encryption of connections with a mail server.
- Allow TLS encryption for incoming messages.
The application will support TLS encryption of the connection, but encryption will not be mandatory.
- Require TLS encryption for incoming messages.
The application will receive messages only over encrypted channels.
- No TLS encryption.
- Click the Download TLS certificate button to save the TLS certificate of the server with the Sensor component on the computer in the browser's downloads folder.
This certificate is required for authentication on the mail server.
- In the Requesting client TLS certificate settings group, select one of the following options:
- Do not request.
The application will not verify the TLS certificate of the mail server.
- Request.
The application will request a TLS certificate from the mail server, if one is available.
- Require.
The application will receive messages only from those mail servers that have a TLS certificate.
- Do not request.
- Click Save.
Integration with a mail server via SMTP will be configured. The application will scan email messages received over the SMTP protocol according to the defined settings.
If you have deployed the Central Node and Sensor components as a cluster, you can configure high availability integration with the mail server.
To configure high availability integration with the mail server:
- Configure Round Robin on the DNS server for the domain name corresponding to the Central Node cluster.
- Specify this domain name in the mail server settings.
Integration with the mail server will be configured based on the domain name. The mail server will communicate with a random server in the cluster. If this server fails, the mail server will communicate with another healthy server in the cluster.
For version 7.0 of the the application in a cluster configuration, when integrated with a mail server, an error may occur when sending an email message: "451 4.3.0 Error: queue file write error".
To resolve the error:
- Enter the management console of any cluster server over SSH or using a terminal.
- When the system prompts you, enter the administrator user name and the password that was specified during installation of the component.
The application component administrator menu is displayed.
- In the application administrator menu, select Technical Support Mode.
- Press ENTER.
This opens the Technical Support Mode confirmation window.
- Confirm that you want to manage the application in Technical Support Mode. To do so, select Yes and press ENTER.
- Run the following command:
for addr in <IP addresses of cluster servers (separated by spaces)>; do nc -zv $addr 10025; doneThe list of servers is displayed on the console.
- In the web interface of the application, at step 7 of the instructions above, specify the IP address of the server for which the
localhost [127.0.0.1] 10025 (?) openstring is displayed on the console.
The error is resolved.
If you do not get a localhost [127.0.0.1] 10025 (?) open string for any of the cluster servers, please contact Technical Support.
When installing the Central Node component of version 7.0.3 on the server, Kaspersky Anti Targeted Attack Platform may refuse email messages received via SMTP. The sender may get a "Connection refused" error.
To remove the limitation:
- Log in to the management console of the relevant Central Node server over SSH or through a terminal.
- When the system prompts you, enter the administrator user name and the password that was specified during installation of the component.
The application component administrator menu is displayed.
- In the application administrator menu, select Technical Support Mode.
- Press ENTER.
This opens the Technical Support Mode confirmation window.
- Confirm that you want to manage the application in Technical Support Mode. To do so, select Yes and press ENTER.
- Run the following command:
sudo -i - Run the following commands:
docker exec $(docker ps -q -f name=preprocessor_span) supervisorctl restart preprocessordocker exec $(docker ps -q -f name=preprocessor_smtp) supervisorctl restart preprocessor
The limitation is removed.
Page top
Configuring integration with a proxy server via ICAP
Integration with a proxy server over ICAP with feedback allows you to prevent malicious objects from entering the corporate LAN and prevent users of the host from visiting malicious or phishing websites. Kaspersky Anti Targeted Attack Platform acts as an ICAP server, and your proxy server acts as an ICAP client. The proxy server sends ICAP requests to the ICAP server. The ICAP server runs a scan and returns the result to the proxy server. If any threats are detected, a notification HTML page is displayed to the user on the host.
Enabling and disabling integration with a proxy server via ICAP
If you are using the distributed solution and multitenancy mode, use the web interface of the PCN or SCN server for which you want to configure parameters.
When a standalone proxy server is used, Kaspersky Anti Targeted Attack Platform does not provide encryption of ICAP traffic or authentication of ICAP clients by default. The application administrator must take steps to ensure a secure network connection between your proxy server and Kaspersky Anti Targeted Attack Platform by using traffic tunneling or iptables.
To enable or disable integration with a proxy server via ICAP on a server with the Central Node and Sensor components installed:
- Select the Sensor servers section in the window of the application web interface.
- Click the card of the relevant Sensor component.
This opens a window with information about the component.
- Click Edit.
- Go to the ICAP integration with proxy server tab.
- Do the following:
- If you want to enable integration with a proxy server via ICAP, move the Enable ICAP integration toggle switch to Enabled.
- If you want to disable integration with a proxy server via ICAP, move the Enable ICAP integration toggle switch to Disabled.
Integration with a proxy server via ICAP is enabled.
To enable or disable integration with a proxy server via ICAP on an individual server with the Sensor component:
- Enter the management console of the Sensor server via the SSH protocol or through a terminal.
- When the system prompts you, enter the administrator user name and the password that was set during the installation of the application.
This opens the settings menu for the Sensor component. If the menu does not open, enter the
kata-admin-menucommand andpress - Go to the Program settings → Configure ICAP integration section.
To select a row, you can use the ↑, ↓, and ENTER keys. The selected row is highlighted in red.
- This opens a window, in that window, select the Enabled line and press the ENTER key.
[x] is displayed to the right of the Enabled setting.
- In the settings of your proxy server, enter the URL from the RESPMOD field.
Integration with the proxy server and an individual server with the Sensor component via ICAP is configured.
If you have deployed the Central Node and Sensor components as a cluster, you can configure high availability integration with a proxy server.
To configure the high availability integration with the proxy server:
- Configure Round Robin on the DNS server for the domain name corresponding to the Central Node cluster.
- Specify this domain name in the proxy server settings.
Integration with the proxy server will be configured based on the domain name. The proxy server will communicate with a random server in the cluster. If this server fails, the proxy server will communicate with another healthy server in the cluster.
Page top
Enabling or disabling real-time scanning of ICAP traffic
If you are using the distributed solution and multitenancy mode, use the web interface of the PCN or SCN server for which you want to configure parameters.
You can enable or disable real-time scanning of ICAP traffic if integration with a proxy server via ICAP is enabled.
If real-time scanning of ICAP traffic is enabled, Kaspersky Anti Targeted Attack Platform sends information about scanned objects to the ICAP client in real time. This helps prevent downloading malicious objects and clicking untrusted links.
To enable or disable real-time scanning of ICAP traffic on a server with the Central Node and Sensor components installed:
- Select the Sensor servers section in the window of the application web interface.
- Click the card of the relevant Sensor component.
This opens a window with information about the component.
- Click Edit.
- Go to the ICAP integration with proxy server tab.
- Under Real-time scanning, select one of the following options:
- Disabled
If you select this option, real-time scanning of ICAP traffic is disabled. This option is selected by default.
- Enabled, standard ICAP traffic scanning.
When this type of scan is enabled, the reputation of files and URLs is checked against the knowledge base of Kaspersky Security Network, and files are scanned by the Sandbox component and Anti-Malware Engine and YARA modules. The files remain available while they are being scanned by the Sandbox component.
- Enabled, advanced ICAP traffic scanning.
When this type of scan is enabled, the reputation of files and URLs is checked against the knowledge base of Kaspersky Security Network, and files are scanned by the Sandbox component and Anti-Malware Engine and YARA modules. The files are unavailable while they are being scanned by the Sandbox component.
- Disabled
- Under Extract user name:
If you want to get the user name from the ICAP server, set the Extract user name toggle switch field to Enabled. If you need to use Base64 decoding, select the Use Base64 decoding check box.
- Click Save.
Real-time scanning of ICAP traffic is enabled or disabled.
To enable or disable real-time scanning of ICAP traffic on an individual server with the Sensor component installed:
- Enter the management console of the Sensor server via the SSH protocol or through a terminal.
- When the system prompts you, enter the administrator user name and the password that was set during the installation of the application.
This opens the settings menu for the Sensor component. If the menu does not open, enter the
kata-admin-menucommand andpress - Go to the Program settings → Configure ICAP integration section.
To select a row, you can use the ↑, ↓, and ENTER keys. The selected row is highlighted in red.
- This opens a window; in that window, make sure that [x] is displayed to the right of the Enabled setting.
- Select one of the following options:
- Disable real-time scanning.
If you select this option, real-time scanning of ICAP traffic is disabled. This option is selected by default.
- Standard ICAP scanning.
When this type of scan is enabled, the reputation of files and URLs is checked against the knowledge base of Kaspersky Security Network, and files are scanned by the Anti-Malware Engine and YARA modules.
- Advanced ICAP scanning.
When this type of scan is enabled, the reputation of files and URLs is checked against the knowledge base of Kaspersky Security Network, and files are scanned by the Sandbox component and Anti-Malware Engine and YARA modules.
- Disable real-time scanning.
- Select an option and press ENTER. (O) is displayed to the right of the selected option.
To select a row, you can use the ↑ and ↓ keys. The selected row is highlighted in red.
- If you enabled real-time scanning of ICAP traffic and enabled the advanced scanning mode or the standard scanning mode, specify the URL from the REQMOD field in the settings of your proxy server.
Real-time scanning of ICAP traffic on an individual server with the Sensor component is enabled or disabled.
If you enabled real-time scanning of ICAP traffic, scanning does not work if integration with the proxy server is disabled. All ICAP traffic scanning settings are saved. When you re-enable integration with the proxy server, ICAP traffic scanning is also enabled.
Page top
Configuring real-time scanning of ICAP traffic
If you are using the distributed solution and multitenancy mode, use the web interface of the PCN or SCN server for which you want to configure parameters.
Real-time ICAP traffic scanning on standalone servers with the Sensor component can only be configured in Technical Support Mode. To perform actions in Technical Support Mode, we recommend contacting Technical Support.
You can configure real-time ICAP traffic scanning on a server with the Central Node and Sensor components for anti-virus scanning of data. Scan results are displayed to the user of the host on a notification HTML page.
To configure real-time ICAP traffic scanning:
- In the window of the application web interface, select the Settings section, ICAP traffic scanning subsection.
The ICAP traffic scanning settings page is displayed.
By default, under Notifications, pages corresponding to the following events are loaded:
- The page uploaded in the Link blocked field is displayed if a threat is detected at the address requested by the user.
- The page uploaded in the File blocked field is displayed if a threat is detected in a scanned file.
- The page uploaded in the Scan file field is displayed if a file scan is started. If the file is safe, the user can click a link to download the file.
- The page uploaded in the File expired field is displayed if the file was scanned, but the storage duration for that file has expired.
By default, HTML pages from the distribution kit are loaded in Kaspersky Anti Targeted Attack Platform. You can upload your own notification pages and configure how they must be displayed. The size of a notification page must not exceed 1.5 MB. If the uploaded notification page is larger than 1.5 MB, an error is displayed.
- Under File block threshold, in the Sandbox alert importance field, select a value from the drop-down list. These values correspond to the possible impact of the alert on the security of a computer or your corporate network based on the expert opinion of Kaspersky.
This setting can take one of the following values:
- High
 for a high importance alert. This option is selected by default.
 - Medium
 for a medium-importance alert.
 - Low
 for a low-importance alert.
- High
- Under Scan timeout, in the Timeout field, specify the time after which the link to the scanned file is unblocked and downloading the scanned file becomes possible.
The default value is 10 minutes. You can set any value greater than 1 minute.
- Click Apply.
The scan is performed with the specified settings.
Page top
Configuring the display of notification pages
If you are using the distributed solution and multitenancy mode, use the web interface of the PCN or SCN server for which you want to configure parameters.
During real-time ICAP traffic scanning , Kaspersky Anti Targeted Attack Platform can block URL navigation and file download. While these operations are in progress, a HTML notification page is displayed to the user on the host on which a URL access attempt or a file download request was made. If you want to display your own pages instead of the default pages, you can upload your own customized HTML pages.
To upload a notification page:
- In the window of the application web interface, select the Settings section, ICAP traffic scanning subsection.
- In the Notifications section, click Browse next to one of the fields you need.
- This opens a window; in that window, select your HTML page.
- Click Open.
Your page is uploaded.
Configuring recording of mirrored traffic from SPAN ports
With Kaspersky Anti Targeted Attack Platform, you can save mirrored traffic from SPAN ports for investigation and detection of malicious activity within the perimeter of your corporate LAN. With mirrored traffic recording, you can perform retrospective analysis of network events and investigate the actions of hackers. Traffic is saved as dumps in PCAP format.
To save mirrored traffic from SPAN ports, enable the recording of such traffic and configure it in the web interface of the application or in the administrator menu of the Sensor component. You can also select network protocols for receiving traffic.
Selecting network protocols for receiving mirrored traffic from SPAN ports
You can select network protocols for receiving mirrored traffic from SPAN ports in the Kaspersky Anti Targeted Attack Platform web interface or in the administrator menu of the Sensor component.
If you are using the distributed solution and multitenancy mode, perform the configuration actions in the web interface of the PCN or SCN server to which the Sensor component is connected.
To select network protocols for receiving mirrored traffic from SPAN ports in the administrator menu of the Sensor component:
- Enter the management console of the Sensor server via the SSH protocol or through a terminal.
- When the system prompts you, enter the administrator user name and the password that was set during the installation of the application.
This opens the settings menu for the Sensor component. If the menu does not open, enter the
kata-admin-menucommand andpress - Go to the Program settings → Configure traffic capture → Setup capture protocols section using the ↑, ↓, and ENTER keys. The selected row is highlighted in red.
This opens a window where you can enable or disable receipt of mirrored traffic from SPAN ports for the following network protocols:
- DNS
- FTP
- HTTP
- HTTP2
- SMTP
- SMB
- NFS
To analyze NFS traffic, you must mount the NFS partition and specify the version of the protocol.
Example:
for NFS v.4:
mount -t nfs -o vers=4 -O uid=1000,iocharset=utf-8 <address>:/from/dir /to/dirfor NFS v.3:
mount -t nfs -o vers=3 -O uid=1000,iocharset=utf-8 <address>:/from/dir /to/dir
If receipt of mirrored traffic from a SPAN port via a network protocol is enabled, [x] is displayed to the right of the network protocol name. If receiving mirrored traffic from a SPAN port is disabled for a particular network protocol, [ ] is displayed to the right of the name of that protocol.
By default, receipt of mirrored traffic from SPAN ports is enabled for all network protocols except HTTP2.
- If you want to enable or disable the receipt of mirrored traffic from SPAN ports for a particular network protocol, select that using the ↑, ↓ keys and press ENTER.
- Select the line containing Apply and Exit and press ENTER.
Network protocols for receiving mirrored traffic from SPAN ports are selected.
Page top
Configuring the recording of mirrored traffic from SPAN ports using the web interface
If you are using the distributed solution and multitenancy mode, use the web interface of the PCN or SCN server for which you want to configure parameters.
To enable and configure the recording of mirrored traffic from SPAN ports:
- Connect and configure external storage.
- Select the Sensor servers section in the window of the application web interface.
- Click the card of the relevant Sensor component.
This opens a window with information about the component.
- Click Edit.
- Go to the External storage tab.
This tab is not displayed if an external storage is not connected.
In the External storage section, the Oldest packet field displays the date and time of the first saved dump in the external storage. The Newest packet field displays the date and time of the last dump saved to external storage.
- If you want to use the external storage, set the Record traffic toggle switch to Enabled.
By default, the toggle switch is in the Disabled position.
- In the Path for saving traffic field, specify the path to the directory in which you want the application to save traffic dumps.
- Do the following:
- Under Maximum storage size, specify the maximum size of traffic dumps that will be stored in the storage.
If the size of dumps in the storage exceeds the specified value, the earliest dumps are deleted, the total size of which is equal to the size of the new dumps.
If you reduce the maximum dump storage size, the earliest dumps are deleted, the total size of which is equal to the change of the setting.
- If you want to limit the capture of data in traffic, under Traffic filtering upon capture, set the BPF filtering toggle switch to Enabled. Traffic filtering can reduce the size of dumps in dump storage and facilitate traffic analysis.
In the BPF filtering rules, the filtering rule. The BPF filtering rule is written in the libpcap format. For more details about the syntax, please refer to the pcap-filter manual page.
Example of a filtering expression:
tcp port 102 or tcp port 502 - If you want to configure the traffic dump storage duration, in under Storage duration, set the Enable storage duration toggle switch to Enabled. In the Storage time (days) field, enter the number of days for which you want to store traffic dumps. Traffic dumps that are stored longer than the specified duration are deleted from the storage.
- Click Save.
- Under Maximum storage size, specify the maximum size of traffic dumps that will be stored in the storage.
The recording of mirrored traffic from SPAN ports is configured.
Page top
Configuring the recording of mirrored traffic from SPAN ports using the administrator menu of the Sensor component
To enable recording of mirrored SPAN traffic in the administrator menu of the Sensor component:
- Connect and configure external storage.
- Enter the management console of the Sensor server via the SSH protocol or through a terminal.
- When the system prompts you, enter the administrator user name and the password that was set during the installation of the application.
This opens the settings menu for the Sensor component. If the menu does not open, enter the
kata-admin-menucommand and press Enter. - Go to the Program settings → Configure traffic capture section.
To select a row, you can use the ↑, ↓, and Enter keys. The selected row is highlighted in red.
- This opens a window, in that window, select the Enabled traffic storage line and press Enter.
[x] is displayed to the right of the title of the line.
Raw network traffic recording on the standalone server with the Sensor component will be enabled.
- If necessary, edit raw network traffic recording settings:
- Select the Traffic storage size line and press Enter. This opens a window; in that window, specify the maximum total size of stored raw traffic dumps, in terabytes.
The minimum value is set to 100 GB by default. The maximum value is 1,000,000 TB. For correct operation of the application, the connected drive must have at least the specified amount of free disk space. If the number entered in this field exceeds the free disk space on the connected drive, an error is displayed.
- Select the OK button and press Enter.
- Select the Traffic capture BPF-filter line and press Enter. This opens a window; in that window, enter the filtering rule. The BPF filtering rule is written in the libpcap format. For more details about the syntax, please refer to the pcap-filter manual page.
Example of a filtering expression:
tcp port 102 or tcp port 502. - Select the OK button and press Enter.
- Select the Traffic storage duration (in days) line and press Enter. This opens a window; in that window, enter the storage duration for raw network traffic dumps in the storage, in days.
- Select the OK button and press Enter.
- Select the Traffic storage size line and press Enter. This opens a window; in that window, specify the maximum total size of stored raw traffic dumps, in terabytes.
The recording of mirrored SPAN traffic is configured in the administrator menu of the Sensor component.
Page top
Configuring integration with a mail server via POP3
If you are using the distributed solution and multitenancy mode, use the web interface of the PCN or SCN server for which you want to configure parameters.
To configure integration with a mail server over POP3:
- Select the Sensor servers section in the window of the application web interface.
- Click the card of the relevant Sensor component.
This opens a window with information about the component.
- Click Edit.
- Go to the POP3 integration tab.
- Set the Enable POP3 integration toggle switch to Enabled.
- In the Mail server field, specify the IP address of the mail server with which you want to configure integration.
- In the Port field, specify the port for connecting to the mail server.
- In the Receive every field, specify the mail server connection frequency (in seconds).
- If you want to use TLS encryption of connections with the mail server via POP3, select the Use TLS encryption check box.
- In the User name field, specify the account name used for accessing the mail server.
- In the Password field, specify the password for accessing the mail server.
The mail server must support Basic Authentication.
- In the TLS certificate drop-down list, select one of the following options:
- Accept any.
- Accept untrusted self-signed.
- Accept only trusted.
When establishing a connection with an external mail server, it is recommended to configure the acceptance of only trusted TLS certificates. If you accept untrusted TLS certificates, protection of the connection against
cannot be guaranteed. Even though the acceptance of trusted TLS certificates also cannot guarantee protection of the connection against MITM attacks, it is the most secure of the supported methods for integration with a mail server over the POP3 protocol. - If necessary, in the Cipher suite field, modify the OpenSSL settings used when establishing a connection with the mail server via POP3.
You can view reference information on OpenSSL by clicking the Help link.
- Click Save.
Integration with the mail server via POP3 will be configured.
If you have deployed the Central Node and Sensor components as a cluster, you can configure high availability integration with the mail server.
To configure high availability integration with the mail server:
- Configure Round Robin on the DNS server for the domain name corresponding to the Central Node cluster.
- Specify this domain name in the mail server settings.
Integration with the mail server will be configured based on the domain name. The mail server will communicate with a random server in the cluster. If this server fails, the mail server will communicate with another healthy server in the cluster.
Page top
Managing the cluster
You can view the table of cluster servers, add servers to the cluster, decommission servers, and enable or disable the cluster. if necessary, you can increase the disk space on the storage server.
Viewing the table of servers of the cluster
The table of cluster servers is displayed in the Cluster section of the application web interface.
The table contains the following information:
- Server type—server type depending on its role in the cluster.
The following values can be displayed:
- Storage.
- Processing.
- Status—server status.
The following values can be displayed:
- Connected.
- Not connected.
- Host name—server name.
- IP— IP address of the server.
- RAM—RAM load level of the server.
- CPU—CPU load level of the server.
- Action—Actions that you can perform with the server.
The following action is available: Delete.
Adding a server to a cluster
To add a server to the cluster, you need to start the installation of Kaspersky Anti Targeted Attack Platform on this server and follow the steps to install the components. The added server is displayed in the cluster server list.
Page top
Increasing the disk space on the storage server
You can increase the disk space on an operational storage server by installing an additional disk.
To increase the disk space of the storage server by means of an additional disk, you need to contact Technical Support.
The server is configured in Technical Support Mode.
Page top
Decommissioning servers
To decommission an operational server, you need to contact Technical Support.
If a server fails, you can decommission it on your own.
To decommission an inoperable processing server:
- Add a new processing server to the cluster.
- Remove the server from the cluster.
- Configure the sizing of the application for the new configuration.
The processing server will be decommissioned.
To decommission an inoperable storage server:
- Add a new storage server to the cluster.
- Contact Technical Support to remove the inoperable server from the cluster.
The storage server will be decommissioned.
Page top
Removing a server from a cluster
If you are using the distributed solution and multitenancy mode, use the web interface of the PCN or SCN server for which you want to configure parameters.
A removed server cannot be restored. Make sure that the selected server is not operational.
To remove a server from the cluster:
- In the window of the application web interface, select the Cluster section.
- In the Action column, click the Delete link opposite the server that you want to remove.
- Click Proceed.
The removal process will start. Removal may take about a day. Information about the removed server will not be displayed in the table of servers.
After removing the server, you can reconfigure the servers in the cluster or add a server with the same role to maintain the same level of application performance.
Page top
Starting up and shutting down the cluster
To shut down or start the cluster, we recommend contacting Technical Support. Do not shut down or start the cluster if you encounter problems with application health.
If you want to power off the healthy servers in the cluster, you must first shut down the cluster to avoid data loss.
To shut down a cluster:
- In the application web interface, go to the Cluster section.
- Click the Shut down button.
The main components of the application are stopped. You can now power off the cluster servers.
To start up the cluster servers:
- Disconnect power to the servers if it has not been previously disconnected.
- Power on the storage server.
- Power up the remaining servers.
The cluster servers will start up.
It takes approximately 90 minutes for all servers in the cluster to start up. The application web interface becomes available before all cluster servers are started. However, for users with the Senior security officer, Security officer, Security auditor roles, the application web interface does not display the application menu, and users with the Administrator can manage only the Server configuration section.
We strongly discourage managing the sizing settings of the application until all the servers in the cluster are up and running.
When all of the servers in the cluster are up and running, the application web interface menu is displayed normally.
Page top
Notifications about the maximum allowed CPU and RAM load for the Central Node and Sensor servers
Maintaining a high load on the CPU and RAM of the Central Node and Sensor servers may prevent application components from working.
You can configure the maximum CPU and RAM usage on Central Node and Sensor servers; if these limits are exceeded, in the upper part of the Dashboard section of the application web interface for users with the Senior security officer, Security officer, and Administrator roles, a yellow warning box is displayed. You can also configure notifications to be sent to one or more email addresses and an SNMP protocol connection for sending information about the CPU and RAM load to external systems that support this protocol.
If you have deployed the Central Node and Sensor components as a cluster, warnings are displayed separately for each server in the cluster.
Users with the Senior security officer or Security officer role can also create rules for sending notifications. In this case, sending notifications correctly requires configuring maximum allowed load values for the CPU and RAM of servers, as well as notification settings on the server.
In existing rules for sending notifications about application components, the CPU load and RAM load notifications are enabled automatically if the All check box is selected under Components when the rule is created.
Configuring the maximum allowable CPU and RAM load of the Central Node and Sensor servers
In the distributed solution and multitenancy mode, you need to set the maximum allowed load values for the CPU and RAM load of each Central Node server from which you want to receive notifications. If you use a Central Node cluster, you can configure these settings on any cluster server.
To configure the maximum allowed load on the CPU and RAM of the Central Node and Sensor servers:
- In the window of the application web interface, select the Settings section, General settings subsection.
- Under Monitoring:
- In the Warning of CPU usage above N % for M minutes field, enter the maximum allowed CPU usage and time period for which the maximum load can be maintained.
By default, the maximum CPU load is 95% for 5 minutes.
- In the Warning of RAM usage above N % for M minutes field, enter the maximum allowed RAM usage and time period for which the maximum usage can be maintained.
By default, the maximum RAM usage is 95% for 5 minutes.
- In the Warning of CPU usage above N % for M minutes field, enter the maximum allowed CPU usage and time period for which the maximum load can be maintained.
- Click Apply.
The maximum allowed load of server CPU and RAM will be configured. If one of the values is exceeded on the Central Node and/or Sensor server, in the upper part of the Dashboard section of the application web interface for users with Senior security officer, Security officer, and Administrator roles, a yellow warning box is displayed.
Page top
Configuring the SNMP protocol connection
You can send information about the CPU and RAM load on Central Node and Sensor servers to external systems that support the SNMP protocol. To do so, you must configure the connection for the protocol.
If the Central Node component is deployed as a cluster, data about the CPU and RAM load of each server in the cluster is sent to external systems.
To configure the SNMP protocol connection on the Central Node server:
- In the window of the application web interface, select the Settings section, General settings subsection.
- Under SNMP, select the Use SNMP check box.
- In the Protocol version field, select a protocol version:
- v2c.
- v3.
- If you selected the v2c protocol version, in the Community string field, enter the password that will be used for connecting to Kaspersky Anti Targeted Attack Platform.
- If you selected v3:
- In the Authentication protocol field, select one of the following options for checking the accuracy and integrity of data sent to the external system:
- MD5.
- SHA256.
- In the User name field, enter the user name.
- In the Password field, enter the password for authentication.
User name and password configured in the User name and Password fields must match the user name and password configured when creating the account in the external system. If the credentials do not match, the connection cannot be established.
- In the Privacy protocol field, select an encryption type:
- DES.
- AES.
- In the Password field, enter the encryption password.
The password configured in this field must match the password configured in the external system.
- In the Authentication protocol field, select one of the following options for checking the accuracy and integrity of data sent to the external system:
Protocol connection on the Central Node server is configured. If the request for data is successfully processed, the server of the external system displays information about CPU and RAM load of the Central Node server.
To configure the SNMP protocol connection on the Sensor server:
- Enter the management console of the Sensor server via the SSH protocol or through a terminal.
- When the system prompts you, enter the administrator user name and the password that was set during the installation of the application.
The application component administrator menu is displayed.
- Follow steps 2 through 5 of the instructions above.
Protocol connection on the Sensor server is configured. If the request is successfully processed, the server of the external system displays information about CPU and RAM load of the Sensor server.
In distributed solution and multitenancy mode, SNMP connection settings for each PCN, SCN, and Sensor server must be configured separately.
Description of MIB objects of Kaspersky Anti Targeted Attack Platform
The tables below provide information about
objects of Kaspersky Anti Targeted Attack Platform.Information about hard drive, CPU, and RAM load of Central Node and Sensor servers
Information about hard drive, CPU, and RAM load of Central Node and Sensor servers
Symbolic name |
Description |
Object identifier (OID) |
|---|---|---|
|
Total size of the disk or partition, KB. |
1.3.6.1.4.1.2021.9.1.6 |
|
Available space on the disk, KB. |
1.3.6.1.4.1.2021.9.1.7 |
|
Used space on the disk, KB. |
1.3.6.1.4.1.2021.9.1.8 |
|
Percentage of space used on disk, %. |
1.3.6.1.4.1.2021.9.1.9 |
|
System load average for 1, 5 and 15 minutes. |
1.3.6.1.4.1.2021.10.1.3 |
|
Total RAM size, KB. |
1.3.6.1.4.1.2021.4.5 |
|
Total RAM used, KB. |
1.3.6.1.4.1.2021.4.6 |
|
Total RAM free, KB. |
1.3.6.1.4.1.2021.4.11 |
Managing Endpoint Agent host information
The application that is used as the Endpoint Agent component is installed on individual computers (hereinafter also referred to as "hosts") in the IT infrastructure of the organization. The application continuously monitors processes running on those hosts, active network connections, and files that are being modified.
Users with the Senior security officer, Security officer, Security auditor, and Administrator roles can assess how regularly data is received from hosts with the Endpoint Agent component on the Endpoint Agents tab of the web interface window of the Central Node server for tenants to whose data the user has access. If you are using the distributed solution and multitenancy mode, the web interface of the PCN server displays the list of hosts with the Endpoint Agent component for the PCN and all connected SCNs.
Users with the Administrator role can configure the display of how regularly data is received from hosts with Endpoint Agent for tenants to whose data they have access.
If suspicious network activity is detected, users with the Senior security officer role can isolate from the network any host with Kaspersky Endpoint Agent, for tenants to whose data the user has access. In this case, the connection between the server with the Central Node component and a host with the Endpoint Agent component will not be interrupted.
In order to provide support in case of problems with the Endpoint Agent component, Technical Support staff may ask you to perform the following actions for debugging purposes (including in Technical Support Mode):
- Activate collection of extended diagnostic information.
- Modify the settings of individual application components.
- Modify the settings for storing and sending the obtained diagnostic information.
- Configure network traffic to be intercepted and saved to a file.
Technical Support staff will provide all the information needed to perform these operations (description of the sequence of steps, settings to be modified, configuration files, scripts, additional command line functionality, debugging modules, special-purpose utilities, and other resources) and inform you about the scope of data obtained for debugging purposes. The retrieved diagnostic information is saved on the user's computer. The retrieved data is not automatically sent to Kaspersky.
The operations listed above should be performed only when instructed by and under the supervision of Technical Support experts. Unsupervised changes to application settings performed in ways other than those described in this manual or according to the instructions of Technical Support experts can slow down or crash the operating system, reduce computer security, or compromise the availability and integrity of data being processed.
Selecting a tenant to manage in the Endpoint Agents section
If you are using the distributed solution and multitenancy mode, prior to using the Assets → Endpoint Agents section, you must select the tenant whose data you want to view.
To select a tenant to manage in the Assets → Endpoint Agents section:
- In the upper part of the application web interface menu, click the arrow next to the name of the tenant.
- In the drop-down list, select a tenant.
Data for the selected tenant is displayed. If you want to select a different tenant, repeat the steps to select the tenant.
Page top
Viewing the table of hosts with the Endpoint Agent component on a standalone Central Node server
The table of hosts with the Endpoint Agent component is located in the Endpoint Agents section of the application web interface window.
The table can display the following data:
- Number of hosts and activity indicators of the Endpoint Agent component:
- Critical inactivity is the number of hosts from which latest data was received a very long time ago.
- Warning is the number hosts from which latest data was received a long time ago.
- Normal activity is the number of hosts from which latest data was recently received.
- Host—Name of the host with the Endpoint Agent component.
- Servers—Names of servers to which the host with the Endpoint Agent component is connected.
This field is displayed if you are using the distributed solution and multitenancy mode.
- IP—IP address of the computer where the Endpoint Agent component is installed.
- OS—Version of the operating system that is installed on the computer with the Endpoint Agent component.
- License is the status of the license key of the application that is used as the Endpoint Agent component.
- Version is the version of the application that is used in the role of the Endpoint Agent component.
- Activity—Activity indicator of the Endpoint Agent component. Possible values:
- Normal activity for hosts from which latest data was recently received.
- Warning for hosts from which latest data was received a long time ago.
- Critical inactivity for hosts from which latest data was received an extremely long time ago.
- Last connection for the date and time of the last connection of the Endpoint Agent component to the Central Node server.
Clicking a link in a column of the table opens a list in which you can select one of the following actions:
- Filter by this value.
- Exclude from filter.
- Copy value to clipboard.
Viewing information about a host
To view information about a host with the Endpoint Agent component:
- Select the Assets section in the application web interface window.
- Go to the Endpoint Agents tab.
- Select the host for which you want to view information.
This opens a window containing information about the host.
The window contains the following information:
- In the Host section:
- Name is the name of the host with the Endpoint Agent component.
- IP is the IP address of the host where the Endpoint Agent component is installed.
- OS is the version of the operating system on the host with the Endpoint Agent component installed.
- Server—Name of the SCN or PCN server. Only displayed in distributed solution and multitenancy mode.
- In the Endpoint Agent section:
- Version is the version of the application that is used in the role of the Endpoint Agent component.
- Activity is the activity indicator of the Endpoint Agent component. Possible values:
- Normal activity for hosts from which latest data was recently received.
- Warning for hosts from which latest data was received a long time ago.
- Critical inactivity for hosts from which latest data was received an extremely long time ago.
- Connected to server—Name of the Central Node, SCN, or PCN server to which the host is connected.
- Last connection—time of the last connection to the Central Node, SCN, or PCN server.
- License key status is the status of the license key of the application that is used as the Endpoint Agent component.
The following action is available by clicking the links with the host name and its IP address: Copy value to clipboard.
Filtering and searching hosts with the Endpoint Agent component by host name
To filter or search for hosts with the Endpoint Agent component by host name:
- Select the Assets section in the application web interface window.
- Go to the Endpoint Agents tab.
This opens the table of hosts.
- Click the Host link to open the filter configuration window.
- If you want to display only isolated hosts, select the Show isolated Endpoint Agents only check box.
- In the drop-down list, select one of the following filtering operators:
- Contain
- Not contain
- In the entry field, specify one or several characters of the host name.
- To add a filter condition using a different criterion, click
 and specify the filter condition.
 - If you want to delete the filter condition, click the
 button to the right of the field.
 - Click Apply.
The filter configuration window closes.
The table displays only those hosts that match the filter criteria you have set.
You can use multiple filters at the same time.
Filtering and searching hosts with the Endpoint Agent component that have been isolated from the network
To filter or search for hosts with the Endpoint Agent component that are isolated from the network:
- Select the Assets section in the application web interface window.
- Go to the Endpoint Agents tab.
This opens the table of hosts.
- Click the Host link to open the filter configuration window.
- Select the Show isolated Endpoint Agents only check box.
- Click Apply.
The filter configuration window closes.
The table displays only those hosts that match the filter criteria you have set.
You can use multiple filters at the same time.
Filtering and searching hosts with the Endpoint Agent component by PCN and SCN server names
If you are using the distributed solution and multitenancy mode, you can filter or find hosts with the Kaspersky Endpoint Agent component based on the names of PCN and SCN servers to which those hosts are connected.
To filter or search for hosts with the Endpoint Agent component by the names of PCN and SCN servers:
- Select the Assets section in the application web interface window.
- Go to the Endpoint Agents tab.
This opens the table of hosts.
- Click the Servers link to open the filter configuration window.
- Select check boxes next to names of servers by which you want to filter or search for hosts with the Endpoint Agent component.
- Click Apply.
The filter configuration window closes.
The table displays only those hosts that match the filter criteria you have set.
You can use multiple filters at the same time.
Filtering and searching hosts with the Endpoint Agent component by computer IP address
To filter or search for hosts with the Endpoint Agent component by IP address of the computer on which the application is installed:
- Select the Assets section in the application web interface window.
- Go to the Endpoint Agents tab.
This opens the table of hosts.
- Click the IP link to open the filter configuration window.
- In the drop-down list, select one of the following filtering operators:
- Contain
- Not contain
- In the entry field, specify one or several characters of the computer IP address. You can enter the IP address or subnet mask in IPv4 format (for example,
192.0.0.1or192.0.0.0/16). - To add a filter condition using a different criterion, click and specify the filter condition.
- If you want to delete the filter condition, click the button to the right of the field.
- Click Apply.
The filter configuration window closes.
The table displays only those hosts that match the filter criteria you have set.
You can use multiple filters at the same time.
Filtering and searching hosts with the Endpoint Agent component by operating system version on the computer
To filter or search for hosts with the Endpoint Agent component by version of the operating system installed on the computer:
- Select the Assets section in the application web interface window.
- Go to the Endpoint Agents tab.
This opens the table of hosts.
- Click the OS link to open the filter settings window.
- In the drop-down list, select one of the following filtering operators:
- Contain
- Not contain
- In the entry field, specify one or several characters of the operating system version.
- To add a filter condition using a different criterion, click and specify the filter condition.
- If you want to delete the filter condition, click the button to the right of the field.
- Click Apply.
The filter configuration window closes.
The table displays only those hosts that match the filter criteria you have set.
You can use multiple filters at the same time.
Filtering and searching hosts with the Endpoint Agent component by component version
You can filter hosts by version of the application that is used in the role of the Endpoint Agent component.
To filter or search for hosts with the Endpoint Agent component by component version:
- Select the Assets section in the application web interface window.
- Go to the Endpoint Agents tab.
This opens the table of hosts.
- Click the Version link to open the filter settings window.
- In the drop-down list, select one of the following filtering operators:
- Contain
- Not contain
- In the entry field, specify one or more characters of the version of the application that is used as the Endpoint Agent component.
- To add a filter condition using a different criterion, click and specify the filter condition.
- If you want to delete the filter condition, click the button to the right of the field.
- Click Apply.
The filter configuration window closes.
The table displays only those hosts that match the filter criteria you have set.
You can use multiple filters at the same time.
Filtering and searching hosts with the Endpoint Agent component by their activity
To filter or search for hosts with the Endpoint Agent component by their activity:
- Select the Assets section in the application web interface window.
- Go to the Endpoint Agents tab.
This opens the table of hosts.
- Click the Activity link to open the filter configuration window.
Select check boxes next to one or multiple activity indicators:
- Normal activity, if you want to find hosts from which the last data was recently received.
- Warning, if you want to find hosts from which the last data was received a long time ago.
- Critical inactivity, if you want to find hosts from which the last data was received an extremely long time ago.
- Click Apply.
The filter configuration window closes.
The table displays only those hosts that match the filter criteria you have set.
You can use multiple filters at the same time.
Quickly creating a filter for hosts with the Endpoint Agent component
To quickly create a filter for hosts with the Endpoint Agent component:
- Select the Assets section in the application web interface window.
- Go to the Endpoint Agents tab.
This opens the table of hosts.
- Do the following to quickly add filter conditions to the filter being created:
- Position the mouse cursor on the link containing the table column value that you want to add as a filter condition.
- Left-click it.
This opens a list of actions to perform on the value.
- In the list that opens, select one of the following actions:
- Filter by this value, if you want to include this value in the filter condition.
- Exclude from filter, if you want to exclude the value from the filter condition.
- If you want to add several filter conditions to the filter being created, perform the actions to quickly add each filter condition to the filter being created.
The table displays only those hosts that match the filter criteria you have set.
Resetting the filter for hosts with the Endpoint Agent component
To clear the Endpoint Agent host filter for one or more filtering criteria:
- Select the Assets section in the application web interface window.
- Go to the Endpoint Agents tab.
- Click to the right of the header of the table column for which you want to clear the filter conditions.
If you want to clear several filter conditions, perform the necessary actions to clear each filter condition.
The selected filters are cleared.
The table displays only those hosts that match the filter criteria you have set.
Configuring activity indicators of the Endpoint Agent component
Users with the Administrator role can define what durations of inactivity of the application that is used as the Endpoint Agent component are to be considered normal, low, or very low activity, and can configure the activity indicators for the application. Users with the Security auditor role can only view the settings of application activity indicators. Users with the Senior security officer or Security officer role can see activity indicators that you configured for the Endpoint Agent component in the Activity field of the Endpoint Agent host table in the Endpoint Agents section of the application web interface.
To configure activity indicators for the Endpoint Agent component:
- Log in to the application web interface under an Administrator or Senior security officer user account.
- In the window of the application web interface, select the Settings section, Endpoint Agents subsection.
- In the fields under the section name, enter the number of days of inactivity of hosts with the Endpoint Agent component that you want to display as Warning and Critical inactivity.
- Click Apply.
Activity indicators of the Endpoint Agent component are configured.
Removing hosts with the Endpoint Agent component
To remove one or more hosts from the Endpoint Agents table:
- Select the Assets section in the application web interface window.
- Go to the Endpoint Agents tab.
- Select check boxes next to one or more hosts that you want to remove. You can select all hosts by selecting the check box in the row containing the headers of columns.
A control panel appears in the lower part of the window.
- Click Delete.
- This opens the action confirmation window; in that window, click Yes.
The selected hosts are removed from the Endpoint Agents table.
When hosts are removed the following changes are made in the web interface of Kaspersky Anti Targeted Attack Platform:
- You cannot create a task, prevention rule, or network isolation rule for a removed host.
- If a prevention rule was previously created for a host, its name in the rule window (the Prevent on field) is hidden when the host is removed. The rule continues to apply.
If this host reconnects to the Central Node server, the host name is restored in the Prevent on field and the prevention rule is applied to it again.
- If a network isolation rule was previously created for a host, it continues to apply until the time specified in the rule expires.
When this host reconnects to the Central Node, the rule is reapplied to this host.
- The metadata of objects quarantined on the remote host are deleted from Kaspersky Anti Targeted Attack Platform quarantine.
When this host reconnects to the Central Node server, the metadata of objects in Kaspersky Anti Targeted Attack Platform quarantine are not restored. You can avoid quarantine filling up on a host by clearing it on command line or in Kaspersky Security Center. For details, see the Help of the application that you are using in the role of the Endpoint Agent component.
- If an object was quarantined by the Quarantine file task on one host only and that host was removed, the Restore all button in the task window is inactive because the file cannot be restored on a removed host.
Event search by the name of the removed host remains available.
Automatic removal of inactive hosts
You can enable or disable the automatic removal of inactive hosts from the Endpoint Agents table. Inactive hosts are hosts that have not connected to the Central Node server for the configured time.
To enable or disable the automatic removal of hosts from the Endpoint Agents table:
- In the window of the application web interface, select the Settings section, Endpoint Agents subsection.
- Under Remove inactive hosts automatically, do the following:
- If you want to enable this functionality, move the Remove hosts toggle switch to Enabled.
- If you want to enable this functionality, move the Remove hosts toggle switch to Disabled.
- If you have enabled this functionality, in the Delete after field, specify the number of days after which hosts that have not connected to the Central Node component must be considered inactive.
The minimum value is 1 and the maximum value is 365.
Automatic removal of inactive hosts is enabled or disabled.
If the value specified in the Delete after field is less than the values specified in the Warning and/or Critical inactivity fields under Activity indicators, hosts are removed earlier than an inactivity warning is displayed in the Dashboard section.
When hosts are removed the following changes are made in the web interface of Kaspersky Anti Targeted Attack Platform:
- You cannot create a task, prevention rule, or network isolation rule for a removed host.
- If a prevention rule was previously created for a host, its name in the rule window (the Prevent on field) is hidden when the host is removed. The rule continues to apply.
If this host reconnects to the Central Node server, the host name is restored in the Prevent on field and the prevention rule is applied to it again.
- If a network isolation rule was previously created for a host, it continues to apply until the time specified in the rule expires.
When this host reconnects to the Central Node, the rule is reapplied to this host.
- The metadata of objects quarantined on the remote host are deleted from Kaspersky Anti Targeted Attack Platform quarantine.
When this host reconnects to the Central Node server, the metadata of objects in Kaspersky Anti Targeted Attack Platform quarantine are not restored. You can avoid quarantine filling up on a host by clearing it on command line or in Kaspersky Security Center. For details, see the Help of the application that you are using in the role of the Endpoint Agent component.
- If an object was quarantined by the Quarantine file task on one host only and that host was removed, the Restore all button in the task window is inactive because the file cannot be restored on a removed host.
Event search by the name of the removed host remains available.
Supported interpreters and processes
Kaspersky Endpoint Agent application monitors the execution of scripts by the following interpreters:
- cmd.exe
- reg.exe
- regedit.exe
- regedt32.exe
- cscript.exe
- wscript.exe
- mmc.exe
- msiexec.exe
- mshta.exe
- rundll32.exe
- runlegacycplelevated.exe
- control.exe
- explorer.exe
- regsvr32.exe
- wwahost.exe
- powershell.exe
- java.exe and javaw.exe (only if started with the –jar option)
- InstallUtil.exe
- msdt.exe
- python.exe
- ruby.exe
- rubyw.exe
Information about the processes monitored by Kaspersky Endpoint Agent application is presented in the table below.
Processes and the file extensions that they open
Process |
File extensions |
|---|---|
winword.exe |
rtf doc dot docm docx dotx dotm docb |
excel.exe |
xls xlt xlm xlsx xlsm xltx xltm xlsb xla xlam xll xlw |
powerpnt.exe |
ppt pot pps pptx pptm potx potm ppam ppsx ppsm sldx sldm |
acrord32.exe |
|
wordpad.exe |
docx |
chrome.exe |
|
MicrosoftEdge.exe |
Configuring integration with the Sandbox component
You can connect one Sandbox component to multiple Central Node components.
The following procedure is used to configure the Sandbox component connection with the Central Node component:
- Creating a request to connect to the Sandbox component
You can create a request in the application web interface under an administrator account. If you have several Central Node components installed on the server, you need to create a request for each server with the Central Node component that you want to connect to the Sandbox component. If the Central Node component is deployed as a cluster, you can create a request for connection from any server in the cluster.
- Processing a connection request in the Sandbox web interface
You can accept or reject each request.
If you want to connect several Sandbox components to a single Central Node component, make sure that the Sandbox components you connect have the same set of operating systems used for scanning objects, and maximum number of simultaneously running virtual machines.
After configuring the connection, the Sandbox server needs 5 to 10 minutes to get ready for operation. During this time, the System health window of the application web interface display a warning: A problem occurred with the standard configuration. When the server is ready for operation, the warning disappears.
Viewing the table of servers with the Sandbox component
Users with the Security auditor role can view the table of servers with the Sandbox component.
The table of servers with the Sandbox component is located in the Sandbox servers section, on the Servers tab of the application web interface window.
The Certificate fingerprint field displays the fingerprint of the TLS certificate of the Central Node server.
The Server list table contains the following information:
- IP and name—IP address or fully qualified domain name of the server with the Sandbox component.
- Certificate fingerprint—Certificate fingerprint of the server with the Sandbox component.
- Authorization—Status of the request to connect to the Sandbox component.
- Status—Status of the connection to the Sandbox component.
Users with the Security officer role cannot view the table of servers with the Sandbox component.
Page top
Creating a request to connect to the server with the Sandbox component
To create a request to connect to the server with the Sandbox component through the application web interface:
- Select the Sandbox servers section in the window of the application web interface.
- In the upper-right corner of the window, click the Add button.
This opens the Sandbox server connection window.
- In the IP field, specify the IP address of the server with the Sandbox component to which you want to connect.
- Click Get certificate fingerprint.
The workspace displays the fingerprint of the certificate of the server with the Sandbox component.
- Compare the obtained certificate fingerprint with the fingerprint indicated in the Sandbox web interface in the KATA authorization section in the Certificate fingerprint field.
If the certificate fingerprints match, perform the next steps of the instructions.
If certificate fingerprints do not match, confirming the connection is not recommended. Make sure the data you entered is correct.
- In the Name field, specify the Sandbox component name that will be displayed in the web interface of the Central Node component.
This name is not related to the name of the host where the Sandbox is installed.
- If you want to activate a connection with Sandbox immediately after connecting, select the Enable check box.
- Click Add.
The connection request is displayed in the web interface of the Sandbox component.
Page top
Enabling and disabling a connection with the Sandbox component
To make a connection with the Sandbox component active or to disable it:
- Select the Sandbox servers section in the window of the application web interface.
The table of servers with Sandbox components is displayed.
- In the row containing the relevant server in the Status column, perform one of the following actions:
- If you want to activate a connection with the Sandbox component, set the toggle switch to Enabled.
- If you want to disable a connection with the Sandbox component, set the toggle switch to Disabled.
- Click Apply.
The connection with the Sandbox component will become active or will be disabled.
Page top
Deleting a connection with the Sandbox component
To delete a connection with the Sandbox component:
- Select the Sandbox servers section in the window of the application web interface.
This displays the table of computers on which the Sandbox component is installed.
- Select the check box in the line containing the Sandbox component whose connection you want to delete.
- In the upper-right corner of the window, click the Delete button.
- In the confirmation window, click Yes.
The connection with the Sandbox component will be deleted.
Page top
Manually sending files from Endpoint Agent hosts to be scanned by Sandbox
You can enable or disable the manual sending of files from hosts with the Endpoint Agent component to be scanned by the Sandbox component. If this functionality is enabled, users of hosts with the Endpoint Agent component can use Sandbox to scan any file that they consider unsafe.
This functionality is available if the Kaspersky Endpoint Security for Windows and/or Kaspersky Endpoint Security for Linux applications are being used as the Endpoint Agent component and integration with Kaspersky Anti Targeted Attack Platform is configured for these components.
Sending files for scanning involves the following steps:
- Enabling the manual sending of files from hosts with the Endpoint Agent component to be scanned by the Sandbox component in the Kaspersky Anti Targeted Attack Platform web interface.
- Sending files to be scanned by the Sandbox component in Kaspersky Endpoint Security for Windows and Kaspersky Endpoint Security for Linux.
Based on the results of the scan, Kaspersky Anti Targeted Attack Platform may record an alert in the alert database. Details of these alerts are displayed in the Alerts by attack vector widget.
In distributed solution and multitenancy mode, you must enable the manual sending of files to be scanned by the Sandbox component on each Central Node server on which you want to use it. If the Central Node component is deployed as a cluster, you can enable the functionality on any server in the cluster.
If you use only KATA functionality (KATA license key), in the Kaspersky Anti Targeted Attack Platform web interface, the Endpoint Agents section displays a list of hosts from which files have been sent for scanning by the Sandbox component. You can view this list and information about the selected host.
Page top
Enabling and disabling the manual sending of files from Endpoint Agent hosts to be scanned by Sandbox
To enable or disable the manual sending of files to be scanned by the Sandbox component:
- In the window of the application web interface, select the Settings section, Endpoint Agents subsection.
- Under Send files from hosts for analysis to Sandbox manually, do the following:
- Set the Send files toggle switch to Enabled if you want to enable the manual sending of files to be scanned by the Sandbox component.
This functionality is enabled by default.
- Set the Send files toggle switch to Disabled if you want to disable the manual sending of files to be scanned by the Sandbox component.
- Set the Send files toggle switch to Enabled if you want to enable the manual sending of files to be scanned by the Sandbox component.
- Click Apply.
The manual sending of files from Endpoint Agent hosts to be scanned by the Sandbox component is enabled or disabled.
Page top
Configuring integration with external systems
You can configure integration of Kaspersky Anti Targeted Attack Platform with external systems to scan files stored in those systems. Their scan results are displayed in the alert table.
The role of an external system can be served by a mail sensor, such as Kaspersky Secure Mail Gateway or Kaspersky Security for Linux Mail Server. The mail sensor sends email messages to Kaspersky Anti Targeted Attack Platform for processing. Based on the results of processing of email messages in Kaspersky Anti Targeted Attack Platform, the mail sensor may block the transfer of messages.
Integration of Kaspersky Anti Targeted Attack Platform with external systems involves the following procedure:
- Enter the integration settings and create an integration request from the external system.
For more details about entering integration settings for the mail sensor, please refer to the Kaspersky Secure Mail Gateway Help or the Kaspersky Security for Linux Mail Server Help.
To integrate other external systems, use the REST API.
- Confirm integration for Kaspersky Anti Targeted Attack Platform
External systems must use unique certificates for authorization on the server with the Central Node component. If this is the case, a single integration request will be displayed in the interface of Kaspersky Anti Targeted Attack Platform. To connect multiple external systems that have the same IP address, you must use a unique certificate for each external system.
When using one certificate, you can configure integration with only one external system.
- Check the connection between the external system and Kaspersky Anti Targeted Attack Platform
Viewing the table of external systems
The table of external systems is in the External systems section of the application web interface window. The table contains the following information:
- Sensor—IP address or domain name of the external system server.
- Type—Type of external system (mail sensor or other system).
- Name—Name of the integrated external system that is not a mail sensor.
A dash is displayed in this column for a mail sensor.
- ID—ID of the external system.
- Certificate fingerprint—Fingerprint of the TLS certificate of the server with the external system used to establish an encrypted connection with the server hosting the Central Node component.
The certificate fingerprint of the server with the Central Node component is displayed in the upper part of the window in the Certificate fingerprint field.
- State—State of the integration request.
Processing a request from an external system
To process an integration request from an external system:
- Select the External systems section in the window of the application web interface.
The Server list table displays the already connected external systems, and requests for integration with Kaspersky Anti Targeted Attack Platform from external systems.
- In the line containing the integration request, perform one of the following actions:
- If you want to configure integration with the external system, click the Accept button.
- If you do not want to configure integration with the external system, click the Reject button.
- In the confirmation window, click Yes.
The integration request from the external system will be processed.
Page top
Removing an external system from the list of those allowed to integrate
After you have accepted an integration request from an external system, you can remove it from the list of those allowed to integrate. If this is the case, the connection between Kaspersky Anti Targeted Attack Platform and the external system will be terminated.
To remove an external system from the list of systems allowed to integrate:
- Select the External systems section in the window of the application web interface.
The Server list displays the already added external systems and the requests to integrate with Kaspersky Anti Targeted Attack Platform from external systems.
- Click the Delete button in the line containing the integration request from the external system that you want to remove.
- In the confirmation window, click Yes.
The external system will be removed from the list of those allowed to integrate.
Page top
Configuring the priority for processing traffic from mail sensors
You can enable or disable the maximum priority for processing traffic from mail sensors.
To enable or disable the maximum priority for processing traffic from mail sensors:
- Select the External systems section in the window of the application web interface.
- Do one of the following:
- Turn on the toggle switch next to the name of the Maximum scan priority parameter if you want to enable the maximum priority for processing traffic from mail sensors.
- Turn off the toggle switch next to the name of the Maximum scan priority parameter if you want to disable the maximum priority for processing traffic from mail sensors.
The priority for processing traffic from mail sensors will be configured.
Page top
Configuring integration with Kaspersky Managed Detection and Response
Kaspersky Managed Detection and Response (hereinafter also "MDR") detects and prevents fraud in the client's infrastructure. MDR provides continuous managed protection and allows organizations to automatically discover hard-to-detect threats while freeing up IT security personnel to work on issues requiring their participation.
Kaspersky Anti Targeted Attack Platform obtains data and sends it to Kaspersky Managed Detection and Response using a Kaspersky Security Network stream. Therefore, participation in KSN is necessary for configuring integration with MDR.
Integration with MDR is only available if at least one KATA or EDR license is active. If only one license key (only KATA or only EDR) is added in the application statistics is limited to the functionality provided by that license. If both license keys are added in the application, complete statistics is sent.
Before configuring the integration of Kaspersky Anti Targeted Attack Platform with the MDR application, you must download an archive with the configuration file from the MDR portal.
Enabling the MDR integration
Make sure that an active license key is added and participation in KSN is configured in the application. Otherwise the MDR integration is unavailable.
To enable integration with MDR:
- Log in to the application web interface with the administrator account.
- Select the Settings section, KSN/KPSN and MDR subsection.
- Under MDR integration, click Upload to upload the configuration file.
This opens the file selection window.
- Select the archive you downloaded during registration at the MDR portal and click Open.
The following information about the MDR license is displayed in the window:
- Serial number.
- Expiration date.
- Days remaining.
Integration with MDR is enabled. Integration settings configured in the configuration file are applied to all connected Sensor components. MDR starts using alert statistics sent via the KSN stream.
Page top
Disabling the MDR integration
To disable integration with MDR:
- Log in to the application web interface with the administrator account.
- Select the Settings section, KSN/KPSN and MDR subsection.
- Under MDR integration, click Delete file.
- In the confirmation window, click Yes.
The configuration file is deleted and the MDR integration is disabled. Statistics is still sent to KSN servers, but this information is not used by MDR.
Page top
Replacing the MDR configuration file
To replace the MDR configuration file:
- Log in to the application web interface with the administrator account.
- Select the Settings section, KSN/KPSN and MDR subsection.
- Under MDR integration, click Replace file.
This opens the file selection window.
- Select a new archive containing a configuration file and click Open.
MDR license information is updated in the application web interface.
The configuration file is replaced. New integration settings are applied to all connected Sensor components.
Page top
Configuring integration with an SIEM system
Kaspersky Anti Targeted Attack Platform can publish information about user actions in the application web interface as well as alerts to your organization's using the
protocol.You can use
for data transmission.If you have deployed the Central Node and Sensor components as a cluster, you can configure high availability integration with an external system using one of the following options:
- Using the Round Robin function.
- Configure the settings of the external system so that the external system switches between the IP addresses of the cluster servers if a network error occurs.
To configure high availability integration with an external system using the Round Robin function:
- Configure Round Robin on the DNS server for the domain name corresponding to the Central Node cluster.
- Specify this domain name in the mail server settings.
Integration with the external system is configured based on the domain name. The external system will communicate with a random server in the cluster. If this server fails, the external system will communicate with another healthy server in the cluster.
Enabling and disabling information logging to a remote log
You can configure the logging of information about user actions in the web interface and alerts to a remote log. The log file is stored on the server on which the SIEM system is installed. To write to the remote log, you must configure the integration with the SIEM system.
To enable or disable the logging of information about user actions in the web interface and alerts to the remote log:
- In the window of the application web interface, select the Settings section, SIEM system subsection.
- If you want to enable / disable the recording of information about user actions in the web interface to the remote log, do one of the following:
- If you want to enable recording of information about user actions in the web interface, select the User activity check box.
- If you want to disable the recording of information about user actions in the web interface, clear the User activity check box.
- If you want to enable / disable the recording of information about alerts to the remote log, do one of the following:
- If you want to enable recording of alert information, select the Detections check box.
- If you want to disable recording of alert information, clear the Detections check box.
You can select both check boxes simultaneously.
- Click Apply in the lower part of the window.
Information logging in the remote log is enabled or disabled.
Users with the Security auditor role can only view information about remote logging settings.
Page top
Configuring the main settings for SIEM system integration
To configure the main settings for SIEM system integration:
- In the window of the application web interface, select the Settings section, SIEM system subsection.
- Select the User activity and/or Detections check boxes.
You can select one check box or both check boxes.
- In the Host/IP field, enter the IP address or host name of the server of your SIEM system.
- In the Port field, enter the port number used for connecting to your SIEM system.
- In the Protocol field, select TCP or UDP.
- In the Host ID field, enter the host ID. The host with that ID is specified as the alert source in the log of the SIEM system.
- In the Heartbeat field, enter the interval for sending messages to the SIEM system.
- Click Apply in the lower part of the window.
The main settings of integration with the SIEM system will be configured.
Users with the Security auditor role can only view information about the SIEM system integration settings.
Page top
Uploading a TLS certificate
To upload a TLS certificate for encrypting the connection with the SIEM system:
- In the window of the application web interface, select the Settings section, SIEM system subsection.
- In the TLS encryption section, click the Upload button.
This opens the file selection window.
- Select a TLS certificate file to download and click the Open button.
This closes the file selection window.
The TLS certificate is added to the application.
- Click Apply in the lower part of the window.
The uploaded TLS certificate will be used to encrypt the connection with the SIEM system.
Page top
Enabling and disabling TLS encryption of the connection with the SIEM system
To enable or disable TLS encryption of the connection with the SIEM system:
- In the window of the application web interface, select the Settings section, SIEM system subsection.
- Select the User activity and/or Alerts check boxes.
You can select one check box or both check boxes.
- In the TLS encryption section, perform one of the following actions:
- Turn on the toggle switch next to the name of the TLS encryption parameter if you want to enable TLS encryption of the connection with the SIEM system.
- Turn off the toggle switch next to the name of the TLS encryption parameter if you want to disable TLS encryption of the connection with the SIEM system.
The toggle switch next to the name of the TLS encryption setting can be used only if a TLS certificate is loaded.
- Click Apply in the lower part of the window.
TLS encryption of the connection with the SIEM system will be enabled or disabled.
Page top
Content and properties of syslog messages about alerts
Information about each alert is transmitted in a separate syslog category (syslog facility) that is not used by the system to deliver messages from other sources. Information about each alert is transmitted as a separate syslog message in CEF format. If the alert was generated by the Targeted Attack Analyzer module, information about that alert is transmitted as multiple separate syslog messages in CEF format.
The default maximum size of a syslog message about an alert is 32 KB. Messages that exceed the maximum size are truncated at the end.
The header of each syslog message about an alert contains the following information:
- Format version.
Current version number:
0. Current field value:CEF:0. - Vendor.
Current field value:
AO Kaspersky Lab. - Application name.
Current field value:
Kaspersky Anti Targeted Attack Platform. - Application version
Current field value: 7.0.1-500.
- Alert type.
See the table below.
- Event name.
See the table below.
- Alert importance.
Allowed field values:
Low,Medium,Highor0(forheartbeatmessages). - Additional information.
Example:
CEF:0|AO Kaspersky Lab| Kaspersky Anti Targeted Attack Platform |6.0.0-200|url_web| URL from web detected|Low|
The body of a syslog message about an alert matches the information about the alert that is displayed in the application web interface. All fields are presented in the "<key>=<value>" format. Depending on whether the alert occurred in network traffic or mail traffic, and depending on the technology that generated the alert, various keys may be transmitted in the body of a syslog message. If the value is empty, the key is not transmitted.
The keys, as well as their values contained in a message, are presented in the table below.
Information about an alert in syslog messages
Alert type |
Alert name and description |
Key and description of its value |
|---|---|---|
|
A file was detected in network traffic. |
|
|
A file was detected in mail traffic. |
|
|
An alert was generated by the Intrusion Detection System module. |
|
|
An alert was generated by URL Reputation technology or Sandbox in network traffic. |
|
|
An alert was generated by URL Reputation technology or Sandbox in mail traffic. |
|
|
An alert was generated by URL Reputation technology in DNS traffic. |
|
|
The alert was generated by the Endpoint Agent component on the user's computer and contains a file. |
|
|
The alert was generated while carrying out an IOC scan of hosts with the Endpoint Agent component for Windows. This type of alert is available if you are using KEDR functionality. |
|
|
Alert resulting from the IOA analysis of events. This type of alert is available if you are using KEDR functionality. |
|
|
The alert was generated while carrying out a YARA scan of hosts with the Endpoint Agent component for Windows. This type of alert is available if you are using KEDR functionality. |
|
|
Periodic message containing the state of components. |
|
Renewing the certificate for connecting to the Central Node using the API
To renew the certificate for connecting to the Central Node server using the Kaspersky Anti Targeted Attack Platform API, you need to replace the certificate used by the REST API server. You can specify the new certificate of the REST API server in the Settings section, Connection servers subsection, on the REST API server tab.
Page top
Managing connectors
This section contains information about managing connectors in Kaspersky Anti Targeted Attack Platform. Connectors are special software modules that handle communication with Kaspersky Anti Targeted Attack Platform and can allow to perform management tasks in the application itself or with the help of the application.
Connectors extend the functionality of the application letting it interact with third-party systems. Depending on their functional purpose, connectors can send data to third-party systems (for example, events, application messages, and audit records to a SIEM system) or fetch data from third-party systems. The application can also use connectors for active polling of devices.
Computers on which the connector software modules are running are called connector deployment nodes. You can deploy the connector on any computer that has network access to the Central Node server (including nodes with installed application components, including the Central Node server itself).
The table of connectors and the table of connector types are displayed in the Settings section, Connectors subsection in the application web interface. Only users with the Administrator role can manage connectors and connector types. Users with the Security auditor, Security officer, and Senior security officer roles can view connectors and connector types.
The functionality of the connector depends on the selected connector type. You can select a connector type when adding the connector to the application. The following types of connectors are built into the application out of the box:
- Syslog
This connector type enables data forwarding to a Syslog server.
When adding a Syslog connector or editing its settings, configure both the general settings of the connector, and the additional settings under Details:
- Syslog server address
- Syslog server port
- Data Transfer Systems
- SIEM
This connector type enables data forwarding to a SIEM system.
When adding a SIEM connector or editing its settings, configure both the general settings of the connector, and the additional settings under Details:
- SIEM system server address
- SIEM system server port
- Data Transfer Systems
- Generic
This connector type allows connecting applications that use the Kaspersky Anti Targeted Attack Platform API NDR.
- Email
This connector type provides the capabilities for forwarding data by email.
When adding an Email connector or editing its settings, configure both the general settings of the connector, and the additional settings under Details:
- Address to be used as the sender of email messages.
- Recipient addresses of email messages.
- Email subject lines for events, application messages, and audit records.
- Text description templates for events, application messages, audit records, descriptions of network interactions, and the whole notification email message. You can use variables in templates.
- The subject and body of the email message sent when the maximum number of sent notifications is reached.
- Maximum number of email messages sent per day.
- Maximum number of notifications in each message. Specifies the maximum number of registered notifications of the same type (events, application messages, or audit records) that can be put in a single email message. If there more registered notifications exist, an additional email message is generated (within the daily limit).
For the Email connector to work, you must first configure the mail server connection.
- Active poll
This connector type provides the capabilities for active device polling with configuration control and active polling jobs.
When adding an Active poll connector or editing its settings, configure both the general settings of the connector, and the additional settings under Details:
- Active polling methods that will be available to the application user when using the connector.
- The ranges of allowed and denied IP addresses of the devices for which active polls are allowed or denied. The
0.0.0.0address matches all possible IP addresses.If an address is included among allowed as well as denied IP addresses, Kaspersky Anti Targeted Attack Platform classifies it as a denied IP address.
- Names of address spaces whose corresponding devices will be available for active polling. If necessary, select the address spaces for IP addresses in the L3 address space field and select the address spaces for MAC addresses in the L2 address space field.
If you select an address space that differs from the Default one, add a new rule for this address space (or edit an existing rule). The rule must specify the connector for which this address space is selected. The rules settings are configured when the address space is changed.
- KUMA
This connector type provides integration with Kaspersky Unified Monitoring and Analysis Platform (KUMA). Software modules for connectors of this type are distributed separately from Kaspersky Anti Targeted Attack Platform. A connector of this type lets you send information about devices and risks to KUMA, as well as run commands in KUMA to change device statuses. After adding a connector, you must configure the integration in KUMA (create a connection to Kaspersky Anti Targeted Attack Platform). The KUMA connector interacts with the Central Node server using the Kaspersky Anti Targeted Attack Platform API.
The integration provided by the KUMA connector involves sending information about devices and risks, and applying commands to change device statuses. To send events to KUMA, you can add a Syslog or SIEM connector to Kaspersky Anti Targeted Attack Platform and specify the settings for connection to the KUMA server for this connector. After adding the connector, you need to configure a collector on the KUMA side.
- Cisco Switch
This connector type provides support for automatic network access control for devices via Cisco network switches.
When adding a Cisco Switch connector or editing its settings, configure both the general settings of the connector, and the additional settings under Details:
- Name of the switch that you want to be specified in events for actions that the application performed using the connector.
- Addressing information for connecting the connector to the switch: IP address and SSH port.
- Credentials for connecting to the switch via SSH.
- Public key to be matched against the public key received from network switch before establishing an SSH connection; this is done to protect against spoofing of this device in the network. If the value is empty, the check is not performed.
- Method used to restrict network access for devices. The application provides methods for creating deny rules in switch access control lists based on MAC addresses (MAC ACL), IP addresses (IP ACL), and by disabling Ethernet ports to which devices are connected.
To use the method of disabling Ethernet ports, configure the switch connections to prevent multiple devices from being connected to one port. Otherwise, disabling an Ethernet port to block one device will also block network access for all devices that connect to the network using that port.
- This setting resets deny rules when changing the network access restriction method. If this setting is enabled, changing the method resets the rules that have been set for blocking devices.
- This setting excludes network devices from the network access restriction method. If this setting is enabled, the method is not applied to devices of the Network device, Firewall, Switch, Virtual switch, Router, Virtual router, Wi-Fi.
- This setting applies deny rules only to new devices. If this setting is enabled, the method is applied only to those unauthorized devices for which a new device detection event with event type code 4000005003 has been registered.
- Polling interval for Authorized and Unauthorized devices in the device table.
- This setting lets you configure notifications about blocked devices when the connector is restarted. If this setting is enabled, after enabling or restarting the connector, a list of devices for which network access restrictions have been previously applied is sent to the Central Node server.
If necessary, you can add other connector types that will facilitate data exchange or provide the capabilities for performing management tasks when the application interacts with other recipient systems.
Certain ports and protocols are used for the connections of connectors to the Central Node server.
Third-party systems are connected through the connector on behalf one of the application users. We recommend using a separate user account for each connector. This will help you analyze actions performed through the connectors using audit records.
The maximum number of connectors in the application is 20. The maximum number of connector types is 100.
Managed and unmanaged connectors
The application can use managed and unmanaged connectors.
A connector is managed if its software modules can automatically register and start after the connector is added, and these modules can be managed when the connector is enabled or disabled, or when it is deleted. Only nodes that have application components installed can serve as deployment nodes for managed connectors.
An unmanaged connector does not provide the functionality of a managed connector. You must register such a connector, start, stop, or delete its software modules manually on the node where the connector is deployed. When you enable or disable an unmanaged connector, the application reflects this by allowing or denying the interaction with the connector on the side of the Central Node server.
Connections between connectors and the Central Node server are secured using certificates. Connector certificates are generated when the connectors are added to the application. For software modules of managed connectors, the application automatically sends the generated certificates. When adding an unmanaged connector (or when adding a managed connector in the ignore managed connector mode), you must manually upload the certificate for software modules of the connector using a communication data package. If you need to replace a certificate (issue a new one) for such a connector, you need to create a new communication data package and use it to upload the new certificate. The only way of replacing certificates of managed connectors is by deleting and re-adding the connectors.
Page top
Sending events, application messages, and audit records to third-party systems
You can configure the forwarding of events, application messages or audit records (hereinafter also "registered notifications") to a third-party system through connectors. For the connector types named Syslog, SIEM, and Email, the ability to send registered notifications is enabled by default. For the KUMA connector type, the capability to forward registered notifications is available if application modules are installed. When using other connector types that were added to the application, whether this capability is available depends on the settings of these specific connector types.
Registered notifications are configured for each connector individually. When configuring event types, you can select which types of events you want to be forwarded through the connectors. When creating a connector or editing its settings, you can enable or disable the forwarding of all application messages and all audit records through this connector.
Connectors of the Email type allow limiting the amount of transmitted data. For this connector type, you can set the maximum number of email messages about new registered notifications and the maximum number of registered notifications in each message. If the maximum number of email messages already has been sent, another message is sent to recipients to notify them about the limit being exceeded. After that, no new messages are sent until the end of the current day in the time zone of the Central Node server.
Email messages sent through an Email connector are generated separately for each type of registered notifications. That is, different email messages are generated for events, application messages, and audit records.
The contents and order of information about registered notifications that are forwarded through connectors of the Syslog and SIEM types may differ in these systems from the contents and order of information displayed in the Kaspersky Anti Targeted Attack Platform web interface.
Page top
Automatic network access control for devices via Cisco Switch connectors
You can configure automatic network access control for devices via Cisco Switch connectors. Connectors of this type interface with switches to send commands that add or remove network access deny rules (restrictions) for the devices connected to the switches.
Network access control for devices is driven by their status. The connector creates deny rules on the switch for devices with the Unauthorized status and removes the rules once the Authorized status is assigned to the devices.
Each connector can only interface with one network switch.
A Cisco Switch connector is used for restricting network access only for those devices whose details include their MAC addresses. Also, these MAC addresses must be stored in the ARP table of the network switch. That is, devices with these MAC addresses must be connected to the network switch to which the connector is connected.
A connector can use various methods to restrict network access for devices. The application provides methods for creating deny rules in switch access control lists based on MAC addresses (MAC ACL), IP addresses (IP ACL), and by disabling Ethernet ports to which devices are connected.
To use the method of disabling Ethernet ports, configure the switch connections to prevent multiple devices from being connected to one port. Otherwise, disabling an Ethernet port to block one device will also block network access for all devices that connect to the network using that port.
To minimize the risk of the connector impacting network accessibility of devices, you can enable the following settings during configuration:
- This setting excludes network devices from the network access restriction method. If this setting is enabled, the method is not applied to devices of the Network device, Firewall, Switch, Virtual switch, Router, Virtual router, Wi-Fi.
- This setting applies deny rules only to new devices. If this setting is enabled, the method is applied only to those unauthorized devices for which a new device detection event with event type code 4000005003 has been registered.
The connector interfaces with the network switch via SSH. SSH connection credentials are specified and stored within the connector configuration. To protect these sensitive credentials, which are essential for identification and authentication, the connector verifies the switch public key it receives against a stored value as a safeguard against switch spoofing. Identification and authentication details are sent to the switch after verifying that the received public key matches the public key saved in the connector.
The connector logs events within the application based on the outcomes of its actions. These event types are logged via External technology. The following event headers are generated:
Reset device deny rules for <switch name>This type of event is logged when the connector resets previously defined deny rules for devices due to a change of network access restriction method.
Updated information about <device name> with address <device MAC address> according to data from <switch name>This type of event indicates that the connector has received information from a switch that a device connected to a certain port.
Added a device deny rule for <device name> on <switch name>This type of event is logged when the connector restricts network access for an unauthorized device.
Removed deny rule for <device name> on <switch name>This type of event is logged when the connector has successfully removed network access restrictions for a specific device.
<switch name> has previously added deny rulesThis type of event indicates that upon turning on or restarting, the connector discovered preexisting deny rules on a specific switch.
SSH connection made to <switch name> without verifying public keyThis type of event is logged when the connector successfully establishes an SSH connection to a switch but fails to verify its public key. We recommend verifying that there is no spoofed device on the network, and then saving the new public key in the connector settings.
Detected public key mismatch for <switch name>This type of event is logged when the connector detects a mismatch between the stored and received public keys for a switch. This prevents an SSH connection with the switch. We recommend verifying that there is no spoofed device on the network and that the switch public key has indeed changed, and then saving the new public key in the connector settings.
Failure to establish SSH connection with switch <switch name>: incorrect credentialsThis event is logged when the connector failed to establish SSH connection with the switch due to incorrect credentials specified in the connector settings (user name or password).
Action for the privileged mode has not been performed on the switch <switch name>: incorrect passwordThis event is logged when the connector does not have privileged mode capabilities to add and remove device deny rules on the switch. In this case, enter the correct privileged mode password in the connector settings.
Adding a connector
You can add a connector based on one of the connector types available in the application. An unmanaged connector should only be created based on custom connector types.
Before adding a connector, we recommend creating a separate user account that the third-party system will use to connect to the application. For the Email connector to work, you must first configure the mail server connection.
To add a connector:
- Log in to the web interface with the application administrator account.
- Select the Settings section, Connectors subsection.
- On the Connectors tab, open the details area by clicking Add connector.
- Configure the connector general settings:
- Select a connector type and enter a name for the connector.
- If you want to add an unmanaged connector (or a connector in ignore managed connector mode), enter the password of the connector certificate.
The specified password is used to encrypt the certificate in the communication data package of the connector.
- Specify the address of the Control Node server.
The connector will use the specified address to connect to the Control Node.
- Specify the node where you want to deploy the connector:
- If you want to add a managed connector, you can specify one of the nodes with installed application components as the connector deployment node.
- If you want to add an unmanaged connector, you must enter the IP address of the computer on which you want the software modules of the connector to run.
- Select the user that the third-party system will use to connect to the application through the connector. You must specify the name of one of the application users.
- Under Details, specify the advanced settings depending on the type of connector. The Details group of settings is not shown in the details area if the connector type does not allow managing advanced settings.
- If the type of the connector allows forwarding audit records and application messages, enable or disable the forwarding of this data using the corresponding check boxes.
- If necessary, enter a description for the connector.
- Click Save.
The new connector is added to the table of connectors.
If you added an unmanaged connector, Central Node generates a communication data package for the new connector, after which your browser saves the downloaded file. Depending on your browser settings, your screen may show a window in which you can change the path and name of the saved file. You will need to upload the contents of the new communication data package to the application that will use the connector.
Viewing the table of connectors
The table of connectors is displayed in the Settings section, Connectors subsection, on the Connectors tab.
Connector settings are displayed in the following columns of the table:
- Name.
The name specified for the connector.
- Connector ID.
ID assigned to the connector when it was created.
- Enabled.
Indicates whether the Central Node is ready to interact with the software modules of the connector. If this setting has a value of No, the Central Node server does not accept requests from application modules of the connector.
- Status.
Status of software modules of the connector. The following statuses are possible:
- Awaiting registration: after adding an unmanaged connector or creating a new communication data package for the unmanaged connector, no connection has been established through this connector.
- Switchover: the status of application modules of the connector is switched from Off to On, or vice versa.
- Off means that the Central Node server is not accepting requests from application modules of the connector. If the connector is managed, a stop command is sent to its application modules.
- On means a connection was successfully established through this connector using the certificate created for this connector.
- Error means an error occurred when attempting to perform actions with the application modules of the connector.
- Type.
Icon and name of the connector type.
- Last connection.
Date and time of the last connection through the connector.
- Manageable.
Indicates that the connector is managed. If this is set to No, the connector is either unmanaged, or is configured to ignore the managed connector functionality.
- Changed.
Date and time of the last modification of connector settings.
- Description.
The description specified for the connector.
When viewing the table of connectors, you can use the configuration, filtering, searching, and sorting functionality.
Page top
Enabling or disabling a connector
If you want to temporarily prevent software modules of a connector from connecting to the Central Node server, you can disable the connector. If you want to restore the connection, enable the connector.
To enable or disable a connector:
- Log in to the web interface with the application administrator account.
- Select the Settings section, Connectors subsection.
- On the Connectors tab, select the connector that you want to enable or disable.
The details area is displayed in the right part of the web interface window.
- Click Enable or Disable as necessary.
This opens a confirmation prompt window.
- In the prompt window, click OK.
Editing connector settings
To edit connector settings:
- Log in to the web interface with the application administrator account.
- Select the Settings section, Connectors subsection.
- On the Connectors tab, select the relevant connector.
The details area appears in the right part of the web interface window.
- Click Edit.
- Edit the settings in the same way as you would when adding a connector.
Not all settings are editable. For example, you cannot change the type of the connector.
- Click Save.
The changes are displayed in the corresponding columns of the table of connectors. If you changed the name of the connector, the new name is displayed in the column heading in the table of event types.
Editing some settings of an unmanaged connector causes the Central Node server to generate a new communication data package for the connector (for example, if you change the server address for a Syslog connector in ignore managed connector mode). Depending on your browser settings, a window may be displayed in which you can change the path and name of the communication data package that you are saving. Upload the contents of the new communication data package to the application that is using the connector. Otherwise, a new connection through the connector will be impossible for this application.
Creating a new communication data package for a connector
When an unmanaged connector is added, a communication data package is automatically created for that connector. If necessary, you can create a new communication data package for the connector (for example, if the certificate from the old communication data package has been compromised).
After creating a new communication data package, the certificate from the old communication data package becomes invalid. Therefore, for the next connection of a third-party system through this connector, you must use the new communication data package.
To create a new communication data package for an unmanaged connector:
- Log in to the web interface with the application administrator account.
- Select the Settings section, Connectors subsection.
- On the Connectors tab, select the unmanageable connector for which you want to create a new communication data package.
The details area appears in the right part of the web interface window.
- Click Get new communication data package.
This opens the Generating a new communication data package window.
- Specify the settings for creating the communication data package:
- The name of the user that the third-party system will use to connect to the application through the connector. You must specify the name of one of the application users.
We recommended specifying a user name that was specified when adding the connector. If you need to specify a different user name, we recommended selecting an application user that is not used by other connectors and is not used for connecting to the Central Node through the web interface.
- Address of the node on which the software modules of the connector are running.
- Password of the connector certificate. The specified password is used to encrypt the certificate in the communication data package of the connector.
- The name of the user that the third-party system will use to connect to the application through the connector. You must specify the name of one of the application users.
- Click Create communication data package.
The server generates a new communication data package for the selected connector, after which your browser saves the downloaded file. Depending on your browser settings, your screen may show a window in which you can change the path and name of the saved file. Upload the contents of the downloaded communication data package to the application that is using the connector. Otherwise, a new connection through the connector will be impossible for this application.
Page top
Deleting a connector
When a managed connector is deleted, its software modules are automatically stopped and removed on the node where the connector is deployed.
If you are deleting an unmanaged connector or a connector in ignore managed connector mode, you must manually stop and remove the connector's software modules before deleting the connector.
To delete a connector:
- Log in to the web interface with the application administrator account.
- Select the Settings section, Connectors subsection.
- On the Connectors tab, select the connector that you want to delete.
The details area is displayed in the right part of the web interface window.
- Click Delete.
This opens a confirmation prompt window.
- In the prompt window, confirm the deletion of the selected connector.
Adding and deleting connector types
Connector types define which capabilities are available for connectors and which functionality is implemented within these capabilities. You can use both connector types built into the application, the vendor of which is Kaspersky, or additional types of connectors from any other vendors.
To add a connector type to the application, you must get the following files from the vendor:
- Files for installing software modules of connectors
- Connector type description file
If the connector type from a third-party vendor allows you to store user credentials for accessing the third-party system in the connectors, we recommend taking steps to protect such credentials from being compromised. To minimize risks in the event of compromised credentials, we recommend granting the minimum necessary rights to such accounts (sufficient only for establishing a connection through the connector).
The table of connector types is displayed in the Settings section, Connectors subsection, on the Connector types tab.
Viewing the table of connector types
The table of connector types is displayed in the Settings section, Connectors subsection, on the Connector types tab.
Connector settings are displayed in the following columns of the table:
- Name.
Name of the connector type specified by the vendor.
- Vendor.
Name of the vendor of the connector type.
- Version.
Version number of the connector type.
- Code.
Unique number of the connector type.
- Capabilities.
List of capabilities that connectors of this type must have.
When viewing the table of connector types, you can use the configuration, filtering, searching, and sorting functionality.
Page top
Adding a connector type
You can add a connector type to the application using the description file provided by the vendor of the connector type. The connector type description file must be packed into a ZIP archive.
You must manually install software modules of connectors for the connector type that you are adding, using files provided by the vendor of the connector type. Install the software modules on the computers that you want to specify as connector deployment nodes when adding connectors.
To add a connector type:
- Log in to the web interface with the application administrator account.
- Select the Settings section, Connectors subsection.
- On the Connector types tab, open the details area by clicking Add connector type.
- Click Browse to select the connector type description file.
- Click Save.
The new connector type is added to the table of connectors.
Page top
Removing a connector type
When you delete a connector type, the application deletes information about that connector type, as well as all connectors that have been added using this type.
To delete a connector type:
- Log in to the web interface with the application administrator account.
- Select the Settings section, Connectors subsection.
- On the Connector types tab, select the connector type that you want to delete.
The details area is displayed in the right part of the web interface window.
- Click Delete.
This opens a confirmation prompt window.
- In the prompt window, confirm the deletion of the selected connector type.
- If the application has connectors of this type, confirm the deletion of these connectors as well.
Managing account credentials secrets for remote connections
Kaspersky Anti Targeted Attack Platform implements a secret storage. Secrets allow securely storing and using identification and authentication information that the application needs for automatic remote connections to devices. Secrets are used in active polling jobs.
The application supports various types of secrets. Depending on the purpose of the secret, you can select a relevant type and enter the appropriate data when adding or editing the secret settings.
Keep in secret the credentials required for remote connections to devices using remote connection protocols. Active polling jobs can use various protocols for remote connections, depending on the selected polling methods.
To ensure that identification and authentication details stored in secrets are used securely, the application implements protection against compromise of secrets when connecting to remote devices. After public keys received from devices are saved in the application, it monitors all subsequent remote connections to these devices and does not send information from secrets if devices on the network are spoofed.
Critical information of the secret (password or private key of the certificate) is accessible to you in plain text only once, when you enter this information while creating the secret. After a secret is saved, its critical information can no longer be viewed. You can only replace the critical information of a secret with new critical information while editing the secret (for example, you can enter a different password).
You can manage secrets in the Settings section, Secrets subsection. No more than 500 secrets can be added to the application.
Only users with the Administrator role can manage secrets.
Adding a secret
You can add secrets to the application secrets storage.
To add a secret:
- Log in to the web interface with the application administrator account.
- Select the Settings section, Secrets subsection.
- Click Add secret.
This opens the details area.
- Enter a name for the secret.
The secret name must be unique (must not match the names of other secrets) and must contain up to 256 characters. You can use letters, numerals, spaces, and the following special characters:
! @ # № $ % ^ & ( ) [ ] { } / \ : ; , . - _. The name of the secret must begin and end with any valid character other than a space. - Select the type of secret and configure its settings.
You can select the following types of secrets:
- Password only: this type of secret is used if only the password of a user with the relevant permissions is required for the access to device configuration data.
- User name and password: this type of secret is used if a user name and password are required to receive data from the device.
- User name and password, root password: this type of secret is used if a user name and password are required to receive data from the device, and the root password or the password for an account that processes requests with administrator privileges is additionally required for a connection with administrator (root) privileges.
- User name and password, encryption password: this type of secret is used if a user name and password are required to receive data from the device, and an encryption password is additionally required to establish encrypted connections.
- The Mixed secret type is used for the Remote connection method of device polling. You can specify the following settings for this type of secret:
- User name to be used for remote connections to devices.
The user name can contain Latin letters, numerals, periods, as well as special characters:
_and-. The name must begin with a letter and end with any supported character other than a period. - User password: if the user password will be used for authentication.
The password may contain up to 256 ASCII characters.
- Private key: if the private key of the certificate will be used for authentication.
You can manually enter the sequence of characters comprising the key or upload the key from the certificate file by clicking Copy from file. You can upload private keys in CRT, PEM, and CER formats. If the private key file is protected by a passphrase, enter the passphrase in the Passphrase field before uploading the key.
To use the private key of the certificate, you need to copy the public key of this certificate to all devices to which remote connections will be made using the secret. The steps for copying the public key to devices are performed without the involvement of Kaspersky Anti Targeted Attack Platform.
- Root user password: if an additional password is required for connections to network equipment with administrator (root) privileges. In such cases, access is requested as root or as the user that is configured on network equipment for processing requests with administrator privileges.
- User name to be used for remote connections to devices.
- Click Save.
Viewing table of secrets
The table of remote connection secrets is displayed in the Settings → Secrets section of the application web interface.
Information about secrets is displayed in the following columns of the table:
- Name of secret.
The name that the application uses for the secret.
- Created.
Date and time when the secret was added to the application.
- Changed.
Date and time of the last modification of the secret in the application.
When viewing the table of secrets, you can use the configuration, filtering, searching, and sorting functionality.
Page top
Protecting against compromise of secrets when connected to remote devices
Identification and authentication details from secrets should be used only for remote connections to devices that are selected for active polling jobs. To protect this information against possible compromise in cases of device spoofing, the application verifies the public key received from the device before sending the information. The device uses the public key to establish SSH connections. A public key helps the application to verify that the SSH connection is being established with the correct device. Identification and authentication details are sent to the device after verifying that the received public key matches the public key saved in the application.
The saved public key of the device is displayed in the details area of the selected device on the General tab.
Receiving and saving public keys of devices in the application
By default, no public keys of devices are configured in Kaspersky Anti Targeted Attack Platform. A device's public key is received and saved when an SSH connection is established with this device for the first time for the purpose of scanning as part of an active polling job that uses a connector of the Active poll type. Identification and authentication details from the selected secret are sent to the device without checking the received public key. Therefore, before starting the active polling job for the first time for the selected device and establishing an SSH connection to it, make sure that there is no spoofed device on the network. To do this, you can run ifconfig to check that the IP addresses of the device configured in the application match the IP addresses on the network interfaces of the actual device.
Resetting saved device public keys
SSH connection keys on devices may change with time. Device users may generate new keys when their current private keys are at a risk of compromise.
When the private key is changed on the device, the public key is changed as well. After changing the public key, the application stops sending information from the secrets to this device because the new public key no longer matches the one saved in the application. Therefore, any subsequent device scans as part of active polling jobs finish with an error.
After changing the public key on the device, you must reset the currently saved public key for this device stored in the application. This will allow the secrets to be used again when connecting to the device remotely.
After resetting the saved public key, the application saves the newly received public key the next time an SSH connection is established with this device. Check that there is no spoofed device on the network, similarly to when initially receiving and storing a public key.
Only users with the Senior security officer role can reset saved public keys of devices.
To reset saved device public keys:
- Use the web interface to connect to the Central Node with the Senior security officer role.
- Select the Assets section.
- On the Devices tab, select the devices for which you want to reset saved public keys.
- Right-click one of the selected devices to open the context menu.
- In the context menu, select Reset public key.
This opens a confirmation prompt window.
- In the prompt window, click OK.
Editing the settings of a secret
When editing the settings of a secret, you can change its type or set different credentials.
After secret settings, including the secret name, are modified, the new settings are applied in the active polling jobs in which the secret has been specified before. If you change the type of the secret, errors may occur the next time these jobs are started if the new type of the secret does not match connector settings.
To edit the settings of a secret:
- Log in to the web interface with the application administrator account.
- Select the Settings section, Secrets subsection.
- Select the secret that you want to edit.
The details area is displayed in the right part of the web interface window.
- Click Edit.
- Edit the settings as needed. You can edit the settings in the same way as when you adding a secret.
Critical information of the secret (passwords and the private key of the certificate) is not openly displayed. You can only replace the critical information of the secret with new critical information using the links above the fields with credentials.
Deleting secrets
You can delete secrets from the Kaspersky Anti Targeted Attack Platform secret storage.
Before deleting a secret, we recommend specifying a different secret or a different polling method in the active polling jobs that use this secret. If the deleted secret is specified in an active polling job, errors will occur the next time the job is run.
To delete secrets:
- Log in to the web interface with the application administrator account.
- Select the Settings section, Secrets subsection.
- Select the secrets that you want to delete.
- Click Delete.
This opens a confirmation prompt window.
- In the confirmation prompt window, confirm the deletion of the secrets.
Updating application databases
Application databases (hereinafter also referred to as "databases") are files with records used by the application components and modules to detect events occurring in your organization's IT infrastructure.
Virus analysts at Kaspersky detect hundreds of new threats daily (including "zero-day" exploits), create records to identify them, and include them in database updates packages ("update packages"). Update packages consist of one or more files containing records to identify threats that were detected since the previous update package was released. We recommend that you regularly receive update packages. When the application is installed, the database release date is the same as the application release date, and therefore you must update the databases immediately after installing the application.
The application automatically looks for new update packages on Kaspersky update servers once every 30 minutes. By default, if for some reason application databases are not updated for 24 hours, Kaspersky Anti Targeted Attack Platform displays this information in the Dashboard section of the window of the application web interface.
If the version of Kaspersky Anti Targeted Attack Platform is not supported, the application databases are not updated, and the Dashboard section in the System health window of the application web interface, displays the This version of Kaspersky Anti Targeted Attack Platform is no longer supported. Please upgrade the application to a supported version warning.
You can see which versions of the application are currently supported on the application lifecycle page.
The update functionality (including anti-virus signature updates and code base updates), as well as the KSN functionality may be unavailable in the territory of the USA.
Selecting a database update source
You can select the source from which the application will download database updates. The update source may be the Kaspersky server, or a network folder or local folder on one of the computers of your organization.
To select a database update source:
- In the window of the application web interface, select the Settings section, General settings subsection.
- In the Database update section, in the Update source drop-down list, select one of the following values:
- Kaspersky update server.
The application connects to Kaspersky update server over HTTP and downloads up-to-date databases.
- Kaspersky update server (secure connection).
The application connects to Kaspersky update server over HTTPS and downloads up-to-date databases. It is recommended to use HTTPS for database updates.
- Custom server.
The application connects to your FTP or HTTP server or to the folder with application databases on your computer to download up-to-date databases.
- Kaspersky update server.
- If you have selected Custom server, in the field under the name of this setting, enter the URL of the update package on your HTTP server or the full path to the folder on your computer containing the application database update package.
- Click Apply.
The application database update source is applied.
Page top
Updating databases manually
To start the database update manually:
- In the window of the application web interface, select the Settings section, General settings subsection.
- In the Database update section, click the Start button.
- Click Apply.
The application database update is started. The progress of the update will be displayed to the right of the button.
Page top
Creating a list of passwords for archives
The application does not scan password-protected archives. You can create a list of the most frequently encountered passwords for archives that are used when exchanging files within your organization. If you do so, the application will try passwords from the list when scanning an archive. If one of the passwords match, the archive will be unlocked and scanned.
The list of passwords set in application settings is also transmitted to the server with the Sandbox component.
To create a list of archive passwords:
- In the window of the application web interface, select the Settings section, Passwords for archives subsection.
- In the Passwords for archives field, enter the passwords that the application will use for password-protected archives.
Enter each password on a new line. You can enter up to 50 passwords.
- Click Apply.
The list of passwords for archives will be created. When scanning PDF files and files of Microsoft Word, Excel, and PowerPoint that are password protected, the application will use the passwords from the defined list.
Users with the Security auditor role can view the list of passwords for archives, but cannot edit it.
Page top
Configuring integration with ArtX TLSproxy
You can configure the integration of Kaspersky Anti Targeted Attack Platform with ArtX TLSproxy to unwrap encrypted SSL/TLS traffic. Integrating Kaspersky Anti Targeted Attack Platform with ArtX TLSProxy improves the security and performance of infrastructure. For integration, you only need to configure the ArtX TLSProxy application.
Compatibility is guaranteed with ArtX TLSProxy 1.9.1
To configure the integration of Kaspersky Anti Targeted Attack Platform with ArtX TLSproxy:
- Specify and edit integration settings in ArtX TLSproxy.
For more details on specifying and editing integration settings in ArtX TLSproxy, see the ArtX TLSproxy User Manual on the ArtX website.
- Create the erspan.netdev file in the /etc/systemd/network directory with the following contents:
[NetDev]Name=<name of the ERSPAN interface>Kind=erspan[Tunnel]Independent=trueERSPANIndex=<index or port number associated with the ERSPAN traffic source port>Local = <local fixed IP address of the network interface on which you are configuring ERSPAN traffic transmission>Remote = <IP address of the server hosting the Kaspersky Anti Targeted Attack Platform application on which you want to process ERSPAN traffic>Key = <Sequential number or key of the GRE header>.If not used, enter 0 as the value.SerializeTunneledPackets=true - Create the erspan.network file in the /etc/systemd/network directory with the following contents:
[Match]Name=<name of the ERSPAN interface>[Network]Address = <local IP address of the network interface/network interface mask> - Restart the server with the Kaspersky Anti Targeted Attack Platform application on which you are configuring the integration with ArtX TLSproxy.
- Go to the ArtX TLSproxy application and specify the network interfaces that you configured.
The settings in the erspan.netdev and erspan.network files must match the settings that you specified in ArtX TLSproxy.
Integration with ArtX TLSproxy is configured.
Page top
For security officers: Getting started with the application web interface
This section is intended for specialists who are in charge of providing data security within an organization. It contains information and instructions on configuring resources for the security of a corporate IT infrastructure and timely detection of threats.
The application allows multiple security officers to work together.
Kaspersky Anti Targeted Attack Platform Interface
The application is managed through the web interface. Sections of the application web interface differ depending on the role of the user: Administrator or Senior security officer (Senior security officer, Security officer, Security auditor).
The window of the application web interface contains the following:
- Sections in the left part and in the lower part of the application web interface window.
- Tabs in the upper part of the application web interface window for certain sections of the application.
- The workspace in the lower part of the application web interface window.
Sections of the application web interface window
The application web interface provides the following sections for users with the Senior security officer, Security officer, and Security auditor roles:
- Dashboard. Contains Kaspersky Anti Targeted Attack Platform Monitoring data.
For users with the Security auditor role, the Dashboard window contains the following sections: Alerts, System health.
- Alerts. Contains information about alerts in the network of the tenant to which you have access.
- Network traffic events. Information about events and aggregate events in network traffic.
- Threat Hunting. Contains information about events found on hosts of the tenant to which you have access.
- Tasks. Contains information about tasks that you can use to manage files and application on hosts.
- Prevention. Contains information about policies that you can use to manage preventions of files running on selected hosts.
- Custom rules: TAA, Intrusion detection, IOC, YARA, Sandbox. Contains information for managing user-defined rules.
- Storage: Files, and Quarantine. Contains information for managing objects in quarantine and Storage.
- Assets. Contains information about computers with the Kaspersky Endpoint Agent component and their settings.
- Network map: Network interactions map, Topology map, Network sessions. Contains information about the interaction of devices at different periods of time, diagrams of physical connections of devices in the network and information about network sessions.
- Risks and anomalies. Contains information about the risks to which the resources of the information system are exposed.
- Reports: Generated reports and Templates. Contains a report builder and a list of generated reports about alerts.
- Logs: Application messages. Contains information about application performance.
- Settings: Connectors, Secrets, IOC scanning schedule, Endpoint Agents, KPSN reputation database, Notification rules, VIP status, Exclusions, Allow rules, Sandbox servers, Passwords for archives, and License. Contains information about connector settings, secrets, the IOC scan schedule, Endpoint Agent component settings, and the settings for publishing objects in KPSN and assigning the VIP status to alerts based on information contained in alerts, the list of allowed objects, and IDS, TAA (IOA), and ICAP rules excluded from scanning, passwords of archives, and added keys.
For users with the Security auditor role, the web interface of the application contains the following sections in addition to those listed above:
- Operating mode. Contains information about PCN and SCN servers and about tenants in distributed solution and multitenancy mode.
- Sensor servers. Contains information about Central Node components and Sensor components connected to them.
- Sandbox servers. Contains information about the connection of the Central Node component to Sandbox components.
- External systems. Contains information about application integration with mail sensors.
- Server configuration. Contains information about the sizing parameters of the application.
Workspace of the application web interface window
The workspace displays the information you choose to view in the sections and on the tabs of the application web interface window. It also contains control elements that you can use to configure how the information is displayed.
Selecting a tenant to manage in the web interface of the application
If you are using the distributed solution and multitenancy mode with a Senior security officer or Security officer account, before you begin using the web interface, you must select the tenant that you want to manage in the application web interface.
To select a tenant to manage in the web interface of the application:
- In the upper part of the application web interface menu, click the arrow next to the name of the tenant.
- In the Select tenant drop-down list, select a tenant.
You can also start typing the name of the tenant in the search box and select the tenant from the list of search results.
All actions in the application web interface are applied to the selected tenant. If you want to select a different tenant, repeat the steps to select the tenant.
Users with the Security auditor role cannot select a tenant to manage in the web interface.
Page top
Monitoring the performance of the application
You can monitor application operation using the widgets in the Dashboard section of the application web interface window. You can add, delete, and move widgets, configure the display scale of widgets, and select the data display period.
About widgets and layouts
You can use widgets to monitor application operation.
A layout is the appearance of the workspace of the application web interface window in the Dashboard section. You can add, delete, and move widgets in the layout, as well as configure the scale of widgets.
If you are using the distributed solution and multitenancy mode, this section displays information for the selected tenant. NDR widgets display information only for the current or selected node.
By default, this section displays information only on alerts that were not processed by users. To also display information on processed alerts, enable the Show closed alerts toggle switch in the upper-right corner of the window.
The Dashboard section displays the following widgets:
- Alerts:
- Alerts by status. Displays the alert status depending on the Kaspersky Anti Targeted Attack Platform user processing the alert and on whether or not this alert has been processed.
- Alerts by technology. Displays the names of the application modules or components that generated the alert.
- Alerts by attack vector. Displays detected objects based on the vector of the attack.
- VIP alerts by importance. Displays the importance of alerts with VIP status depending on the impact that these alerts may have on the security of computers or the corporate LAN based on Kaspersky experience.
- Alerts by importance. Displays the importance of alerts for users of the Kaspersky Anti Targeted Attack Platform depending on the impact that these alerts may have on the security of computers or the corporate LAN based on Kaspersky experience.
The left part of each widget displays attack vectors, alert importance levels, alert states, and scanning technologies that generated the alerts. The right part of each widget displays the number of times the alerts were triggered during the selected period for data display in widgets.
Clicking the link with the name of the attack vector, alert importance level, alert state, and the scanning technology that generated the alert takes you to the Alerts section of the application web interface where you can view related alerts. Alerts are filtered based on the selected element.
- Top 10:
- Domains. 10 domains most frequently seen in alerts.
- IP addresses. 10 IP addresses most frequently seen in alerts.
- Sender's email addresses. 10 email senders most frequently seen in alerts.
- Recipient's email addresses. 10 email recipients most frequently seen in alerts.
- TAA hosts. 10 hosts that occur most frequently in events and alerts generated by the Targeted Attack Analyzer (TAA) technology.
- TAA rules. 10 TAA (IOA) rules that occur most frequently in events and alerts generated by the Targeted Attack Analyzer (TAA) technology.
- Sent to Sandbox by TAA rules. 10 TAA (IOA) rules that most frequently cause Kaspersky Anti Targeted Attack Platform to send files for scanning by the Sandbox component.
The left part of each widget lists the domains, email addresses of recipients, IP addresses and email addresses of message senders, host names, and TAA (IOA) rule names. The right part of each widget displays the number of times the alerts were triggered during the selected period for data display in widgets.
By clicking the link with the name of each domain, recipient address, IP address, and message sender address, you can go to the Alerts section of the application web interface and view related alerts.
Click the link with the host name and the name of the TAA (IOA) rule to go to the Events section of the application web interface and view related events.
Alerts and events are filtered based on the selected element.
- NDR:
- Network traffic event scores. Bar graph of the distribution of events by their scores for the selected period. The bars correspond to integer values of scores. You can change the data display mode to a pie chart with the distribution of events by severity levels. Depending on its score, an event may have a Low (0.0–3.9), Medium (4.0–7.9), or High (8.0–10.0) severity.
- Network traffic events by technology. How many events have been registered by which event registration technology during the selected period.
- Device security status. Distribution of devices by their security states.
- Frequent application users in network traffic events. User names most frequently registered in events based on information from EPP applications for the selected period.
- Frequent applications in network traffic events. Third-party applications most frequently registered in events based on information from EPP applications for the selected period.
- Frequent devices in network traffic events. The most frequently registered devices in events for the selected period.
- Frequent devices by risk count. The most frequently registered devices in detected risks for the selected period.
- Risk scores. Bar graph of the distribution of risks by their scores for the selected period. The bars correspond to integer values of scores. You can change the data display mode to a pie chart with the distribution of risks by severity levels. Depending on its score, a risk may have a Low (0.0–3.9), Medium (4.0–7.9), or High (8.0–10.0) severity.
- Custom widget. You can create widgets with arbitrary content. For example, you can use custom widgets to logically separate groups of widgets in the Dashboard section.
- Devices. Contains information about devices on the network (arranged by device category).
- Network traffic events. Contains information about the NDR events and aggregate events that have the most recent last-seen date and time.
- Situational awareness. Notifications about currently identified threats to system security (for example, Detected 10 unauthorized network interactions). The widget displays notifications in order of their importance.
- Protection by EPP applications. Ratio of the number of computers protected by EPP applications to the number of computers not protected by EPP applications. The total number of protected and unprotected computers is displayed in the center of the pie chart.
A computer is considered protected by an EPP application if Kaspersky Anti Targeted Attack Platform is aware of the following conditions being satisfied:
- An EPP application is installed on the computer.
- The Real-Time Protection task is running for the EPP application.
- The connection of the EPP application to the integration server has the Active status.
A computer is considered unprotected by an EPP application if at least one of the conditions is not satisfied. The check for the lack of EPP application protection is performed for all devices in Kaspersky Anti Targeted Attack Platform that contain the name of the Windows operating system (any version) as the installed operating system, or if the devices belong to one of the following categories:
- Server
- Workstation
For correct information to be displayed in NDR widgets, you must configure the synchronization of date and time between Central Node and Sensor components.
Widgets display only basic information that changes dynamically. If you need to view detailed information (for example, about devices with issues), you can navigate from the Dashboard section to other sections of the application web interface. You can navigate the web interface by clicking widgets.
Adding a widget to the current layout
To add a widget to the current layout:
- Select the Dashboard section in the application web interface window.
- In the upper part of the window, click the button.
- In the drop-down list, select Customize.
- Click Widgets.
- In the Manage widgets window that opens:
- If you want to add a widget associated with alerts or rules, in the Alerts or Top 10 list, select the toggle switch next to the widget that you want to add.
- If you want to add a widget related to the NDR functionality, click the button in the [NDR] list next to the name of the widget that you want to add.
- Close the Manage widgets window and click Apply.
The widget is added to the current layout.
Moving a widget in the current layout
To move a widget in the current layout:
- Select the Dashboard section in the application web interface window.
- In the upper part of the window, click the button.
- In the drop-down list, select Customize.
- Select the widget that you want to move within the layout.
- Click and hold the upper part of the widget to drag and drop the widget to a different place in the layout.
- Click Apply.
The current layout is saved.
Changing the display of information in NDR widgets
After an NDR widget is added, it displays information in accordance with the default settings. If necessary, you can edit the display settings.
To edit NDR widget display settings:
- Select the Dashboard section in the application web interface window.
- In the upper part of the window, click the button.
- In the drop-down list, select Customize.
- In the upper-right corner of the NDR widget that you want to configure, click the button.
This opens the display settings window.
- Manage the settings of the widget.
Depending on the selected NDR widget, the window may contain the following settings:
- Change name – if the Change name check box is selected, you can define any name for the widget (different from the default name) in the Widget name field. The Change name setting is absent from custom widgets.
- Widget name – field for entering a widget name different from the default name.
- Edit description – if the Edit description check box is selected, you can provide any description for the widget (different from the default description) in the Widget description field. The Edit description setting is absent from custom widgets.
- Widget description – field for entering a widget name different from the default name.
- Refresh period – the time in seconds after which the displayed information is updated.
- Defined background – defines the color of the background on the custom widget. You can choose a background color that corresponds to one of the severity levels (Info, Warning, or Critical) or select Neutral to disable background coloring.
- Display mode – determines how data is displayed in the widget. You can configure the display of information as a bar chart or a pie chart.
- Take into account events with Resolved status – if Take into account events with Resolved status is selected, the widget displays data for all events.
- Include remediated and accepted risks – if Include remediated and accepted risks is selected, the widget displays data for all risks.
- Click Apply.
Removing a widget from the current layout
To remove a widget from the current layout:
- Select the Dashboard section in the application web interface window.
- In the upper part of the window, click the button.
- In the drop-down list, select Customize.
- Click the icon in the upper right corner of the widget that you want to remove from the layout.
The widget is removed from the workspace of the application web interface window.
- Click Apply.
The widget is removed from the current layout.
Saving a layout to PDF
NDR widgets in the layout are not saved to PDF.
To save a layout to PDF:
- Select the Dashboard section in the application web interface window.
- In the upper part of the window, click the button.
- In the drop-down list, select Save as PDF.
This opens the Saving as PDF window.
- In the lower part of the window, in the Layout drop-down list, select the page orientation.
- Click Download.
The layout in PDF format is saved to the hard drive of your computer in the downloads folder of the browser.
- Click Close.
Configuring the data display period in widgets
You can configure the display of data in widgets for the following periods:
- Day.
- Week.
- Month.
For NDR widgets, you can use the following periods:
- 1h
- 12h
- 24h
- 7d
You can configure a data display period for each individual NDR widget.
Changing the display of information in widgets
To configure the display of data in widgets for a day (from 00:00 a.m. to 11:59 p.m.):
- Select the Dashboard section in the application web interface window.
- In the upper-right corner of the application web interface window, in the drop-down list of data display periods, select Day.
- In the calendar to the right of the Day period name, select the date for which you want to display data in the widget.
All widgets on the Dashboard page display data for the period you selected.
To configure the display of data on widgets for a week (Monday through Sunday):
- Select the Dashboard section in the application web interface window.
- In the upper-right corner of the application web interface window, in the drop-down list of data display periods, select Week.
- In the calendar to the right of the Week period name, select the week for which you want to display data in the widget.
All widgets on the Dashboard page display data for the period you selected.
To display data display in widgets for a month (calendar month):
- Select the Dashboard section in the application web interface window.
- In the upper-right corner of the application web interface window, in the drop-down list of data display periods, select Month.
- In the calendar to the right of the Month period name, select the month for which you want to display data in the widget.
All widgets on the Dashboard page display data for the period you selected.
Changing the display of information in widgets
To configure the display of information in an NDR widget:
- Select the Dashboard section in the application web interface window.
- In the upper-right corner of the NDR widget that you want to configure, click the button that stands for the time interval that you need.
The NDR widget displays information for the selected period.
Configuring the widget display scale
You can configure the display scale for "Alerts" type widgets. The ![]() icon in the upper right corner of a widget means you can configure the scale for that widget.
icon in the upper right corner of a widget means you can configure the scale for that widget.
To configure the display scale for widgets:
- Select the Dashboard section in the application web interface window.
- In the upper part of the window, click the button.
- In the drop-down list, select Customize.
- Click
 in the upper right corner of the widget.
 - In the drop-down list, select one of the following widget display sizes:
- 1x1.
- 2x1.
- 3x1.
The display scale of the selected widget is modified.
- Repeat the steps for all widgets for which you want to set the display scale.
- Click Save.
The display scale of widgets is configured.
Basics of managing "Alerts" type widgets
You can configure the display scale for all "Alerts" type widgets.
The left part of each widget displays the legend for colors used in widgets.
Example: The Alerts by importance widget displays the number of alerts of various importance. Importance—Alert importance for the Kaspersky Anti Targeted Attack Platform user depending on the impact this alert may have on computer or corporate LAN security based on Kaspersky experience. In the Alerts by importance widget, the following colors correspond to importance levels:
|
To the right of the legend, the number of alerts of each type for the selected period for displaying data in widgets is displayed.
By clicking the link with the type of each alert, you can go to the Alerts section of the application web interface and view all alerts of this type. Alerts are filtered based on the specific type.
Example: The Alerts by attack vector widget displays Files from email alerts, which indicate the number of files that Kaspersky Anti Targeted Attack Platform detected in mail traffic for the selected period. Clicking the Files from email link opens the Alerts section and displays all alerts associated with the detection of files in mail traffic for the selected period. Data will be filtered based on the following parameters: Object type=FILE and Object source=MAIL. |
The right part of each widget displays data columns. The vertical axis shows the number of events, and the horizontal axis shows the date and time of the alert creation. You can edit the period of data display in widgets and select the tenant for which information is displayed in the widget.
Position your mouse cursor on each data column to display the number of alerts counted for the period represented by the specific column. The number of unprocessed alerts is displayed by default. You can enable the display of processed alerts by selecting the Processed check box in the upper-right corner of the window. In this case, the total number of all alerts will be displayed.
Information in the Devices widget
The Devices widget in the Dashboard section belongs to the NDR functionality and displays information about devices in the list of devices known to the application.
The widget provides the following information:
- Information about how many devices the application knows for each category. This information is displayed in the upper part of the widgets as category icons. Under each category icon, the number of devices of that category is displayed. If the list of devices known to the application contains devices with issues, the icons of the corresponding categories have a warning badge.
- List of categories with devices with issues. This information is displayed in the middle part of the widget if such devices exist. The space for displaying graphics is limited by the size of the widget.
Devices with issues
The application considers that a device has issues in any of the following cases:
- The device has a status of Authorized and a security state other than OK.
- The device has a status of Unauthorized.
If any devices have issues, the following information is displayed for each category in the list:
- A line with the category icon, a text description, and a link with the number of devices with issues.
- A line with graphical representations of devices. This line is displayed if the widget has sufficient free space. The number of graphics in the line depends on the current size of the web browser window. If there are more devices with issues than represented in the line, the number of hidden devices is displayed on the right, in the
+ <number of devices>format.
Device graphics
Graphical representations of devices include the following information:
- Device name.
- Device status. This is displayed as an icon if the device has a status of Unauthorized.
- Device security status. Displayed as a colored line on the left border of the graphic. The color of the line corresponds to the OK, Warning, or Critical states.
The graphics are displayed in the following order:
- Devices assigned a status of Unauthorized.
- Devices with a Critical security state.
- Devices with a Warning security state.
Navigating to other sections from the widget
You can use elements of the Devices widget interface to navigate to the devices table and display detailed information about devices. The following options are available to achieve this.
Navigating to the table of devices and filtering the table
To navigate to the table of devices and view information about all devices in the selected category:
In the upper part of the Devices widget, click the icon of the relevant category.
This opens the Assets section containing the devices table. Filtering by the selected device category is applied to the table.
To navigate to the table of devices and view information about devices with issues that belong to a certain category:
In the list of categories of devices with issues, click the link with the number of devices of the relevant category. The link is displayed at the end of the line with the category icon and the text comment with issues.
This opens the Assets section containing the devices table. Filtering is applied in the table by IDs of devices with issues that belong to a certain category.
The devices table is filtered based on the IDs of those devices that were displayed in the Devices widget when you proceeded to the devices table. After navigating to the table of devices, the filtering conditions are not updated. If you want to view the current number of devices with issues, you can go to the Dashboard section again.
To go to the table of devices and view information about a device with issues:
In the Devices widget, click the graphical element that represents the relevant device.
This opens the Assets section containing the devices table. Filtering by device ID is applied to the table.
To go to the table of devices without changing the current table filtering conditions:
Click the Show all devices in the Devices widget.
This opens the Assets section containing the devices table. The table displays devices that match filtering conditions that have been configured for the table of devices.
Navigating to the table of devices and searching the table
To go to the devices table and find devices in the table:
- In the Devices widget, enter your search query into the Search devices field.
- Click Search.
This opens the Assets section containing the devices table. The table displays devices that match your search criteria.
Page top
Information in the Events widget
The Network traffic events widget in the Dashboard section displays general information about the NDR events and aggregate events that have the most recent last-seen date and time.
The widget displays the following elements:
- A histogram of NDR events and aggregate events for the selected period. This information is displayed in the upper part of the widget. The histogram displays the distribution of NDR events and aggregate events by severity level.
- A list of information about registered NDR events and aggregate events, sorted by their last-seen date and time. This information is displayed in the middle part of the widget.
Statistics of NDR events and aggregate events
On the distribution histogram of NDR and aggregate events, the bars correspond to the total number of events for each time interval. Inside the bars, the colors stand for severity levels of events. The following colors correspond to the severity levels:
- Blue. This color is used for Low-severity NDR events and aggregate events.
- Yellow. This color is used for Medium-severity NDR events and aggregate events.
- Red. This color is used for High-severity NDR events and aggregate events.
You can hover over a bar to view information about it. The pop-up window displays information about the date and time of the interval, as well as the number of NDR events and aggregate events by severity level.
The length of the time intervals depends on the selected display period. You can select a period for the histogram with the following buttons:
- 1h: one-hour period, subdivided into one-minute intervals.
- 12h: 12-hour period, subdivided into one-hour intervals.
- 24h: 24-hour period, subdivided into one-hour intervals.
- 7d: seven-day period, subdivided into one-day intervals.
List of NDR events and aggregate events
The list of NDR events and aggregate events in the Network traffic events widget is updated in on-line mode. NDR events and aggregate events with the most recent last-seen date and time are placed at the top of the list.
The number of displayed items in the list of NDR events and aggregate events is limited by the size of the widget.
For each event in the list, the following information is provided:
- Title of the NDR event or aggregate event.
- Last-seen date and time.
- Icon that stands for the severity of the NDR event or aggregate event:
 – Low severity level
 – Medium severity level
 – High severity level
Aggregate events in the list are marked with  .
.
Navigating to other sections from the widget
You can use the controls of the Network traffic events interface to go to the events table and display detailed information about NDR events and aggregate events. The following options are available to achieve this.
Navigating to the table of network traffic events and filtering the table
You can view detailed information about an NDR event or aggregate event by clicking the event in the list of the Network traffic events widget. Doing so opens the Network traffic events section in which the table will be filtered based on the ID of the selected NDR event or aggregate event. The filtering criteria also include the period from the date and time of registration of an NDR event or aggregate event to the current moment (without specifying the right bound of the period).
If you want to go to the table of network traffic events without changing the current filtering conditions of the table in the Network traffic events section, click the Show all events link in the Network traffic events widget.
Navigating to the table of events and searching the table
To go to the devices table and find devices in the table:
- In the Network traffic events widget, enter your search query into the Search events field.
- Click Search.
This opens the Network traffic events section. The table of events displays NDR events and aggregate events that match the search criteria.
Page top
Viewing the working condition of modules and components of the application
If modules or components of the application encounter errors that the administrator is advised to look at, a yellow warning box is displayed in the upper part of the Dashboard section of the application web interface.
Users with the Administrator or Security auditor role can gain access to information about the working condition of the Central Node, PCN, or SCN server that the user is currently managing.
Users with the Senior security officer, Security officer, or Security auditor role can gain access to the following information about the working condition:
- If you are using a standalone Central Node server, the user can access information about the working condition of the Central Node server which the user is currently managing.
- If you are using the distributed solution and multitenancy mode, and the user is managing an SCN server, the user can gain access to information about the working condition of that SCN server for tenants to whose data the user has access.
- If you are using the distributed solution and multitenancy mode, and the user is managing the PCN server, the user can gain access to information about the working condition of the PCN server and all SCN servers connected to that server, for tenants to whose data the user has access.
For details about the working condition of application modules and components,
click View details to open the System health window.
In the System health window, one of the following icons is displayed depending on the working condition of the application modules and components:
- if the modules and components of the application are working normally.
- An icon with the number of problems (for example, ) if problems are found that the administrator is recommended to pay attention to. In this case, detailed problem information is displayed in the right part of the System health window.
The System health window contains the following sections:
- Component health contains information on the operational status of application modules and components, quarantine, and database update on all servers where the application is running.
Example:
If the databases of one or more application components have not been updated in 24 hours, the
icon is displayed next to the name of the server on which the application modules and components are installed.To resolve the problem, make sure that update servers are accessible. If you are using a proxy server to connect to update servers, make sure the proxy server has no errors pertaining to the connection to Kaspersky Anti Targeted Attack Platform servers.
- Processed—Status of receiving and processing incoming data. The status is generated based on the following criteria:
- State of receiving data from servers with the Sensor component, from the server or virtual machine with the mail sensor, from hosts with the Endpoint Agent component.
- Information about exceeding the maximum allowed time that objects wait in the queue to be scanned by application modules and components.
- Connection with servers—Status of the connection between the PCN server and connected SCN servers (displayed if you are using the distributed solution and multitenancy mode).
If problems are detected with the performance of application modules or components and you cannot resolve those problems on your own, please contact Kaspersky Technical Support.
Managing technologies
Kaspersky Anti Targeted Attack Platform uses various technologies to analyze network traffic. You can enable or disable the technologies individually. For the Device Activity Detection (AM) technology, you can select the mode: learning mode or monitoring mode.
We recommend enabling the learning mode for a predetermined time to have the application automatically switch the technology to monitoring mode at the right time. The monitoring mode is the normal mode of the technology (as opposed to the learning mode, in which the application only accumulates data for future use). When setting up the learning mode, you can configure the time when you want the technology to switch to monitoring mode.
You can specify the same technology settings for all components and monitoring points, or you can specify special settings for some components and/or monitoring points. Technology settings can be automatically inherited from parent objects to child objects. If technology inheritance is enabled for a component or monitoring point, the technology settings specified for the parent object (Central Node or Sensor) are applied to that object. If technology inheritance is disabled, you can configure special settings for technologies on that component or monitoring point.
By default, all technologies are enabled after application installation. Learning mode is enabled by default for technologies that support modes.
Enabling or disabling technologies
You can enable or disable technologies for Central Node and Sensor components and monitoring points. However, enabling and disabling technologies for Sensor components and monitoring points is available if technology inheritance is disabled on these objects.
Some technologies include methods that can be enabled or disabled individually. If a technology or method is disabled, the application does not monitor device interactions using the technology or method. However, you can still manage application settings related to disabled technologies or methods (for example, add or edit rules).
The following technologies and methods support enabling and disabling:
- Asset Management, hereinafter also "AM":
- Device Activity Detection.
- Device Information Detection.
- Network Session Detection.
- Intrusion Detection, hereinafter also "IDS":
- Rule-based Intrusion Detection.
- ARP Spoofing Detection.
- IP Protocol Anomaly Detection.
- TCP Protocol Anomaly Detection.
- Brute-force Attack and Scan Detection.
To change the state of technologies and methods:
- Select the Sensor servers section in the window of the application web interface.
- Click the card of the relevant component or monitoring point.
This opens a window with information about the component or monitoring point.
- If you want to change the state of technologies and methods for a Sensor component or a monitoring point, set the Inherit Server technologies toggle switch to Disabled.
- Use the toggle switches in the left part of the window to enable or disable technologies and/or methods. You can enable or disable all technologies and methods simultaneously by clicking Enable all or Disable all.
- After enabling or disabling a technology or method, wait until the changes are applied. The switch does not become available again until the transition to the other state is completed.
The state of technology and methods is changed.
Configuring Device Activity Detection mode
You can configure the learning mode or enable the monitoring mode for the Device Activity Detection (AM) technology.
To change and configure the mode of the technology:
- Select the Sensor servers section in the window of the application web interface.
- Click the card of the relevant component or monitoring point.
This opens a window with information about the component or monitoring point.
- If you want to configure the mode of the technology for a Sensor component or a monitoring point, set the Inherit Server technologies toggle switch to Disabled.
- In the drop-down list to the right of the technology name, select a mode (Learning or Monitoring).
- After selecting the mode, wait for the changes to be applied. Before the mode is applied, the Changing status is displayed in the drop-down list.
- If you want to specify the date and time when the technology must switch from learning mode to monitoring mode, click the Set until link and select a date and time. If a date and time has been configured before, the date and time is displayed next to the name of the mode.
The mode of the technology is configured.
Managing technology inheritance
You can enable technology inheritance if you want technology settings configured for the parent object to be automatically applied to a Sensor component or monitoring point. This means the Sensor component gets the technology settings of the Central Node component, and the monitoring point gets the settings of the component on which the monitoring point was added (Central Node or Sensor).
If necessary, you can disable technology inheritance for the Sensor component or the monitoring point. You may need to do this to specify special technology settings.
To enable or disable technology inheritance for a Sensor component or monitoring point:
- Select the Sensor servers section in the window of the application web interface.
- Click the card of the relevant component or monitoring point.
This opens a window with information about the component or monitoring point.
- Set the Inherit Server technologies toggle switch as necessary.
Technology inheritance for a Sensor component or monitoring point is enabled or disabled.
Viewing the alert table
Detected signs of targeted attacks and intrusions into the corporate IT infrastructure are displayed as a table of alerts.
The table of alerts does not display information on objects which satisfy at least one of the following conditions:
- The object has reputation Trusted in the KSN database.
- The object is digitally signed by a trusted vendor:
- Kaspersky.
- Google.
- Apple.
- Microsoft.
Information about these alerts is saved to the application log. You can view this information.
Information about alerts in the application log is rotated every night when the maximum allowed number of alerts is reached:
- Alerts generated by the (IDS) Intrusion Detection System and (URL) URL Reputation components have a maximum of 100,000 alerts for each component.
- All other alerts have a maximum of 20,000 alerts for each module or component.
If you are using the distributed solution and multitenancy mode, rotation is performed on all SCNs and then synchronization with the PCN is performed. After synchronization, all deleted alerts are automatically deleted from the PCN.
NDR alerts are generated if a valid KATA+NDR license key is present. After the license key expires, created alerts remain available for viewing, but new alerts are not created.
The alerts table is in the Alerts section. It displays general KATA alerts and NDR alerts.
By default, this section displays information only on alerts that were not processed by users. To also display information on processed alerts, enable the Show closed alerts toggle switch in the upper-right corner of the window.
You can sort alerts in the table by Created or Updated, Importance, Source, and State columns.
The table of alerts contains the following information:
- VIP specifies if the alert has a status with special access rights. For example, alerts with the VIP status cannot be viewed by users with the Security officer role.
- Created is the time when the alert was created, and Updated is the time when the alert was updated.
 —Alert importance for the Kaspersky Anti Targeted Attack Platform user depending on the impact this alert may have on computer or corporate LAN security based on Kaspersky experience.
Alerts can have one of the following importance levels:
- High, marked with the symbol—the alert has a high level of importance.
- Medium, marked with the symbol—the alert has a medium level of importance.
- Low, marked with the symbol—the alert has a low level of importance.
- High, marked with the
- Detected—One or multiple categories of detected objects. For example, when the application detects a file infected with the Trojan-Downloader.JS.Cryptoload.ad virus, the Detected field shows the Trojan-Downloader.JS.Cryptoload.ad category for this alert.
- Details—Brief summary of the alert. For example: the name of a detected file or URL address of a malicious link.
- Source—Address of the source of the detected object. For example, this can be the email address from which a malicious file was sent, or the URL from which a malicious file was downloaded.
- Destination—Destination address of a detected object. For example, this can be the email address of your organization's mail domain to which a malicious file was sent, or the IP address of a computer on your corporate LAN to which a malicious file was downloaded.
- Technologies are names of the application modules or components that generated the alert while scanning.
The Technologies column may indicate the following application modules and components:
- (YARA) YARA.
- (SB) Sandbox.
- (URL) URL Reputation.
- (IDS) Intrusion Detection System.
- (AM) Anti-Malware Engine.
- (TAA) Targeted Attack Analyzer.
- (IOC) IOC.
- (NDR: IDS) Intrusion Detection System.
- (NDR: EA) External Analysis.
- State—Alert status depending on whether or not this alert has been processed by the user of Kaspersky Anti Targeted Attack Platform.
Alerts can have one of the following states:
- New for new alerts.
- In process for alerts that are already being processed by Kaspersky Anti Targeted Attack Platform user.
- Rescan for alerts resulting from a rescan of an object.
- Servers is the list of names of servers which created the alert. Servers belong to the tenant that you are managing in the application web interface. This column is displayed if you are using the distributed solution and multitenancy mode.
- Assigned to is the name of the user to which the alert is assigned.
If information in the table column is displayed as a link, you can click the link to open the filter menu, in which you can select the settings for filtering by this column.
The Intrusion Detection System module consolidates information about processed network events in one alert when the following conditions are simultaneously met:
- The name of the triggered rule, version of application databases, and source all match for network events.
- No more than 24 hours elapsed between the events.
One alert is displayed for all network events that meet these conditions. The alert notification contains information only about the first network event.
Page top
Configuring the alert table display
You can show or hide columns and change the order of columns in the alert table.
To configure the alert table display:
- Select the Alerts section in the window of the application web interface.
This opens the table of alerts.
- In the heading part of the table, click .
This opens the Customize table window.
- If you want to show a column in the table, select the check box next to the name of the parameter that you want displayed in the table.
If you want to hide a parameter in the table, clear the check box.
At least one check box must be selected.
- If you want to change the order of columns in the table, move the mouse cursor to the row with the relevant parameter, click and move the row to its new place.
- If you want to restore default table display settings, click Restore defaults.
- Click Apply.
The alert table display is configured.
Page top
Filtering, sorting, and searching alerts
You can filter alerts to be displayed in the table of alerts for one or several columns of the table, or search for alerts in certain table columns according to the search criteria you specify.
You can create, save, and remove filters, and start filtering and searching alerts based on the conditions specified in saved filters.
If you are using the distributed solution and multitenancy mode, you cannot save filters on the PCN.
Filters are saved for each user on the server on which they were created.
You can also sort alerts in the table by Created or Updated, Importance, Source, and State columns.
By default, this section displays information only on alerts that were not processed by users. To also display information on processed alerts, enable the Show closed alerts toggle switch in the upper-right corner of the window.
Filtering alerts by VIP status
You can filter alerts and search for alerts in the alerts table based on the ![]() criterion, which indicates whether the alert has a status with special access rights. For example, alerts with the VIP status cannot be viewed by users with the Security officer role.
criterion, which indicates whether the alert has a status with special access rights. For example, alerts with the VIP status cannot be viewed by users with the Security officer role.
To filter alerts by VIP status:
- Select the Alerts section in the window of the application web interface.
This opens the table of alerts.
- Click the heading of the VIP column to expand the list of filter settings.
- Configure alert filtering settings:
- If you want the table of alerts to display only alerts that have the VIP status, select VIP.
- If you want the table of alerts to display all alerts, select All.
If neither is selected, the table shows all alerts.
The table of alerts displays only alerts matching the filter criteria you have set.
Filtering and searching alerts by time
You can filter alerts and search for them in the table of alerts based on the Created value, that is, the time when the alert was created, and the Updated value, that is, the time when the alert was updated.
To filter or search alerts by time:
- Select the Alerts section in the window of the application web interface.
This opens the table of alerts.
- Click the Created or Updated link to open the list of alert display periods.
- In the drop-down list, select one of the following alert display periods:
- All if you want the application to display all alerts in the table.
- Last hour if you want the application to display alerts that occurred during the last hour in the table.
- Last day if you want the application to display alerts that occurred during the last day in the table.
- Custom range if you want the application to display alerts that occurred during the period you specify in the table.
- If you have selected the Custom range event display range, do the following:
- In the calendar that opens, specify the start and end dates of the alert display period.
- Click Apply.
The calendar closes.
The table of alerts displays only alerts matching the filter criteria you have set.
Filtering alerts by level of importance
You can filter alerts based on the ![]() Importance criterion, which indicated the alert importance for the Kaspersky Anti Targeted Attack Platform user depending on the impact this alert may have on computer or corporate LAN security based on Kaspersky experience.
Importance criterion, which indicated the alert importance for the Kaspersky Anti Targeted Attack Platform user depending on the impact this alert may have on computer or corporate LAN security based on Kaspersky experience.
To filter alerts by importance:
- Select the Alerts section in the window of the application web interface.
This opens the table of alerts.
- Click to expand the filter settings list.
- Select one or several of the following alert importance levels:
- Low for low-importance alerts.
- Medium for medium-importance alerts.
- High for high-importance alerts.
If no value is selected, the table shows alerts of all importance levels.
- Click Apply.
The table of alerts displays only alerts matching the filter criteria you have set.
Filtering and searching alerts by categories of objects detected
You can filter alerts and search the alerts table for specific alerts based on the Detected criterion, which indicates one or multiple categories of the object detected in the event. For example, if you want the table to display alerts about files infected by a specific virus, you can set a filter based on the name of this virus.
To filter or search alerts by category of the detected object:
- Select the Alerts section in the window of the application web interface.
This opens the table of alerts.
- Click the Detected link to open the filter configuration window.
- In the drop-down list, select one of the following alert filtering operators:
- Contain
- Not contain
- In the entry field, type the name of a category (for example, Trojan) or several characters from the name of a category.
- To add a filter condition using a different criterion, click and specify the filter condition.
- Click Apply.
The table of alerts displays only alerts matching the filter criteria you have set.
Filtering and searching alerts by obtained information
You can filter alerts and search the alerts table for specific alerts based on the Details criterion, which refers to brief information about the alert. For example: the name of a detected file or URL address of a malicious link.
To filter or search alerts by obtained information:
- Select the Alerts section in the window of the application web interface.
This opens the table of alerts.
- Click the Details link to open the filter configuration window.
- In the drop-down list on the left, select one of the following search criteria:
- Details. The search will encompass all data on the detected object.
- ID.
- File name.
- File type.
- MD5.
- SHA256.
- URL.
- Domain.
- User Agent.
- Subject.
- HTTP status.
- Object source.
- Object type.
- Autosend to Sandbox.
- TAA (IOA) rule.
- Event ID (NDR).
- Asset ID (NDR).
- In the drop-down list on the right, select one of the following alert filtering operators:
- Contain
- Not contain
- Equal to
- Not equal to
- In the text box, enter one or several characters of alert information.
- To add a filter condition using a different criterion, click and specify the filter condition.
- Click Apply.
The table of alerts displays only alerts matching the filter criteria you have set.
Filtering and searching alerts by source address
You can filter alerts and search the alerts table for specific alerts based on the Source criterion, which indicates the alert source address. For example, this can be the email address from which a malicious file was sent, or the IP address of the computer on your corporate LAN to which a malicious file was downloaded.
To filter or search alerts by source address:
- Select the Alerts section in the window of the application web interface.
This opens the table of alerts.
- Click the Source link to open the filter configuration window.
- In the drop-down list, select one of the following alert filtering operators:
- Contain
- Not contain
- Matches
- Not matches
- In the text box, type one or more characters of the source address of the detected object.
- To add a filter condition using a different criterion, click and specify the filter condition.
- Click Apply.
The table of alerts displays only alerts matching the filter criteria you have set.
Filtering and searching alerts by destination address
You can filter alerts and search the alerts table for specific alerts based on the Destination criterion, which indicates the alert destination address. For example, this can be the email address of your organization's mail domain to which a malicious file was sent, or the IP address of a computer on your corporate LAN to which a malicious file was downloaded.
To filter or search alerts by destination address:
- Select the Alerts section in the window of the application web interface.
This opens the table of alerts.
- Click the Destination link to open the filter configuration window.
- In the drop-down list, select one of the following alert filtering operators:
- Contain
- Not contain
- Matches
- Not matches
- In the text box, type one or more characters of the destination address of the detected objects.
- To add a filter condition using a different criterion, click and specify the filter condition.
- Click Apply.
The table of alerts displays only alerts matching the filter criteria you have set.
Filtering and searching alerts by server name
You can filter alerts and search for alerts in the alerts table based on the Servers criterion, which indicates the name of servers that created the alert.
If you are using the distributed solution and multitenancy mode, servers belong to the tenant that you are managing in the application web interface. Filtering is available only on the PCN.
To filter or search alerts by server name:
- Select the Alerts section in the window of the application web interface.
This opens the table of alerts.
- Click Servers to expand the list of servers on which alerts were created.
- Select check boxes next to one or multiple server names.
- Click Apply.
The table of alerts displays only alerts matching the filter criteria you have set.
Filtering and searching alerts by technology name
You can filter alerts and search the alerts table for specific alerts based on the Technologies criterion, which indicates the names of application modules or components that created the alert.
To filter alerts by technology name:
- Select the Alerts section in the window of the application web interface.
This opens the table of alerts.
- Click the Technologies link to open the filter configuration window.
- In the drop-down list, select one of the following alert filtering operators:
- Contain if you want the application to display alerts generated by the specified application module or component.
- Not contain if you want the application to hide alerts generated by the specified application module or component.
- Equal to if you want the application to display alerts generated by the specified application module or component.
- Not equal to if you want the application to hide alerts generated by the specified application module or component.
- In the drop-down list to the right of the alert filtering operator that you have selected, select the name of the technology which you want to filter alerts:
- (YARA) YARA.
- (SB) Sandbox.
- (URL) URL Reputation.
- (IDS) Intrusion Detection System.
- (AM) Anti-Malware Engine.
- (TAA) Targeted Attack Analyzer.
- (IOC) IOC.
- (NDR: IDS) Intrusion Detection System.
- (NDR: EA) External Analysis.
For example, if you want the application to display alerts generated as a result of scanning by the Sandbox component, select the Contain filtering operator and the name of the (SB) Sandbox component.
- To add a filter condition using a different criterion, click and specify the filter condition.
- Click Apply.
The table of alerts displays only alerts matching the filter criteria you have set.
Filtering and searching alerts by the status of their processing by the user
You can filter alerts and search for them in the table of alerts based on the State criterion—alert status depending on whether or not this alert has been processed by the Kaspersky Anti Targeted Attack Platform user.
To filter or search alerts by the status of their processing by the Kaspersky Anti Targeted Attack Platform user:
- Select the Alerts section in the window of the application web interface.
This opens the table of alerts.
- To include processed alerts in the filter, turn on the Processed switch in the upper right corner of the window.
- Click the State link to open a list of possible alert options depending on the status of their processing by the Kaspersky Anti Targeted Attack Platform user.
- Select one of the following values:
- New if you want the application to display new alerts that are not being processed by any user yet.
- In process if you want the application to display alerts that a user of Kaspersky Anti Targeted Attack Platform is already processing.
- Rescan if you want the application to display alerts that resulted from a rescan.
- Click Apply.
The table of alerts displays only alerts matching the filter criteria you have set.
Filtering and searching alerts by the name of the user to which they are assigned
You can filter or find alerts in the alert table by the Assigned to attribute, that is, the name of the user to which the alert is assigned.
To filter or find alerts by the name of the user to which they are assigned:
- Select the Alerts section in the window of the application web interface.
This opens the table of alerts.
- Click the Assigned to link to open the filter configuration window.
- Select the check box next to the name of the user that you need.
If you want to find a user name in the list, start typing the user name in the text box, then select the check box next to the found user name.
You can select multiple user names.
- Click Apply.
Only alerts assigned to the specified user are displayed in the alert table.
Page top
Sorting alerts in the table
You can sort alerts in the table by Created or Updated, Importance, Source, and State columns.
To sort alerts in the table of alerts:
- Select the Alerts section in the window of the application web interface.
This opens the table of alerts.
- If you want to sort the alerts by date, click one of the icons to the right of the Created (if the table is displaying alert creation dates) or Updated (if the table is displaying alert update dates) column header:
 to display newer alerts at the top of the table.
 to display older alerts at the top of the table.
- If you want to sort the alerts by the level of importance, to the right of the icon, click one of the following icons:
- to display high importance alerts at the top of the table.
- to display low importance alerts at the top of the table.
- If you want to sort alerts by the address of the source of the detected object, click one of the icons to the right of the Source column header:
- to sort alphabetically, A–Z.
- to sort alphabetically, Z–A.
- If you want to sort alerts by the state of processing by the user, click one of the icons to the right of the State column header:
- to sort alerts in order of processing New - Rescan - In process - Closed.
- to sort alerts in order of processing Closed - In process - Rescan - New.
Quickly creating an alert filter
To quickly create an alert filter:
- Select the Alerts section in the window of the application web interface.
This opens the table of alerts.
- Do the following to quickly add filter conditions to the filter being created:
- Position the mouse cursor on the link containing the table column value that you want to add as a filter condition.
- Left-click it.
This opens a list of actions to perform on the value.
- In the list that opens, select one of the following actions:
- Filter by this value, if you want to include this value in the filter condition.
- Exclude from filter, if you want to exclude the value from the filter condition.
- If you want to add several filter conditions to the filter being created, perform the actions to quickly add each filter condition to the filter being created.
The table of alerts displays only alerts matching the filter criteria you have set.
Saving filters
You can save the set of filters to the alert table.
To save applied filters:
- Select the Alerts section in the window of the application web interface.
This opens the table of alerts.
- Configure filtering settings for one or more columns of the table.
- Click Saved filters and select Save current filter.
The filter is saved with the default name that contains the selected filtering settings.
- If you want to rename a saved filter:
- Click Saved filters.
The list of saved filters is displayed.
- Hover over a filter and click .
- Rename the filter and click .
- Click Saved filters.
The filter is saved.
Page top
Resetting the alert filter
To clear the alert filter for one or more filtering criteria:
- Select the Alerts section in the window of the application web interface.
This opens the table of alerts.
- Click to the right of the header of the alerts table column for which you want to clear the filter conditions.
If you want to clear several filter conditions, perform the necessary actions to clear each filter condition.
The selected filters are cleared.
The table of alerts displays only alerts matching the filter criteria you have set.
Recommendations for processing alerts
Information about alerts produced by AM (Anti-Malware Engine), SB (Sandbox), YARA, IOC,IDS (Intrusion Detection System), NDR: IDS, and NDR: EA technologies that is displayed in the right part of the window includes recommendations on processing these alerts.
To view alert details:
- Select the Alerts section in the window of the application web interface.
This opens the table of alerts.
- Click the line containing the alert whose information you want to view.
This opens a window containing information about the alert.
Recommendations for processing AM alerts
In the right part of the window, the Recommendations section displays recommendations that you can follow, as well as the number of alerts or events that have attributes in common with the alert you are working on.
You can follow the following recommendations:
- Under Qualifying, expand the Find similar alerts list.
A list of attributes is displayed that can be used to find similar alerts, and the number of similar alerts for each attribute.
Select one of the following attributes:
- By MD5. Click the link to display the Alerts alert table in a new browser tab. The alerts are filtered by the Details column, the MD5 hash. The MD5 hash of the file from the alert you are working on is highlighted in yellow.
- By SHA256. Click the link to display the Alerts alert table in a new browser tab. The alerts are filtered by the Details column, the SHA256 hash. The SHA256 hash of the file from the alert you are working on is highlighted in yellow.
- By host name. Click the link to display the Alerts alert table in a new browser tab. The alerts are filtered by the Source column. The host name from the alert you are working on is highlighted in yellow.
- By sender address. Click the link to display the Alerts alert table in a new browser tab. The alerts are filtered by the Source column. The sender address of the email message from the alert you are working on is highlighted in yellow.
- By recipient address. Click the link to display the Alerts alert table in a new browser tab. The alerts are filtered by the Destination column. The recipient address of the email message from the alert you are working on is highlighted in yellow.
- By URL. Click the link to display the Alerts alert table in a new browser tab. The alerts are filtered by the Details column, the URL from the alert you are working on.
- Under Qualifying, select Find similar events. Click the link to display the Threat Hunting event table in a new browser tab. In the search criteria, the Detection processing result event type is selected and a search filter is configured, for example, by RemoteIP, MD5, SHA256, URI. The filtering values are populated with the properties of the alert you are working on. For example, the MD5 hash of the file in the alert.
The action is only available if you are using
and a KEDR license key has been added. - Under Investigation, select Find similar events. Click the link to display the Threat Hunting event table in a new browser tab. In the search criteria, a search filter is configured, for example, by RemoteIP, MD5, SHA256, URI. The filtering values are populated with the properties of the alert you are working on. For example, the MD5 hash of the file in the alert.
The action is only available if you are using KEDR functionality and a KEDR license key has been added.
Recommendations for processing TAA alerts
In the right part of the window, the Recommendations section displays recommendations that you can follow, as well as the number of alerts or events that have attributes in common with the alert you are working on.
You can follow the following recommendations:
- Under Qualifying, expand the Find similar alerts list.
A list of attributes is displayed that can be used to find similar alerts, and the number of similar alerts for each attribute.
Select one of the following attributes:
- By rule name (TAA alerts). Clicking the link opens the Alerts alert table in a new browser tab; the alerts are filtered by Detected and Technologies columns, that is, the name of the TAA (IOA) rule that was used to create the alert, and the name of the (TAA) Targeted Attack Analyzer technology.
- By rule name (SB alerts). Clicking the link opens the Alerts alert table in a new browser tab; the alerts are filtered by Detected and Technologies columns, that is, the name of the TAA (IOA) rule that was used to create the alert, and the name of the (SB) Sandbox technology.
- Under Investigation, select Find similar events. Click the link to display the Threat Hunting event table in a new browser tab. In the search criteria, a search filter is configured, for example, by RemoteIP, MD5, SHA256, URI. The filtering values are populated with the properties of the alert you are working on. For example, the MD5 hash of the file in the alert.
The action is only available if you are using KEDR functionality and a KEDR license key has been added.
Recommendations for processing SB alerts
In the right part of the window, the Recommendations section displays recommendations that you can follow, as well as the number of alerts or events that have attributes in common with the alert you are working on.
You can follow the following recommendations:
- Under Qualifying, expand the Find similar alerts list.
A list of attributes is displayed that can be used to find similar alerts, and the number of similar alerts for each attribute.
Select one of the following attributes:
- By MD5. Click the link to display the Alerts alert table in a new browser tab. The alerts are filtered by the Details column, the MD5 hash. The MD5 hash of the file from the alert you are working on is highlighted in yellow.
- By SHA256. Click the link to display the Alerts alert table in a new browser tab. The alerts are filtered by the Details column, the SHA256 hash. The SHA256 hash of the file from the alert you are working on is highlighted in yellow.
- By host name. Click the link to display the Alerts alert table in a new browser tab. The alerts are filtered by the Source column. The host name from the alert you are working on is highlighted in yellow.
- By sender address. Click the link to display the Alerts alert table in a new browser tab. The alerts are filtered by the Source column. The sender address of the email message from the alert you are working on is highlighted in yellow.
- By recipient address. Click the link to display the Alerts alert table in a new browser tab. The alerts are filtered by the Destination column. The recipient address of the email message from the alert you are working on is highlighted in yellow.
- By URL. Click the link to display the Alerts alert table in a new browser tab. The alerts are filtered by the Details column, the URL from the alert you are working on.
- By URL from Sandbox. Click the link to display the Alerts table in a new browser tab. The alerts are filtered by the Details column, that is, the URL address from the alert you are working on, as well as all URLs that were found to be relevant by the Sandbox component as the alert was processed.
- Under Qualifying, select Find similar EPP events. Click the link to display the Threat Hunting event table in a new browser tab. In the search criteria, the Detection processing result event type is selected and a search filter is configured, for example, by RemoteIP, MD5, SHA256, URI. The filtering values are populated with the properties of the alert you are working on. For example, the MD5 hash of the file in the alert.
The action is only available if you are using KEDR functionality and a KEDR license key has been added.
- Under Investigation, select Find similar events. Click the link to display the Threat Hunting event table in a new browser tab. In the search criteria, a search filter is configured, for example, by RemoteIP, MD5, SHA256, URI. The filtering values are populated with the properties of the alert you are working on. For example, the MD5 hash of the file in the alert.
The action is only available if you are using KEDR functionality and a KEDR license key has been added.
Recommendations for processing IOC alerts
In the right part of the window, the Recommendations section displays recommendations that you can follow, as well as the number of alerts that have attributes in common with the alert you are working on.
You can follow the following recommendations:
- Under Qualifying, select Find similar alerts by host name. Click the link to display the Alerts alert table in a new browser tab. The alerts are filtered by the Source column. The host name from the alert you are working on is highlighted in yellow.
- Under Qualifying, select Find similar alerts by IOC. Click the link to display the Alerts alert table in a new browser tab. The alerts are filtered by the Detected column, the name of the IOC file from the alert you are working on.
- In the Quick response section, select Isolate <host name>. This opens the network isolation rule creation window.
Recommendations for processing YARA alerts
In the right part of the window, the Recommendations section displays recommendations that you can follow, as well as the number of alerts or events that have attributes in common with the alert you are working on.
You can follow the following recommendations:
- Under Qualifying, expand the Find similar alerts list.
A list of attributes is displayed that can be used to find similar alerts, and the number of similar alerts for each attribute.
Select one of the following attributes:
- By MD5. Click the link to display the Alerts alert table in a new browser tab. The alerts are filtered by the Details column, the MD5 hash. The MD5 hash of the file from the alert you are working on is highlighted in yellow.
- By SHA256. Click the link to display the Alerts alert table in a new browser tab. The alerts are filtered by the Details column, the SHA256 hash. The SHA256 hash of the file from the alert you are working on is highlighted in yellow.
- By host name. Click the link to display the Alerts alert table in a new browser tab. The alerts are filtered by the Source column. The host name from the alert you are working on is highlighted in yellow.
- By sender address. Click the link to display the Alerts alert table in a new browser tab. The alerts are filtered by the Source column. The sender address of the email message from the alert you are working on is highlighted in yellow.
- By recipient address. Click the link to display the Alerts alert table in a new browser tab. The alerts are filtered by the Destination column. The recipient address of the email message from the alert you are working on is highlighted in yellow.
- By URL. Click the link to display the Alerts alert table in a new browser tab. The alerts are filtered by the Details column, the URL from the alert you are working on.
- Under Qualifying, select Find similar alerts by host name. Click the link to display the Threat Hunting event table in a new browser tab. In the search criteria, the Detection processing result event type is selected and a search filter is configured, for example, by RemoteIP, MD5, SHA256, URI. The filtering values are populated with the properties of the alert you are working on. For example, the MD5 hash of the file in the alert.
The action is only available if you are using KEDR functionality and a KEDR license key has been added.
- Under Investigation, select Find similar events. Click the link to display the Threat Hunting event table in a new browser tab. In the search criteria, a search filter is configured, for example, by RemoteIP, MD5, SHA256, URI. The filtering values are populated with the properties of the alert you are working on. For example, the MD5 hash of the file in the alert.
The action is only available if you are using KEDR functionality and a KEDR license key has been added.
- In the Quick response section, select Isolate <host name>. This opens the network isolation rule creation window.
Recommendations for processing IDS alerts
In the right part of the window, the Recommendations section displays recommendations that you can follow, as well as the number of alerts or events that have attributes in common with the alert you are working on.
You can follow the following recommendations:
- Under Qualifying, select Find similar alerts by IP address. Click the link to display the Alerts alert table in a new browser tab. The alerts are filtered by the Source column. The host name or IP address from the alert you are working on is highlighted in yellow.
- Under Qualifying, select Find similar alerts by URL. Click the link to display the Alerts alert table in a new browser tab. The alerts are filtered by the Details column, the URL. The URL from the alert you are working on is highlighted in yellow.
- Under Qualifying, select Add to exclusions.
This opens the Add IDS rule to exclusions window. If you want to add an IDS rule that was used to create the alert to exclusions, enter a comment in the Description field and click Add.
The IDS rule is added to exclusions and is displayed in the exclusion list in the Settings section, Exclusions subsection on the IDS tab in the application web interface.
- Under Investigation, select Find similar events by URL. Click the link to display the Threat Hunting event table in a new browser tab. In the search criteria, the search filter is configured to use the URI from the alert you are working on.
- Under Investigation, select Find similar events by IP address. Click the link to display the Threat Hunting event table in a new browser tab. In the search criteria, the search filter is configured to use the RemoteIP from the alert you are working on.
- In the Investigation section, click Download IDS artifact to download the file with alert data.
- In the Investigation section, click Download PCAP file to download the file with intercepted traffic data.
Recommendations for processing NDR:IDS and NDR:EA alerts
In the right part of the window, the Recommendations section displays recommendations that you can follow, as well as the number of alerts or events that have attributes in common with the alert you are working on.
You can follow the following recommendations:
- Under Qualifying, select Find similar alerts by source IP. Click the link to display the Alerts alert table in a new browser tab. The alerts are filtered by the Source column. The host name or IP address from the alert you are working on is highlighted in yellow.
- Under Qualifying, select Find similar alerts by destination IP. Click the link to display the Alerts alert table in a new browser tab. The alerts are filtered by the Destination column. The host name or IP address from the alert you are working on is highlighted in yellow.
- Under Qualifying, select Find similar events by URL. Click the link to display the Alerts alert table in a new browser tab. The alerts are filtered by the Details column. The URL from the alert you are working on is highlighted in yellow.
- Under Qualifying, select Find similar alerts by intrusion detection rule. Click the link to display the Alerts alert table in a new browser tab. The alerts are filtered by the Details column. The scan result from the alert you are working on is highlighted in yellow.
- In the Download section, click Download PCAP file to download the file with intercepted traffic data.
Viewing alerts
The web interface of Kaspersky Anti Targeted Attack Platform displays the following types of alerts that the user should keep track of:
- A file has been downloaded or an attempt was made to download a file to a corporate LAN computer. The application detected this file in mirrored traffic on the organization's local network or in ICAP data of HTTP and FTP traffic, as well as HTTPS traffic if the administrator has configured SSL certificate replacement on the proxy server.
- A file has been sent to the email address of a user on the corporate LAN. The application detected this file in copies of email messages received via the POP3 or SMTP protocol, or received from the virtual machine or server with Kaspersky Secure Mail Gateway if it is being used in your organization.
- A website link was opened on a corporate LAN computer. The application detected this website link in mirrored traffic on the organization's local network or in ICAP data of HTTP and FTP traffic, as well as HTTPS traffic if the administrator has configured SSL certificate replacement on the proxy server.
- Network activity has occurred in which the IP address or domain name of a corporate LAN computer was detected. The application detected this network activity in mirrored traffic on the organization's local network.
- Processes have been started on a corporate LAN computer. The application detected the processes using the Endpoint Agent component installed on computers belonging to the corporate IT infrastructure.
If a file was detected, the following information may be displayed in the application web interface depending on which application modules or components generated the alert:
- General information about the alert and the detected file (for example, the IP address of the computer on which the file was detected, and the name of the detected file).
- Results of the virus scan of the file performed by AM Engine.
- Results of scanning the file for signs of intrusion into the corporate IT infrastructure, performed by the YARA module.
- Results of the file behavior analysis performed by the Sandbox component.
- Results of analysis of APK executable files in the cloud infrastructure using machine learning technology.
If a website link was detected, the following information may be displayed in the application web interface depending on which application modules or components generated the alert:
- General information about the alert and the detected website link (for example, the IP address of the computer on which the website link was detected, and the address of the website link).
- Results of the link scan performed by the URL Reputation module for detecting of signs of malware, phishing URL addresses and URL addresses previously used by hackers for targeted attacks on the corporate IT infrastructure.
If the application detects network activity of the IP address or domain name of a computer on a corporate LAN, the application web interface may display the following information:
- Details of the alert and detected network activity.
- Results of web traffic scanning for signs of intrusion into the corporate IT infrastructure according to preset rules, performed by the Intrusion Detection System module (IDS).
- Results of network activity scanning performed using Kaspersky TAA (IOA) rules.
- Results of network activity scanning performed using TAA (IOA), IDS, IOC user rules.
If the application detects processes running on a corporate LAN computer where the Endpoint Agent component is installed, the application web interface can display the following information:
- General information about the alert and processes running on the computer.
- Results of network activity scanning performed for the computer using Kaspersky TAA (IOA) rules.
- Results of network activity scanning performed for the computer using TAA (IOA), IOC user rules.
Alerts can be managed by users with the following roles: Security officer and Senior security officer. Users with the Security auditor role can view alerts.
Viewing alert details
To view alert details:
- Select the Alerts section in the window of the application web interface.
This opens the table of alerts.
- Click the line containing the alert whose information you want to view.
This opens a window containing information about the alert.
General information about an alert of any type
The title of the alert details window displays the alert ID. The ![]() or
or ![]() icon will be displayed next to the status depending on whether the alert has VIP status.
icon will be displayed next to the status depending on whether the alert has VIP status.
The upper part of the window containing alert information may display the following general information about the alert:
- State—Alert status depending on whether or not this alert has been processed by the user of Kaspersky Anti Targeted Attack Platform.
- Importance—Alert importance for the Kaspersky Anti Targeted Attack Platform user depending on the impact this alert may have on computer or corporate LAN security based on Kaspersky experience.
- Server is the name of the server where the detection was generated. Servers belong to the organization you are managing in the application web interface. This column is displayed if you are using the distributed solution and multitenancy mode.
- Host—Domain name of the computer where the alert occurred.
- Data source—Source of the data. For example, SMTP Sensor or SPAN Sensor.
- Time created is the time when the alert was created.
- Time updated is the time when the alert details were updated.
You can configure email notifications about new alerts.
Information in the Object information section
The Object information section can display the following event information about the detected object:
- File name.
To expand the Copy value to clipboard action, click the link with the file name.
- File type. For example: ExecutableWin32.
The Find on Kaspersky TIP button allows to find a file on the
.Click Create prevention rule to prevent the file from running.
Click Download to download the file to your computer's hard drive.
The file is downloaded in the form of a ZIP archive encrypted with the password "infected". The name of the file inside the archive is replaced by the file's MD5 hash. The file extension of file inside the archive is not displayed.
- File size in kilobytes.
- MD5—MD5 hash of a file.
Clicking the link with MD5 opens a list in which you can select one of the following actions:
- Find on Kaspersky TIP.
- Find events.
- Find alerts.
- Create prevention rule.
- Copy value to clipboard.
- SHA256—SHA256 hash of a file.
Clicking the SHA256 link opens a list in which you can select one of the following actions:
- Find on Kaspersky TIP.
- Find on virustotal.com.
- Find events.
- Find alerts.
- Create prevention rule.
- Copy value to clipboard.
- Sender's email address—Email address from which the message containing the file was sent.
- Recipient's email address—One or more email addresses to which the message containing the file was sent.
- Original sender email address—Source email address from which the message containing the file was sent.
This field is populated with data from the 'Received' header.
- Original recipient email address—Source email address(es) to which the message containing the file was sent.
This field is populated with data from the 'Received' header.
- Subject—Message subject.
- Sender server IP —IP address of the first mail server in the message delivery chain.
Clicking the Sender server IP link with opens a list in which you can select one of the following actions:
- Find events.
- Find alerts.
- Copy value to clipboard.
- Headers—Extended set of email message headers. For example, it can contain information about email addresses of the message sender and recipients, about mail servers that relayed the message, and the type of content in the email message.
Information in the Alert details section
The Alert details section can display the following information about an alert:
- , or —Alert importance for the Kaspersky Anti Targeted Attack Platform user depending on the impact this alert may have on computer or corporate LAN security based on Kaspersky experience.
- Time is the time when the alert was created.
- Detected—One or multiple categories of detected objects. For example, when the application detects a file infected with the Trojan-Downloader.JS.Cryptoload.ad virus, the Detected field shows the Trojan-Downloader.JS.Cryptoload.ad category for this alert.
- Method—HTTP request method. For example, Get, Post, or Connect.
- URL—Detected URL. It may also contain a response code.
Clicking the link with URL opens a list in which you can select one of the following actions:
- Find on Kaspersky TIP by URL.
- Find on Kaspersky TIP by domain name.
- Find events.
- Find alerts.
- Copy value to clipboard.
- Referer—URL from which the user was redirected to the website link requiring attention. In the HTTP protocol, it is one of the headers in the client's request containing the request source URL.
- Destination IP—IP address of the resource requested by the user or the application.
Clicking the link with Destination IP opens a list in which you can select one of the following actions:
- Find on Kaspersky TIP.
- Find events.
- Find alerts.
- Copy value to clipboard.
- User name—Name of the user account whose actions led to the event.
- Request/Response—Length of the request and response.
Information in the Information about scanning using NDR technologies section
The Information about scanning using NDR technologies section can display the following results:
- Monitoring point: the name of the monitoring point whose traffic was the reason for the registration of a network traffic event and the creation of an alert.
- Network interface ID: the ID of the monitoring point whose traffic was the reason for the registration of a network traffic event and the creation of an alert.
Information in the Scan results section
The Scan results section can display the following results:
- The names of the application modules or components that generated the alert.
- One or multiple categories of the detected object. For example, the name of the virus can be shown: Virus.Win32.Chiton.i.
- Versions of databases of Kaspersky Anti Targeted Attack Platform modules and components that generated the alert.
- Results of alert scanning by application modules and components:
- YARA—Results of streaming scans of files and objects received at the Central Node, or results of scanning hosts with the Endpoint Agent component. Possible values:
- Category of the detected file in YARA rules (for example, category name susp_fake_Microsoft_signer can be displayed).
Displayed for streaming scans.
Click Create prevention rule to prevent the file from running.
The Find on Kaspersky TIP button allows to find a file on the Kaspersky Threat Intelligence Portal.
- Path to the file and/or name of the memory dump.
Displayed when scanning hosts with the Kaspersky Endpoint Agent component.
Clicking the link with the file path opens a list in which you can select one of the following actions:
- Find events.
- Find alerts.
- Copy value to clipboard.
You can click Create task to create the following tasks:
- Get data → File, Disk image, Memory dump.
- Delete file.
- Quarantine file.
Click Create prevention rule to prevent the file from running.
- Category of the detected file in YARA rules (for example, category name susp_fake_Microsoft_signer can be displayed).
- The Find on Kaspersky TIP button allows to find a file on the Kaspersky Threat Intelligence Portal.
You can click View in quarantine to display quarantined object details.
- SB (Sandbox)—Results of the file behavior analysis performed by the Sandbox component.
You can click Sandbox detection to open a window with detailed information about the results of file behavior analysis.
The Find on Kaspersky TIP button allows to find a file on the Kaspersky Threat Intelligence Portal.
Click Create prevention rule to prevent the file from running.
You can download a detailed log of file behavior analysis in all operating systems by clicking Download debug info.
The file is downloaded in the form of a ZIP archive encrypted with the password "infected". The name of the scanned file inside the archive is replaced by the file's MD5 hash. The file extension of file inside the archive is not displayed.
By default, the maximum hard drive space for storing file behavior scan logs is 300 GB in all operating systems. Upon reaching this limit, the application deletes the oldest file behavior scan logs and replaces them with new logs.
- URL (URL Reputation) is the category of a malicious, phishing URL or an URL that has been previously used by attackers for targeted attacks on corporate IT infrastructures.
- IDS (Intrusion Detection System) is the category of the detected object based on the Intrusion Detection System database or the name of the IDS user rule that was used to create the alert. For example, the displayed category can be Trojan-Clicker.Win32.Cycler.a.
Click the link to display the category of the object in the Kaspersky Threats database.
- AM (Anti-Malware Engine)—Category of the detected object based on the anti-virus database. For example, the name of the virus can be shown: Virus.Win32.Chiton.i.
Click the link to display the category of the object in the Kaspersky Threats database.
The Find on Kaspersky TIP button allows to find a file on the Kaspersky Threat Intelligence Portal.
Click Create prevention rule to prevent the file from running.
Click Download to download the file to your computer's hard drive.
- TAA (Targeted Attack Analyzer)—Information about the results of file analysis using the Targeted Attack Analyzer technology: name of the TAA (IOA) rule that was used to create the alert.
Click the link to display information about the TAA (IOA) rule. If the rule was provided by Kaspersky experts, it contains information about the triggered
as well as recommendations for reacting to the event. - IOC—Name of the IOC file used to create the alert.
Select an IOC file to open a window with the results of the IOC scan.
Click All events related to the alert to display the Threat Hunting event table in a new browser tab. A search filter is configured in the search criteria, for example, by MD5, FileFullName. The filtering values are populated with the properties of the alert you are working on. For example, the MD5 hash of the file in the alert.
- YARA—Results of streaming scans of files and objects received at the Central Node, or results of scanning hosts with the Endpoint Agent component. Possible values:
- NDR: IDS is the reason of the alert. Corresponds to the name of the network traffic event that caused the alert to be created. Such NDR events are registered using the IDS technology and are associated with the detection of anomalies in traffic that are indicators of attack (for example, an event based on the detection of ARP spoofing indicators).
- NDR: EA (External Analysis) is the reason why the alert was created. Event received from an external system using the Kaspersky Anti Targeted Attack Platform API NDR. When the event is registered, the title and description are determined by the external system. The event is registered using the EXT technology.
Information in the IDS rule section
The IDS rule section displays information about the alert made by the IDS (Intrusion Detection System) technology as a hex-editor matrix.
The hex-editor or hexadecimal editor is an application for editing data where data is represented as a sequence of bytes.
The upper part of the matrix displays the length of the IDS rule.
The left part of the matrix displays the data of the rule in text format.
The Rule details subsection of the IDS rule section displays the header of the IDS rule and data of the IDS alert in the Suricata format. For example, it can display information about the direction of the traffic (flow), the HTTP request method (http_method), the HTTP header (http_header), the security ID (sid).
Information in the URL section
Under URL, the URL that triggered the alert is displayed.
Clicking the URL link opens a list in which you can select one of the following actions:
- Find events.
- Find alerts.
- Find on Kaspersky TIP by URL.
- Find on Kaspersky TIP by domain name.
- Copy value to clipboard.
Information in the IP addresses of detection-related devices section
Under IP addresses of alert-related devices, information about devices associated with the alert is displayed:
- Protocol.
- Source IP.
- Source MAC.
- Destination IP.
- Destination MAC.
Information in the Network event section
The Network event section can show the following information about the link to the website opened on the computer:
- Date and Time—Date and time of the network event.
- Method—Type of HTTP request, for example, GET or POST.
- Source IP—IP address of the computer on which the website link was opened.
- Destination IP—IP address of the computer on which the website link was opened.
- URL—Type of the HTTP request, for example, GET or POST, and the URL of the website.
If the alert is created for a file extracted from traffic, the URL specifies the protocol used to transmit the traffic from which the file was extracted. Possible protocols: HTTP, HTTPS, FTP, SMTP, POP3, SMB, NFS.
Clicking the link with the URL opens a list in which you can select one of the following actions:
- Find on Kaspersky TIP by URL.
- Find on Kaspersky TIP by domain name.
- Find events.
- Find alerts.
- Copy value to clipboard.
- User Agent—Information about the browser that was used to download the file or to attempt to download the file, or to open the website link. It is the text string included in the HTTP request, which normally contains the name and version of the browser as well as the name and version of the operating system installed on the user's computer.
Scan results in Sandbox
The object scan results window in Sandbox can display the following alert details:
- File—Full name and path of the scanned file.
- File size—Size of the file.
- MD5—MD5 hash of a file.
- Clicking the link with MD5 opens a list in which you can select one of the following actions:
- Find on Kaspersky TIP.
- Find events.
- Find alerts.
- Create prevention rule.
- Copy value to clipboard.
- Detected—One or multiple categories of detected objects. For example, when the application detects a file infected with the Trojan-Downloader.JS.Cryptoload.ad virus, the Detected field shows the Trojan-Downloader.JS.Cryptoload.ad category for this alert.
- Time processed—Time when the file was scanned.
- Database versions—Versions of the databases of modules and components of Kaspersky Anti Targeted Attack Platform that created the alert.
You can click New prevention rule in the upper right corner of the window to prevent the file from running.
Information about the file behavior analysis results is provided for each operating system in which the Sandbox component performed a scan. For the Windows 7 operating system (64-bit), you can view file activity logs for two Sandbox component scan modes: Quick scan mode and Full logging mode.
The following activity logs may be available for each scan mode:
- Activity list—Actions of the file within the operating system.
- Activity tree—Graphical representation of the file analysis process.
- HTTP activity log—Log of the file's HTTP activity. It contains the following information:
- Destination IP—IP address to which the file is attempting to go from the operating system.
- Method—HTTP request method, for example, GET or POST.
- URL—URL of the website link that the file is attempting to open from the operating system.
Clicking links in the Destination IP column opens a list in which you can select one of the following actions:
- Find on Kaspersky TIP.
- Find events.
- Find alerts.
- Copy value to clipboard.
Clicking a link in the URL column opens a list in which you can select one of the following actions:
- Find on Kaspersky TIP by URL.
- Find on Kaspersky TIP by domain name.
- Find events.
- Find alerts.
- Copy value to clipboard.
- IDS activity log—Log of the file's network activity. It contains the following information:
- Source IP—IP address of the host on which the file is saved.
- Destination IP—IP address to which the file is attempting to go from the operating system.
- Method—HTTP request method, for example, GET or POST.
- URL—URL of the website link that the file is attempting to open from the operating system.
Clicking links in the Destination IP column opens a list in which you can select one of the following actions:
- Find on Kaspersky TIP.
- Find events.
- Find alerts.
- Copy value to clipboard.
Clicking a link in the URL column opens a list in which you can select one of the following actions:
- Find on Kaspersky TIP by URL.
- Find on Kaspersky TIP by domain name.
- Find events.
- Find alerts.
- Copy value to clipboard.
- DNS activity log—Log of the file's DNS activity. It contains the following information:
- Request type (Request or Response).
- DNS name—Domain name of the server.
- Type—Type of DNS request, for example A or CNAME.
- Host—Host name or IP address that was interacted with.
Clicking a link in the DNS name or Host columns opens a list in which you can select one of the following actions:
- Find on Kaspersky TIP.
- Find events.
- Find alerts.
- Copy value to clipboard.
- Screenshots—Contains screenshots taken during the execution of the file.
You can view the screenshots in the application web interface or download a Zip archive containing the screenshots.
You can click Download full log in the lower part of each scanning mode (Quick scan mode and Full logging mode) to download the log of file behavior analysis in each operating system to your computer
IOC scan results
Depending on the type of processed object, the indicator of compromise search result window can display the following information:
- ARP protocol:
- IP address from the ARP table.
- Physical address from the ARP table.
- DNS record:
- Type and name of the DNS record.
- IP address of the protected computer.
- Windows Log event:
- Entry ID in the event log.
- Data source name in the log.
- Log name.
- User account.
- Event time.
- File:
- MD5 hash of the file.
- SHA256 hash of the file.
- Full name of the file (including path).
- File size.
- Port:
- Remote IP address with which a connection was established at the time of the scan.
- Remote port with which a connection was established at the time of the scan.
- IP address of the local adapter.
- Port open on the local adapter.
- Protocol as a number (in accordance with the IANA standard).
- Process:
- Process name.
- Process arguments.
- Path to process file.
- Windows ID (PID) of the process.
- Windows ID (PID) of the parent process.
- Name of the user account that started the process.
- Date and time when the process started.
- Service:
- Service name.
- Service description.
- Path and name of the DLL service (for svchost).
- Path and name of the executable file of the service.
- Windows ID (PID) of the service.
- Service type (for example, kernel driver or adapter).
- Service status.
- Service run mode.
- User:
- User account name.
- Volume:
- Volume name.
- Volume letter.
- Volume type.
- Registry:
- Windows registry value.
- Registry hive value.
- Path to registry key (without hive or value name).
- Registry parameter.
- Environment variables:
- Physical (MAC) address of the protected computer.
- System (environment).
- OS name with version.
- Network name of the protected device.
- Domain and group to which the protected computer belongs.
The IOC section displays the structure of the IOC file. If the processed object matches a condition of the IOC rule, that condition is highlighted. If the processed object matches multiple conditions, the text of the whole branch is highlighted.
Information in the Hosts section
The Hosts section displays the following information about hosts on which the TAA (IOA) rule was triggered:
- Host name—IP address or domain name of the computer where the event occurred. Clicking the link opens the Threat Hunting section with the search condition containing the ID of the selected rule and the selected host.
- IP—IP address of the computer where the event occurred.
If you are using dynamic IP addresses, the field displays the IP address assigned to the computer at the moment when the alert was created or updated.
The application does not support IPv6. If you are using IPv6, the IP address of the computer is not displayed.
- Number of events—Number of events that occurred on the host.
- Find events. Clicking the link opens the Threat Hunting section with the search condition containing the ID of the selected rule.
Information in the Change log section
The Change log section can display the following detection information:
- Date and time of alert modification.
- Author of modifications.
For example, System or the application user name.
- Modification that occurred with the alert.
For example, an alert may be assigned to a VIP group, or it may be marked as processed.
Sending alert data
You can provide Kaspersky with data about an alert (except the URL Reputation and IOC technologies) for further analysis.
To do so, you must copy the alert data to the clipboard and then email it to Kaspersky.
Alert data may contain information about your organization that you consider to be confidential. You must consult with the security department of your organization for approval to send this data to Kaspersky for further analysis.
To copy alert details to the clipboard:
- Select the Alerts section in the window of the application web interface.
This opens the table of alerts.
- Click the line containing the alert whose information you want to view.
This opens a window containing information about the alert.
- Click the Provide the alert details to Kaspersky link in the lower part of the window containing alert information.
This opens the Show more window.
- View the alert data to be sent to Kaspersky.
- If you want to copy this data, click the Copy to clipboard button.
The alert data will be copied to the clipboard. You will be able to send it to Kaspersky for further analysis.
Viewing alert relations
From the alert card, you can go to the table of events, assets, or network sessions associated with this alert.
To view the relations of an alert:
- Select the Alerts section in the window of the application web interface.
This opens the table of alerts.
- Open the alert whose relations you want to view.
- In the alert card, click the arrow next to the Show related button.
- Select a relation of the alert from the list:
- Events.
- Assets.
- Network sessions.
This opens the corresponding section of the web interface with a table of relations.
Page top
User actions performed on alerts
When managing the application web interface using a Senior security officer or Security officer account, you can take the following actions on alerts:
- Assign an alert to yourself or to another user of the application web interface.
You can view all alerts assigned to a specific user by filtering alerts based on the status of their processing by the user.
- Mark the alert as processed.
You can view all alerts that have been processed by a specific user by filtering alerts based on the status of their processing by the user.
- Add a comment to an alert.
You can find commented alerts based on keywords within comments by filtering alerts based on received information.
- Mark the alert as .
This action is available only to users with the Senior security officer role. Users with this role can view all alerts with the VIP status by filtering alerts by VIP status.
Users with the Security auditor role can view information about alerts but cannot edit this information.
Assigning alerts to a specific user
Users with the Senior security officer role can assign an alert or multiple alerts to themselves or to another user of the application web interface with the Senior security officer or Security officer role.
To assign an alert to yourself or to another user of the application web interface:
- Select the Alerts section in the window of the application web interface.
This opens the table of alerts.
- Select the check boxes next to the alert or alerts that you want to assign to yourself or to another user.
You can select all alerts by selecting the check box in the table header.
- In the pane that is displayed in the lower part of the window, expand the list of users by clicking on the arrow to the right of the Assign to button.
- Select the user to whom you want to assign the alerts.
This opens the action confirmation window. You can also leave a comment that will be displayed in the alert change history.
- Click Proceed.
The alerts will be assigned to the selected user.
You can view all alerts assigned to a specific user by filtering alerts based on the status of their processing by the user.
Users with the Security auditor role cannot assign alerts to themselves or to other users of the application web interface. Users with the Senior security officer and Security officer roles also cannot assign alerts to users with the Security auditor role.
Users with the Senior security officer and Security officer roles, while managing an alert, can assign this alert to themselves or to another user of the application web interface with the Senior security officer or Security officer role.
To assign an alert to yourself or another user while managing the alert:
- Select the Alerts section in the window of the application web interface.
This opens the table of alerts.
- Open the alert that you want to assign to yourself or to another user of the application.
This opens the card of the alert.
- If you want to assign the alert to yourself, click Assign to @Me.
- If you want to assign the alert to another user of the application, click the arrow to the right of the Assign to button and select the user to which you want to assign the alert.
The alert is assigned to the selected user.
Page top
Marking the completion of single alert processing
Users with the Security auditor role cannot assign and process alerts.
To close an individual alert in the table of alerts:
- Select the Alerts section in the window of the application web interface.
This opens the table of alerts.
- In the State column of the alert that you want to close, click the status of the alert.
- In the list of actions, select Close alert.
The alert is closed.
To close an alert while managing the alert:
- Select the Alerts section in the window of the application web interface.
This opens the table of alerts.
- Open the alert that you want to close.
- In the upper-right corner of the window, click Close alert.
The alert is closed. If the alert was assigned to a different user, it is marked as processed by you.
You can view all alerts that have been processed by a specific user by filtering alerts based on the status of their processing by the user or by using the Show closed alerts toggle switch.
If an alert based on a scan using the TAA (IOA), IDS, or URL technology that is similar to a processed alert is received within the day (from 00:00 a.m. to 11:59 p.m.), the application either creates a new alert or updates the information in the identical alert with the New or In process status.
When you close an NDR alert, the aggregate event and nested NDR events associated with the alert are marked as resolved, and other alerts associated with these events are also closed. If a closed NDR alert is reopened, the associated closed NDR event is not reopened.
Page top
Marking the completion of alerts processing
Users with the Security officer role cannot perform bulk operations on alerts. Users with the Security auditor role cannot assign and process alerts.
To close one or more alerts:
- Select the Alerts section in the window of the application web interface.
This opens the table of alerts.
- Select the check boxes opposite those alerts that you want to close.
You can select all alerts by selecting the check box in the table header.
- In the pane that appears in the lower part of the window, click the Close alert button.
This opens the action confirmation window.
You can also leave a comment that will be displayed in the alert change history.
- Click Proceed.
The selected alerts are closed. If the alerts were assigned to other users, they are marked as closed by you.
You can view all closed alerts by filtering alerts based on the status of their processing by the user or by using the Show closed alerts toggle switch.
If an alert based on a scan using the TAA (IOA), IDS, or URL technology that is similar to a processed alert is received within the day (from 00:00 a.m. to 11:59 p.m.), the application either creates a new alert or updates the information in the identical alert with the New or In process status.
When you close an NDR alert, the aggregate event and nested NDR events associated with the alert are marked as resolved, and other alerts associated with these events are also closed. If a closed NDR alert is reopened, the associated closed NDR event is not reopened.
Page top
Modifying the status of VIP alerts
Users with the Senior security officer role can assign the VIP status to alerts or clear the VIP status of alerts.
To toggle the VIP status for alerts:
- Select the Alerts section in the window of the application web interface.
This opens the table of alerts.
- Select the check boxes for alerts for which you want to change the VIP status.
You can select all alerts by selecting the check box in the table header.
- Do one of the following:
- If you want to mark alerts as VIP, click the Mark as VIP button in the pane that appears in the lower part of the window.
- If you want to remove the VIP status from alerts, in the pane that is displayed in the lower part of the window, in the Mark as VIP drop-down list, select Mark as non-VIP.
This opens the action confirmation window.
You can also leave a comment that will be displayed in the alert change history.
- Click Proceed.
The VIP status of alerts is changed.
Users with the Senior security officer and Security auditor roles can view all events with the VIP status by filtering alerts by VIP status.
Page top
Adding a comment to an alert
Users with the Senior security officer and Security officer roles can add a comment to an alert.
To add a comment to an alert:
- Select the Alerts section in the window of the application web interface.
This opens the table of alerts.
- Select an alert for which you want to add a comment.
This opens a window containing information about the alert.
- In the comment field under the Change log section, enter a comment for the alert.
- Click Add.
The comment will be added to the alert and will be displayed in the Change log section of this alert.
You can find commented alerts based on keywords within comments by filtering alerts based on received information.
Users with the Security auditor role can view comments for alerts but cannot edit the comments.
Page top
Monitoring network traffic events
The application registers events when analyzing network traffic. Network traffic analysis is part of the NDR functionality.
A network traffic event (also referred to as an NDR event) is a record containing information about the detection of certain changes or conditions in network traffic that require the attention of an information security professional. NDR events are registered and sent to the Central Node. The server processes the received events and stores them in the database.
An aggregate event is a special type of event that is registered when a specific sequence of NDR events is received. Aggregate events group NDR events that have some common characteristics or are related to the same process.
The application registers aggregate events in accordance with event correlation rules. An event correlation rule describes the conditions for scanning sequences of events. When a sequence of NDR events is detected that matches the conditions of the rule, the application registers an aggregate event that mentions the name of the triggered rule. Aggregate events are registered with system event type code 8000000001.
Event correlation rules are built into the application and are applied independently of the security policy.
After the application is installed, the original event correlation rules are used. To improve the effectiveness of the rules, Kaspersky regularly updates the databases with rule sets. You can update correlation rules by installing updates.
The Kaspersky Anti Targeted Attack Platform server registers NDR events in accordance with the settings specified for registering event types. You can configure these settings in the Configure event types section.
To reduce the number of frequently repeated NDR events that do not require user attention, you can create allow rules for events. NDR events that match allow rules are not registered. For example, you can use an allow rule to temporarily disable the registration of all events from a specific monitoring point. You can view allow rules for events in the Settings section, Allow rules subsection. The EVT type is specified for such rules.
The application stores NDR events and aggregate events in a database on the Central Node. The total amount of stored records cannot exceed the configured limit. If the amount exceeds the limit, the application automatically deletes the oldest records. However, if a minimum storage duration is configured, the corresponding message is logged in the application message log when deleting records whose age is less than the minimum duration. You can configure the event and incident storage settings.
You can view information about NDR events and aggregate events in the Network traffic events section. This section displays detailed information about NDR events and aggregate events and allows loading information for any period from the server database.
Actions with network traffic events are available to users with the Security officer or Senior security officer role. Users with the Security auditor role can view events.
NDR events are generated if a valid KATA+NDR license key is present. After the license key expires, created events remain available for viewing, but related alerts are not created.
NDR event scores and severity levels
NDR events in Kaspersky Anti Targeted Attack Platform are scored on a scale from 0.0 to 10.0.
If an NDR event is associated with a device, the application takes into account the available information about the device when calculating the score. The importance level of the device and the risks associated with this device are taken into account.
The base score specified for the NDR event type in the table of event types is used as the baseline for calculating the score.
If an NDR event is not associated with a device, the score of the event is equal to the base score.
The score determines the severity level of the NDR event. Depending on the numerical value of the score, an NDR event can have one of the following severity levels:
- Low (scores 0.0–3.9)
Low-severity NDR events usually do not require immediate response.
- Medium (scores 4.0–7.9)
Medium-severity NDR events contain information that must be looked at. These events may require a response.
- High (scores 8.0–10.0)
High-severity NDR events contain information that can have critical impact. These events require an immediate response.
NDR event registration technologies
Kaspersky Anti Targeted Attack Platform registers NDR events using one of the following technologies:
- Intrusion Detection (IDS)
This technology registers NDR events related to the detection of anomalies in traffic that are indicators of attacks (for example, an NDR event can be registered indicators of ARP spoofing are detected).
- External (EXT)
This technology registers aggregate and nested NDR events that are received by the Kaspersky Anti Targeted Attack Platform from third-party systems using the methods of the Kaspersky Anti Targeted Attack Platform API.
- Asset Management (AM)
This technology registers NDR events involving the detection of information about devices in traffic or in data received from EPP applications (for example, an NDR event can be registered when a device is found to have a new IP address).
- Endpoint Protection Platform (EPP)
This technology registers NDR events for threats detected by Kaspersky applications that protect workstations and servers (for example, a malware detection event).
NDR event statuses
NDR event statuses allow the application to display the course of processing the received information by security officers.
The following statuses can be assigned to NDR events and aggregate events:
- New.
This status is assigned to all NDR and aggregate events when they are registered in Kaspersky Anti Targeted Attack Platform.
- In process.
You can assign this status to NDR events and aggregate events that are being processed (for example, during the investigation of the reasons why these events or incidents were registered).
- Resolved.
You can assign this status to NDR events and aggregate events that already have been processed (for example, the investigation of the reasons of their registration is closed).
After the Resolved status is assigned, the application ignores NDR events and aggregate events with this status when determining the security status of devices displayed in the table of device and on the network interactions map.
Statuses of NDR events and aggregate events must be changed manually. You can assign statuses sequentially in the order from New to Resolved. However, you can skip the In process status. After changing the status of an NDR event or aggregate event, you cannot re-assign one of the previous statuses.
If the Resolved status is assigned to an aggregate event, the status of all nested NDR events is automatically changed to Resolved, and the associated alerts are also closed.
If the Resolved status is assigned to an NDR event, aggregate events under which this NDR event is nested and the associated alerts are not closed.
Page top
Table of registered NDR events
You can view the table of registered NDR events and aggregate events in the Network traffic events section.
By default, the table of registered NDR events and aggregate events is updated in real time. At the top of the table, events with the most recent last-seen date and time values are displayed.
The last-seen date and time of an NDR or aggregate event may not be the same as the date and time of its registration. For an NDR event, the last-seen date and time may be updated during the regeneration period of that event type. For an aggregate event, the last-seen date and time is updated to match the last-seen date and time of nested NDR events.
Parameters of NDR events and aggregate events are displayed in the following columns of the table:
- Start.
For an NDR event, the date and time when the event was registered. For an aggregate event, the date and time when the first nested event was registered. You can view the date together with the time, or just the date or time by itself. To choose the information to display, select the check boxes opposite the Date and Time settings.
- Last seen
For an NDR event, the last-seen date and time of the NDR event. May contain the date and time of the event registration or the date and time when the event repetition counter was incremented if the event registration conditions recurred during the regeneration period. The value of the regenerate counter is displayed in the Total appearances column. For an aggregate event, the latest last-seen date and time among events included in the aggregate event. Just like with the Start column, you can view the date together with the time, or just the date or time by itself.
- Title.
The title configured for the NDR event type.
- Score.
The calculated score for the NDR event. This numerical value determines the severity level of the NDR event. Depending on the severity level, the score can be displayed in one of the following colors:
- Red for a High-severity event.
- Yellow for a Medium-severity event.
- Blue for a Low-severity event.
- Source.
Address of the source of network packets. You can enable or disable the display of addresses and ports of address information by using the following settings (their abbreviated names displayed in table columns are indicated in the parentheses): IP address, Port number (P), MAC address, VLAN ID (VID), and Application-level address. If additional address spaces were added to the application, you can show or hide address space names by using the Show address spaces setting when configuring the devices table.
- Destination.
Address of the destination of network packets. The display of address information can be configured the same way as the Source column.
- Protocol.
Application layer protocol for which the event was registered.
- Technology.
Icon corresponding to the technology used to register the NDR event.
- Total appearances.
For an NDR event, the value of the repetition counter after the registration of the NDR event during the regeneration period. A value greater than 1 means that the conditions for registering an NDR event recurred N – 1 times. For an aggregate event, this column displays a value of 1.
- ID.
Unique identifier of the registered NDR or aggregate event.
- Application.
Information about applications that caused the conditions for registering the NDR event. The NDR event stores information about applications received from EPP applications.
- Application user.
Information about the user account that started the application specified in the Application column.
- Status.
Icon corresponding to the status of the NDR event or aggregate event.
- Description.
The description specified for the NDR event type.
- End.
For an NDR event, the date and time when the Resolved status was assigned or the regeneration period of the NDR event. For an aggregate event, the latest resolution date and time across nested NDR events. Just like with the Start column, you can view the date together with the time, or just the date or time by itself.
- Triggered rule.
For an NDR event, the name of the Process Control rule or Intrusion Detection rule that, when triggered, caused the NDR event to be registered. For an aggregate event, the name of the correlation rule that, when triggered, caused the aggregate event to be registered.
- Monitoring point.
Monitoring point whose traffic invoked registration of the NDR event.
- Event type.
Numeric code assigned to the NDR event type.
- Marker.
A set of icons that you can assign to any NDR or aggregate event to easily find NDR or aggregate events based on a criterion that is not present in the table.
When viewing the table of network traffic events, you can configure, filter, search, and sort records and navigate to related items.
Page top
Configuring the table of registered events
You can configure the display of the event table as follows:
- Show or hide the information panel.
- Show or hide events included in incidents.
- Show or hide the columns of the table and reorder the columns.
To configure the event table display:
- In the Network traffic events section, click the
 icon.
icon.This opens the table display configuration window.
- If you want to show the information panel displaying the number of events with New or In process status, select the Display information panel check box.
- Under Display embedded lists, select a display mode for NDR events nested in aggregate events:
- Flat. In this mode, the table of events displays all NDR events without regard to event nesting.
- Tree. In this mode, aggregate events are displayed as a tree of nested events and other aggregate events. If you want nested items to be displayed regardless of the current filtering and search settings, select the Show embedded events when filtering check box.
- Under Displayed columns, select check boxes next to the parameters that you want to view in the table. You must select at least one parameter.
- If you want to display the columns in a different order, select the name of the column that you want to move left or right in the table, and click the buttons with the up and down arrows.
For the Start, Last seen, and End columns, you can also change the order in which the date and time values are displayed, and for the Source and Destination columns, you can change the order in which the source and destination addresses of network packets are displayed. To do this, select the value that you want to move left or right in the table, and click the buttons with the up and down arrows.
The selected columns are displayed in the new order in the table in the Network traffic events section.
Page top
Viewing events nested inside an aggregate event
You can use the following modes to view NDR events nested in aggregate events in the table of network traffic events:
- Flat mode. In this mode, the table of NDR events displays all events without regard to event nesting.
- Tree mode. In this mode, aggregate events are displayed as trees that can be collapsed and expanded using the
 and
and  buttons next to the titles of aggregate events.
You can change the display mode when configuring the table of events.
Page top
Viewing details of an NDR event
Details of NDR and aggregate events are displayed in the details area in the Network traffic events section of the application web interface.
To view the details of an NDR or aggregate event:
In the Network traffic events section, select an event.
The details area is displayed in the right part of the web interface window, displaying detailed information about the selected NDR or aggregate event.
Page top
Changing the status of an NDR event
You can change the following statuses of NDR events and aggregate events:
- New. This status can be changed to In process or Resolved.
- In process. This status can be changed to Resolved.
The Resolved status cannot be changed.
If the NDR event is associated with a risk, when assigning the Resolved status to this event, you can also change the risk status to Accepted.
To change the status of NDR events and aggregate events when managing the table of events:
- In the Network traffic events section in the table of events, select the NDR events or aggregate events whose status you want to change.
- Open the Change status drop-down list in the toolbar.
- In the drop-down list, select the command for the status that you want to assign.
Some items of the drop-down list are not available in the following cases:
- The In process item is unavailable if the selected items do not include NDR events or aggregate events with the New status.
- The Resolved item is unavailable if the selected items do not include NDR events or aggregate events with the New or In process status.
If all NDR events or aggregate events that satisfy the current filtering and search conditions are selected, and the number of selected items is greater than 1000, the application does not check their statuses. In this case, the In process and Resolved items are both available. However, the In process item can be used to assign the In process status only to events and incidents that have the New status.
A window with a confirmation prompt opens.
- If the selected NDR events are associated with risks, and you want to simultaneously assign a status of Accepted to all these risks, select Assign the Accepted status for all risks related to the event if one event is selected or Assign the Accepted status for all risks related to the events if multiple events are selected.
Risks may become associated with events when registering certain types of NDR events using the Asset Management technology.
- In the prompt window, click OK.
Adding markers
Users with the Senior security officer role can assign markers to NDR events and aggregate events in the Network traffic events section of the application web interface.
A marker is an icon that helps you find NDR events and aggregate events by criteria that are not present in the table.
To assign a marker to an NDR or aggregate event:
- In the Network traffic events section, in the row with the NDR event or aggregate event, click in the
 column.
 - In the menu that is displayed, select the marker that you want to assign to this NDR event or aggregate event.
You can select one of seven markers provided by the application. The meaning of each marker is up to you to decide.
- If you need to remove a marker, select No marker in the menu.
Users with the Senior security officer and Security auditor roles can view NDR events or aggregate events with a marker.
Page top
Copying NDR events to a text editor
You can copy information about NDR events and aggregate events from the table of network traffic events to any text editor. Information is copied from the columns currently displayed in the table.
Events can be copied if no more than 200 NDR events and aggregate events are selected.
To copy NDR and aggregate events into a text editor:
- In the Network traffic events section, select the NDR events and aggregate events that you want to copy to a text editor.
- Right-click to open the context menu of one of the selected events.
- In the context menu, select one of the following commands:
- Copy details of the event if a single NDR or aggregate event is selected.
- Copy details of the selected events if multiple NDR events or aggregate events are selected.
- Open any text editor.
- In the text editor window, paste the events (for example, by pressing Ctrl+v).
The copied event information can be edited in the text editor. Information about multiple events is delimited by empty lines.
Page top
Downloading traffic for events
When viewing the table of events, you can download traffic related to registered NDR events and aggregate events. Traffic is downloaded as a PCAP file (if one event is selected) or as a ZIP archive containing PCAP files (if multiple events are selected).
You can download traffic if no more than 200 events are selected in the table of events (also counting events nested inside aggregate events).
Traffic for events is downloaded from the application database. Traffic can be stored in the database for registered NDR events if traffic saving is enabled for these events. The application can also directly save traffic in the database upon request to download traffic, using traffic dump files. These files are used for temporary storage and are automatically deleted as new traffic arrives (the rotation period depends on the amount of traffic and the application storage configuration). To guarantee the availability of traffic for download, we recommend enabling traffic saving for the relevant event types and configuring traffic storage in the database in accordance with the rate of traffic accumulation the rate of event registration.
To download a traffic file for NDR events or aggregate events:
- In the Network traffic events section, select the NDR events and aggregate events for which you want to download traffic.
- Click Download traffic.
- If file generation takes a long time (more than 15 seconds), the file generation operation becomes a background operation. In that case, follow these steps to download the file:
- Click the
 button in the application web interface menu.
This opens the list of background operations.
- Wait for the file generation operation to complete.
- Click the Download file button.
- Click the
Your browser saves the downloaded file. Depending on your browser's settings, a window may be displayed on your screen in which you can specify the path and name of the downloaded file.
Page top
Creating a directory for exporting events to a network share
You can export events and save a file with exported events on a network share of the Server computer. For the network share, you can use the Network File System (NFS) protocol, which lets you mount a share of another computer (for example, an NFS server export point) in the local file system of the Server computer. The directory is created and the network share is mounted using standard tools of the operating system.
When using the NFS protocol, the rpcbind software package is activated in the operating system. Keep in mind that attackers may try to use this software package to carry out some types of DDoS attacks. To eliminate the threat of intrusion, you must configure the firewall. In CentOS Stream, we recommend using the firewalld utility to configure the firewall.
Manually creating a directory and mounting a network share
To create a directory for saving files to a network share:
- Open the console of your operating system.
- Create a local directory in which you will mount the network share. To do so, enter the following command:
mkdir <full path to the local directory>For example:
mkdir~/nfsshare - After creating the directory, enter the command to mount the network share:
sudo mount -t nfs <name or IP address of the remote computer>:\<full path to the network share>\<full path to the local directory>For example:
sudo mount-t nfs nfs-server.example:/nfsshare ~/nfsshare - Confirm the success of the mounting:
mount | grep <full path to the local directory>For example:
mount | grep ~/nfsshareIf the mount is successful, the displayed information contains the name or IP address of the remote computer, the name of the network share, and the name of the parent directory.
Automatically mounting a network share
To configure automatic mounting of a network share in the CentOS operating system:
Open the /etc/fstab file for editing as root and add the following line to the file:
<name or IP address of the remote computer>:<full path to the network share> <full path to the local directory> nfs defaults 0 0
For example:
nfs-server.example:/nfsshare /home/user1/nfsshare nfs defaults 0 0
Events database threat hunting
When managing the application web interface, you can generate search queries and use IOC and YAML files to search the events database for threats, for tenants to whose data you have access.
To form search queries through the events database, you can use builder mode or source code mode.
In builder mode, you can create and modify search queries using drop-down lists with options for the type of field value and operators.
In source code mode, you can create and modify search queries using text commands.
You can upload an IOC file or a YAML file with a Sigma rule and search for events in accordance with the conditions specified in this file.
Users with the Senior security officer, Security officer roles can also create TAA (IOA) rules based on event search conditions.
Searching events in design mode
To define event search conditions in builder mode:
- Select the Threat Hunting section, Builder tab in the application web interface window.
This opens the event search form.
- In the drop-down list, select an event search criterion.
You can view a description of the event search criteria in the Event search criteria section.
- In the drop-down list, select an operator.
For a list of available operators, see the Operators section.
Each type of value of the field has its own relevant set of operators. For example, when the EventType field value type is selected, the = and != operators will be available.
- Depending on the selected type of field value, perform one of the following actions:
- In the field, specify one or several characters by which you want to perform an event search.
- In the drop-down list, select the field value option by which you want to perform an event search.
For example, to search for a full match based on a user name, enter the user name.
- If you want to add a new condition, use the AND or OR logical operator and repeat the necessary actions for adding a condition.
- If you want to add a group of conditions, click the Group button and repeat the actions necessary for adding conditions.
- If you want to delete a group of conditions, click the Remove group button.
- If you want to search events that occurred during a specific period, in the Any time drop-down list select one of the following event search periods:
- Any time if you want the table to display events found as far back as the records go.
- Last hour if you want the table to display events that were found during the last hour.
- Last day if you want the table to display events found during the last day.
- Custom range if you want the table to display events found during the period you specify.
- If you selected Custom range:
- In the calendar that opens, specify the start and end dates of the event display range.
- Click Apply.
The calendar closes.
- Click Search.
The table of events that satisfy the search criteria is displayed.
If you are using the distributed solution and multitenancy mode, found events are grouped in tiers: Server – Tenant names – Server names.
- Click the name of the server for which you want to view events.
The host table of the selected server is displayed. Event grouping levels are displayed above the table.
You can convert a query created in the builder into an event search query in source code mode.
Searching events in source code mode
To define event search conditions in source code mode:
- In the application web interface window, select the Threat Hunting section, Source code tab.
This opens a form containing the field for entering event search conditions in source code mode.
- Enter the event search conditions using criteria, operators, logical operators
ORandAND, and parentheses to group conditions.A search condition must conform to the following syntax:
<criterion> <operator> <criterion value>.Example:
EventType == 'filechange' AND((FileName == '*example*' ORDllName == '*example*' ORDroppedName == '*example*' ORBlockedName == '*example*' ORInterpretedFileName == '*example*' ORInterpretedFiles.FileName == '*example*' ORTargetName == '*example*' ORHandleSourceName == '*example*' ORHandleTargetName == '*example*') ORUserName == '*example*')You can use the autocomplete feature. To do so, place the cursor in the query line and press Ctrl+Space.
- If you want to search events that occurred during a specific period, click the Any time button and select one of the following event search periods:
- Any time if you want the table to display events found as far back as the records go.
- Last hour if you want the table to display events that were found during the last hour.
- Last day if you want the table to display events found during the last day.
- Custom range if you want the table to display events found during the period you specify.
- If you selected Custom range:
- In the calendar that opens, specify the start and end dates of the event display range.
- Click Apply.
The calendar closes.
- Click Search.
The table of events that satisfy the search criteria is displayed.
If you are using the distributed solution and multitenancy mode, found events are grouped in tiers: Server – Tenant names – Server names.
- Click the name of the server for which you want to view events.
The host table of the selected server is displayed. Event grouping levels are displayed above the table.
Converting a builder query for searching events in source code mode
You can convert a query created in the builder into an event search query in source mode.
When a query is converted, its syntax is adapted to searching for events in source code mode.
To convert a query:
- Select the Threat Hunting section, Builder tab in the application web interface window.
This opens the event search form.
- In the drop-down list, select an event search criterion.
You can view a description of the event search criteria in the Event search criteria section.
- In the drop-down list, select an operator.
For a list of available operators, see the Operators section.
Each type of value of the field has its own relevant set of operators. For example, when the EventType field value type is selected, the = and != operators will be available.
- Depending on the selected type of field value, perform one of the following actions:
- In the field, specify one or several characters by which you want to perform an event search.
- In the drop-down list, select the field value option by which you want to perform an event search.
For example, to search for a full match based on a user name, enter the user name.
- If you want to add a new condition, use the AND or OR logical operator and repeat the necessary actions for adding a condition.
- If you want to add a group of conditions, click the Group button and repeat the actions necessary for adding conditions.
- If you want to delete a group of conditions, click the Remove group button.
- If you want to search events that occurred during a specific period, in the Any time drop-down list select one of the following event search periods:
- Any time if you want the table to display events found as far back as the records go.
- Last hour if you want the table to display events that were found during the last hour.
- Last day if you want the table to display events found during the last day.
- Custom range if you want the table to display events found during the period you specify.
- If you selected Custom range:
- In the calendar that opens, specify the start and end dates of the event display range.
- Click Apply.
The calendar closes.
- Go to the Source code tab.
A warning is displayed telling you that the conversion is not reversible.
- Click Convert.
The query is converted into a query for searching events in source code mode.
Page top
Event search criteria
You can use the following criteria to search for events in builder mode:
- General information:
- Host is the host name.
- HostIP is the IP address of the host.
- EventType is the type of the event.
- UserName is the name of the user.
- OsFamily is the family of the operating system.
- OsVersion is the version of the operating system being used on the host.
- TAA properties:
- IOAId is the TAA (IOA) rule ID.
- IOATag is the information about the results of file analysis using the Targeted Attack Analyzer technology: name of the TAA (IOA) rule that was used to create the alert.
- IOATechnique is the MITRE technique.
- IOATactics is the MITRE tactic.
- IOAImportance is the importance level that is assigned to an event generated using this TAA (IOA) rule.
- IOAConfidence is the level of confidence depending on the likelihood of false alarms caused by the rule.
- File properties:
- CreationTime is the event creation time.
- FileName is the name of the file.
- FilePath is the path to the directory where the file is located.
- FileFullName is the full path to the file. Includes the path to the directory and the file name.
- ModificationTime is the file modification time.
- FileSize is the size of the file.
- MD5 is the MD5 hash of the file.
- SHA256 is the SHA256 hash of the file.
- SimilarDLLPath is the malicious DLL placed in a directory on the standard search path to make the operating system load it before the original DLL.
- Linux processes:
- LogonRemoteHost is the IP address of the host that initiated remote access.
- RealUserName is the name of the user assigned when the user was registered in the system.
- EffectiveUserName is the user name that was used to log in to the system.
- FileOwnerUserName is the name of the file owner.
- RealGroupName is the name of the user group.
- EffectiveGroupName is the name of the user group that is used for operation.
- Environment is system environment variables.
- ProcessType is the type of the process.
- OperationResult is the result of the operation.
- Process started:
- PID is the process ID.
- ParentFileFullName is the path to the parent process file.
- ParentMD5 is the MD5 hash of the parent process file.
- ParentSHA256 is the SHA256 hash of the parent process file.
- StartupParameters is the options that the process was started with.
- ParentPID is the parent process ID.
- ParentStartupParameters is the parent process startup settings.
- Remote connection:
- HTTPMethod is the HTTP request method. For example, Get, Post, or Connect.
- ConnectionDirection is the direction of the connection (inbound or outbound).
- LocalIP is the IP address of the local computer from which the remote connection attempt was made.
- LocalPort is the IP address of the local computer from which the remote connection attempt was made.
- RemoteHostName is the name of the computer that was the target of the remote connection attempt.
- RemoteIP is the IP address of the computer that was the target of the remote connection attempt.
- RemotePort is the port of the computer that was the target of the remote connection attempt.
- URl is the address of the resource to which the HTTP request was made.
- TlsVersion is the version of the protocol.
- TlsSni is the Server Name Indication, that is, the name of the resource to which the connection is being established.
- TlsCertificateMd5 is the MD5 hash of the TLS certificate.
- TlsCertificateSha1 is the SHA1 hash of the TLS certificate.
- TlsCertificateSubjectNames are the primary and secondary DNS names.
- TlsCertificateIssuerName is the name of the organization of the certificate owner.
- TlsCertificateSerialNumber is the serial number of the certificate.
- TlsCertificateCheckResult is the certificate verification result.
- TlsCipherSuite are the cipher suites of the certificate.
- TlsCertificateValidFrom is the date from which the certificate expiration date is calculated.
- TlsCertificateValidTo is the date after which the certificate expires.
- DNS:
- DnsServerIpAddress is the IP address of the DNS server.
- DnsQueryDomainName is the domain name from the request.
- DnsAnswerData is the response data.
- DnsQueryTypeId is the record type ID.
- LDAP:
- LDAPSearchFilter is the search filter.
- LDAPSearchDistinguishedName is the distinguished name.
- LDAPSearchAttributeList is a list of search attributes.
- LDAPSearchScope is the search scope.
- Named pipe:
- PipeName is the named pipe.
- PipeOperationType is the type of the operation with the named pipe.
- WMI:
- WmiOperationType is the WMI operation type: WMI activity or WMI event consumer name.
- WmiHostName is the name of the machine.
- WmiUserName is the user name.
- WmiNamespaceName is the namespace.
- WmiQuery is the text of the query.
- WmiFilterName is the event filter.
- WmiConsumerName is the name of the event consumer.
- WmiConsumerText is the source code of the event consumer.
- Registry modified:
- RegistryKey is the registry key.
- RegistryValueName is the name of the registry value.
- RegistryValue is the data of the registry value.
- RegistryOperationType is the type of the operation with the registry.
- RegistryPreviousKey is the previous registry key.
- RegistryPreviousValue is the previous name of the registry value.
- System event log:
- WinLogEventID is the type ID of the security event in the Windows log.
- LinuxEventType is the type of the event. This criterion is used for Linux and macOS operating systems.
- WinLogName is the name of the log.
- WinLogEventRecordID is the log entry ID.
- WinLogProviderName is the ID of the system that logged the event.
- WinLogTargetDomainName is the domain name of the remote computer.
- WinLogObjectName is the name of the object that initiated the event.
- WinlogPackageName is the name of the package that initiated the event.
- WinLogProcessName is the name of the process that initiated the event.
- Detect and processing result:
- DetectName is the name of the detected object.
- RecordID is the ID of the triggered rule.
- ProcessingMode is the scanning mode.
- ObjectName is the name of the object.
- ObjectType is the type of the object.
- ThreatStatus is the detection mode.
- UntreatedReason is the event processing status.
- ObjectContent (for AMSI events too) is the content of the script sent for scanning.
- ObjectContentType (for AMSI events too) is the type of script content.
- Console interactive input:
- InteractiveInputText is the text entered on the command line.
- InteractiveInputType is the input type (console or pipe).
- File modified:
- FileOperationType is the type of the file operation.
- FilePreviousPath is the path to the directory where the file was previously located.
- FilePreviousName is the previous name of the file.
- FilePreviousFullName is the full name of the file including the path to the directory where the file was previously located and/or the previous file name.
- DroppedFileType is the type of the modified file.
- Code injection and process access:
- AccessMethod is the access method.
- InjectAddress is the address space of the recipient process.
- InjectedDllName is the name of the injected DLL.
- ModifiedStartupParameters are the modified startup parameters.
- InjectedDllPath is the path to the injected DLL.
- CallTrace is the call trace.
- TargetStartupParameters is the command that was used to start the recipient process.
- Process access:
- AccessOperationType is the operation type: Process access is open or Duplicate handle.
- ProccessAccessRights are the requested process access rights.
- HandleSourceStartupParameters is the command that starts the source handle.
- HandletargetStartupParameters is the command to start the target handle.
- Other:
- File type is the type of the file.
- TlsJa3Md5 contains decimal byte values for the following fields in the client hello packet: TLS version, cipher suite, list of TLS protocol extensions, elliptic curves, and elliptic curve formats.
- TlsJa3sMd5 contains decimal byte values for the following fields in the server hello packet: TLS version, cipher suite, and list of TLS protocol extensions.
- DotNetAssemblyName is the name of the .NET assembly.
- DotNetAssemblyFlags contains .NET assembly flags.
To view the list of event search fields in source code mode, you can download this file.
Page top
Operators
The operators that you can use for searching in builder mode and in source code mode are listed in the table below.
Operators that can be used for searching in builder mode and in source code mode
Builder mode |
Source code mode |
|---|---|
= |
== |
!= |
NOT (example) |
CONTAINS |
==*example* |
!CONTAINS |
NOT (example=='*example*') |
STARTS |
=='example*' |
!STARTS |
NOT (example=='example*') |
ENDS |
=='*example' |
!ENDS |
NOT (example=='*example') |
Sorting events in the table
You can sort events in the table by the Event time, Event type, Host, and User name columns.
To sort events in the event table:
- Select the Threat Hunting section in the application web interface window.
This opens the Threat Hunting window.
- Define the criteria for searching events in builder mode or source code mode.
The table of events that satisfy the search criteria is displayed.
- If you want to sort events by time, click one of the icons to the right of the Event time column name:
- to display newer events at the top of the table.
- to display older events at the top of the table.
- If you want to sort events by the event type name, click one of the icons to the right of the Event type column heading:
- to sort alphabetically, A–Z.
- to sort alphabetically, Z–A.
- If you want to sort events based on the names of host on which the alerts were generated, click one of the icons to the right of the Host column name:
- to sort alphabetically, A–Z.
- to sort alphabetically, Z–A.
- If you want to sort events based on the user names of hosts, click one of the icons on the right of the User name column name:
- to sort alphabetically, A–Z.
- to sort alphabetically, Z–A.
- If you want to group events based on the names of hosts or by the event type name, click one of the values in the Group by drop-down list:
- Group by host name if you want to group events by the names of hosts.
- Group by event type if you want to group events by the names of event types.
If events were sorted by the Host or Event type field, the sorting result is cleared when events are grouped by a similar attribute. To return to the sorting results, select the Group by value from the Group by drop-down list.
By default, events in the table are sorted by time, with the newest events at the top of the table.
You can sort events based on one attribute only.
When sorting by event type in a foreign language, events are sorted based on the internal name of the event type in English.
Page top
Changing the event search conditions
To change the event search conditions, perform the following actions in the Threat Hunting section of the application web interface window:
- Click the form containing the event search conditions in the upper part of the window.
- Select one of the following tabs:
- Builder if you want to edit the event search conditions in builder mode.
- Source code, if you want to change the event search conditions in source code mode.
- Make the relevant changes.
- Click one of the following buttons:
- Refresh, if you want to refresh the current event search with the new conditions.
- New search, if you want to perform a new event search.
The table of events that satisfy the search criteria is displayed.
Searching for events by processing results in EPP applications
To search events by processing results in
in builder mode:- Select the Threat Hunting section, Builder tab in the application web interface window.
This opens the event search form.
- To search events by processing status:
- In the search criteria drop-down lost in the Detect and processing result group, select ThreatStatus.
- In the drop-down list of comparison operators, select one of the following options:
- = (equals)
- != (does not equal)
- In the drop-down list of event processing status, select one of the following options:
- Object clean.
- Object disinfected.
- False positive.
- Object added by user.
- Object added to exclusions.
- Object deleted.
- Object quarantined.
- Object not found.
- Object rolled back.
- Object cannot be processed.
- Object not processed.
- Processing terminated.
- Unknown.
- To search events by reasons why they were not processed:
- In the search criteria drop-down lost in the Detect and processing result group, select UntreatedReason.
- In the drop-down list of comparison operators, select one of the following options:
- = (equals)
- != (does not equal)
- In the drop-down list of reasons why the events were not processed, select one of the following options:
- Object already processed.
- Application is running in Report only mode.
- Failed to back up object.
- Failed to copy object.
- Device not ready.
- Object blocked.
- No rights to perform action.
- Object not curable.
- Object not overwritable.
- Object not found.
- No free space on disk.
- Processing canceled.
- Processing postponed.
- Processing task stopped.
- Error reading data.
- Reason unknown.
- This is a critical system object.
- Data write error.
- Data write not supported.
- Object write-protected.
- If you want to add a new condition, use the AND or OR logical operator and repeat the necessary actions for adding a condition.
- If you want to add a group of conditions, click the Group button and repeat the actions necessary for adding conditions.
- If you want to delete a group of conditions, click the Remove group button.
- If you want to search events that occurred during a specific period, in the Any time drop-down list select one of the following event search periods:
- Any time if you want the table to display events found as far back as the records go.
- Last hour if you want the table to display events that were found during the last hour.
- Last day if you want the table to display events found during the last day.
- Custom range if you want the table to display events found during the period you specify.
- If you have selected the Custom range display period for found events:
- In the calendar that opens, specify the start and end dates of the event display range.
- Click Apply.
The calendar closes.
- Click Search.
The table of events that satisfy the search criteria is displayed.
Searching for events using conditions specified in an IOC or YAML file
When creating an IOC file, review the list of IOC terms that you can use to search for events in the Threat Hunting section. You can view the list of supported IOC terms by downloading the file from the link below.
![]() IOC terms for searching events in the Threat Hunting section
IOC terms for searching events in the Threat Hunting section
To search for events using conditions specified in an IOC or YAML file:
- Select the Threat Hunting section in the application web interface window.
This opens the event search form.
- Click Import.
This opens the file selection window.
- Select the file that you want to upload and click Open.
The file is uploaded.
On the Source code tab, the form containing event search conditions will display the conditions defined in the uploaded file.
You can search for events that match these conditions. You can also change the conditions defined in an uploaded file, or add event search conditions in source code mode.
- If you want to search events that occurred during a specific period, click the Any time button and select one of the following event search periods:
- Any time if you want the table to display events found as far back as the records go.
- Last hour if you want the table to display events that were found during the last hour.
- Last day if you want the table to display events found during the last day.
- Custom range if you want the table to display events found during the period you specify.
- If you have selected the Custom range display period for found events:
- In the calendar that opens, specify the start and end dates of the event display range.
- Click Apply.
The calendar closes.
- Click Search.
An event table is displayed that corresponds to criteria specified in the uploaded file.
Creating a TAA (IOA) rule based on event search conditions
To create a TAA (IOA) rule based on event search conditions:
- Select the Threat Hunting section in the application web interface window.
This opens the event search form.
- Perform an event search in builder mode or source code mode.
- Click Save as TAA (IOA) rule.
This opens the New TAA (IOA) rule window.
- In the Name field, type the name of the rule.
- Click Save.
The event search condition will be saved. In the TAA (IOA) rule table in the Custom rules section, TAA subsection of the web interface, the new rule is displayed with the specified name.
If you want to save event search conditions as a user-defined TAA (IOA) rule, avoid using the following fields:
- IOAId.
- IOATag.
- IOATechnique.
- IOATactics.
- IOAImportance.
- IOAConfidence.
At the time of saving the user-defined TAA (IOA) rule, the application may not have any events containing data for these fields. When events with this data turn up, the user-defined field that you have created earlier will be unable to mark events by these fields.
Users with the Security auditor and Security officer roles cannot create TAA (IOA) rules based on event search conditions.
Event information
If you are using the distributed solution and multitenancy mode, when managing the application using the web interface, you can view event information for those tenants to whose data you have access.
Event information displays local timestamps of the Endpoint Agent computer that detected the event. The application administrator must make sure the time on computers with the Endpoint Agent component is current.
To enable the display of events for all tenants:
- Select the Threat Hunting section in the application web interface window.
- Turn on the Search in all tenants toggle switch.
The table of events displays events for all tenants.
Recommendations for processing events
The event window display buttons with the actions available for handling this event in the box between the event tree and the information text for users with the Senior security officer role.
You can perform the following actions:
- Isolate <host name> – isolate the host with the Endpoint Agent component where the event was detected from the network. Applies to all event types.
- Create prevention rule – prohibit the execution of the file that was detected in the event. Applies to all event types except System event log.
- Create task — create a task. Applies to all event types except System event log.
Additionally, you can process the event by clicking the link with the name, path, MD5 or SHA256 hash of the file and the host name while viewing text information about the event in the lower part of the window.
Clicking the link with the file name or file path opens a list in which you can select one of the following actions:
- Find events.
- Find alerts.
- Run the following tasks:
- Copy value to clipboard.
Clicking the MD5 link opens a list in which you can select one of the following actions:
- Filter by this value.
- Exclude from filter.
- Find on Kaspersky TIP.
- Find events.
- Find alerts.
- Copy value to clipboard.
Clicking the SHA256 link opens a list in which you can select one of the following actions:
- Find events.
- Find alerts.
- Find on Kaspersky TIP.
- Find on virustotal.com.
- Find in Storage.
- Create prevention rule.
- Copy value to clipboard.
Clicking the link with the host name opens a list in which you can select one of the following actions:
- Find events.
- Find alerts.
- Run the following tasks:
- Copy value to clipboard.
Users with the Security auditor and Security officer roles are not shown recommendations for processing events.
Following a recommendation to isolate a host
To follow a recommendation to isolate a host from the network:
- In the recommendation box, select Isolate <host name>.
This opens the host isolation settings window for the host from the event you are working on.
- In the Disable isolation after field, enter the time in hours (1 to 9999) during which network isolation of the host will be active.
- In the Exclusions for the host isolation rule settings group, in the Traffic direction list, select the direction of network traffic that must not be blocked:
- Incoming/Outgoing.
- Incoming.
- Outgoing.
- In the IP field, enter the IP address whose network traffic must not be blocked.
If you are using Kaspersky Endpoint Agent in the role of the Endpoint Agent component, you can use a proxy server for the connection of Kaspersky Endpoint Agent for Windows with Kaspersky Anti Targeted Attack Platform. When you add this proxy server to exclusions, network resources that can be accessed through the proxy server are also added to exclusions. If network resources that are accessed through the proxy server are added to exclusions, but the proxy server itself is not, such exclusions do not work.
- If you selected Incoming or Outgoing, in the Ports field enter the connection ports.
- If you want to add more than one exclusion, click Add and repeat the steps to fill in the Traffic direction, IP and Ports fields.
- Click Save.
Information about host isolation is displayed in the Endpoint Agents section of the web interface.
You can also create a network isolation rule by clicking the Isolate <host name> link in the alert information and in the Endpoint Agents section of the web interface.
Users with the Security auditor and Security officer roles cannot isolate a host from the network.
Following a recommendation to prevent a file from running
To follow a recommendation to prevent a file from running:
- In the recommendations box, select Create prevention rule.
This opens the prevention rule creation window with the MD5 or SHA256 hash of the file from the event you are working on.
- Configure the following settings:
- State is the state of the prevention rule:
- If you want to enable the prevention rule, set the toggle switch to On.
- If you want to disable the prevention rule, set the toggle switch to Off.
- Name is the name of the prevention rule.
- If you want the application to display a notification about prevention rule triggering to the user of the computer on which the prevention is applied, select the Notify user about blocking file execution check box.
- If you want to change the scope of the prevention rule, configure the Prevent on setting:
- If you want to apply the prevention rule on all hosts of all servers, select All hosts.
- If you want to apply the prevention rule on selected servers, select the Specified servers option and on the right of the Servers parameter name select the check boxes next to the names of the servers on which you want to apply the prevention rule.
This option is available only when distributed solution and multitenancy mode is enabled.
- If you want to apply the prevention rule on selected hosts, select the Specified hosts option and list these hosts in the Hosts field.
- State is the state of the prevention rule:
- Click Add.
The file run prevention is created.
Information about the created prevention is displayed in the Prevention section of the web interface.
If you selected the Notify user about blocking file execution check box and an attempt is made to execute a file prevented from running, the user is notified that an execution prevention rule was triggered by this file.
Users with the Security auditor and Security officer roles cannot prevent file execution.
Following a recommendation to create a task
To follow a recommendation to create a task:
- Click Create task, and in the recommendation box, expand the list of task types.
- Select a task type:
- Kill process.
- Get forensics.
- Start YARA scan.
- Manage services.
- Get process memory dump.
- Get NTFS metafiles.
- Run application.
- Get file.
- Delete file.
- Quarantine file.
- Restore file from quarantine.
This opens the task creation window with preset values (for example, host name, file path, MD5 or SHA256 hash of the file) from the event you are working on.
- If you want to modify preset values from the event, edit the corresponding fields.
- If you want to add a comment for the task, enter it in the Description box.
- If you are creating a Kill process, Delete file, Start YARA scan, or Manage services task and you want to modify the scope of the task, change the value of the Task for setting:
- If you want to run the task on all hosts of all servers, select the All hosts option.
- If you want to run the task on selected servers, select the Specified servers option and on the right of the Servers parameter name select the check boxes next to the names of the servers on which you want to run the task.
This option is available only when distributed solution and multitenancy mode is enabled.
- If you want to run the task on selected hosts, select the Specified hosts option and list these hosts in the Hosts field.
- Click Add.
The task is created.
Information about the created task is displayed in the Tasks section of the web interface.
Users with the Security auditor and Security officer roles cannot create tasks.
Information about events in the tree of events
The tree of events is displayed in the upper part of the event information window.
The tree of events contains the following information:
- The event for which you are viewing information.
The event you are viewing is displayed on the right side.
- The parent process.
The parent process is displayed to the left of the event you are viewing. If the event you are viewing does not have a parent process, the host name where the event was registered is displayed instead.
Clicking the name of the parent process on the left side displays the process that has initiated the process in question and is a parent process with regard to that process. If there is no parent process, the host name is displayed instead.
To the right of each parent process name, the total number of events generated by this process is displayed. You can view the list of events and information about the selected event.
Viewing parent process information in the tree of events
To display parent process information for the event being viewed:
- Perform an event search in builder mode or source code mode.
The event table is displayed.
- Select the event whose information you want to view.
This opens a window containing information about the event. The upper part of the window displays the tree of events.
- Click the .
In the bottom part of the window, the Details tab displays information about the process that is the parent process with regard to the event being viewed.
Viewing information about events initiated by the parent process in the tree of events
To view the table of all events initiated by the parent process:
- Perform an event search in builder mode or source code mode.
The event table is displayed.
- Select the event whose information you want to view.
This opens a window containing information about the event. The upper part of the event information window displays the tree of events.
- Click the name of the parent process in the event tree.
In the bottom part of the window, the Details tab displays information about the event that is the parent event with regard to the event being viewed.
- Go to the Events tab.
A table of all events initiated by the parent process is displayed. By default, events in the table are sorted by time, with the newest events at the top of the table.
You can view event information by clicking the row of the relevant event. The event node is displayed in the tree of events.
To display the event table grouped by type:
- Perform an event search in builder mode or source code mode.
The event table is displayed.
- Select the event whose information you want to view.
This opens a window containing information about the event. The upper part of the event information window displays the tree of events.
- Click the drop-down list to the right of the parent process name in the tree of events.
A list of all events initiated by the parent process is displayed. By default, the events in the list are grouped by type.
- In the tree of events, in the drop-down list to the right of the parent process name, select one of the following options:
- If you want to display all events initiated by the parent process, click All events.
A table of all events initiated by the parent process is displayed. By default, events in the table are sorted by time, with the newest events at the top of the table.
- If you want to view all events of a particular type initiated by the parent process, select the name of the relevant event type.
A table of all events initiated by the parent process is displayed, grouped by type.
You can view event information by clicking the row of the relevant event. The event is displayed in the tree of events.
- If you want to display all events initiated by the parent process, click All events.
Viewing host information in the tree of events
If the event that you are viewing or the parent process do not have a process that initiated it, the process node in the tree of events is replaced with the node of the host where the event was registered or the parent process was running.
To view information for the host where the event was registered or the parent process was started:
- Perform an event search in design mode or source code mode.
The event table is displayed.
- Select the event whose information you want to view.
This opens a window containing information about the event. The upper part of the window displays the tree of events.
- Click the host name in the tree of events.
The bottom part of the window displays information about the host where the event was registered or the parent process was running.
Viewing the table of events
The events table is displayed in the Threat Hunting section of the application web interface window after completion of Threat Hunting in the events database. You can sort events in the table by the Event time, Event type, Host, and User name columns.
If you are using the distributed solution and multitenancy mode, events in the table are grouped by hosts of the selected servers and tenants.
The table of events contains the following information:
- Event time—Date and time when the event was detected.
- Event type, for example, Process started.
- Host name—Name of the host on which the alert was generated.
- Details—Information about the event.
- User name—Name of the user on the computer with the Endpoint Agent component whose user account was used to detect the event.
In the events table, the Details column displays the set of data for each type of event in the Event type column (see the table below).
Set of data in the Details column for each event type in the Event type column
Event type |
Details |
|---|---|
Process started |
Name of the process file that was started. SHA256 and MD5 hashes. |
Module loaded |
Name of the dynamic library that was loaded. SHA256 and MD5 hashes. |
Connection to remote host |
URL to which a remote connection attempt was made. Name of the file that attempted to establish a remote connection. |
Blocked application (prevention rule) |
Name of the file of the application that was blocked from starting. SHA256 and MD5 hashes. |
Document blocked |
Name of the document that was blocked from starting. SHA256 and MD5 hashes. |
File changed |
Name of the created file. SHA256 and MD5 hashes. |
System event log |
Channel for recording events in the system log. Event type ID. |
Registry modified |
Name of key in registry. |
Port listened |
Server address and port. Name of the file of the process that listens to the port. |
Driver loaded |
File name of the driver that has been loaded. SHA256 and MD5 hashes. |
Detection |
Name of the file in which the object was detected. Name of the detected object. SHA256 and MD5 hashes. |
Detection processing result |
Name of the file in which the object was detected. Name of the detected object. SHA256 and MD5 hashes. |
AMSI scan |
Name of the scanned object. Type of the script. Text of the script sent to be scanned. |
Process: interpreted file run |
Name of the file that was run. SHA256 and MD5 hashes. |
Process: console interactive input |
Command text. |
Process terminated |
File name of the stopped process. SHA256 and MD5 hashes. |
DNS |
Name of the domain being looked up. Resource record type ID. |
LDAP |
Search scope and filter. |
Named pipe |
Pipe name. Pipe operation type. |
WMI |
WMI operation type. Event consumer source code. |
Code injection |
File name of the target process or name of the dynamic-link library that contains the hook procedure and the name of the function to which control is passed after injection. Method of access to the target process file. SHA256 and MD5 hashes of the target process file. |
Process access |
Name of the recipient process file. Importance of the event. Type of operation performed on the process file. Process access permissions. |
If you are using Kaspersky Endpoint Agent as the Endpoint Agent component, information about the AMSI scan event is available when Kaspersky Anti Targeted Attack Platform is integrated with Kaspersky Endpoint Agent for Windows 3.10 or later and when Kaspersky Endpoint Agent is integrated with Kaspersky Endpoint Security for Windows 11.5 or later. If Kaspersky Endpoint Security for Windows is not installed on the computer and is not integrated with Kaspersky Endpoint Agent, information about the AMSI scan event is not logged in the event database and is not displayed in the Kaspersky Anti Targeted Attack Platform web interface.
If Kaspersky Endpoint Agent is used in the role of the Endpoint Agent component, the Central Node server generates Detection and Detection processing result events based on data received from EPP applications. If EPP applications are not installed on the computer and are not integrated with Kaspersky Endpoint Agent, information about these events is not logged in the event database and is not displayed in the Kaspersky Anti Targeted Attack Platform web interface.
Clicking the link with the name of the event type, data, additional information and user name opens a list in which you can select the action to perform on the object. Depending on the value in the cell, you can do one of the following:
- For all values in the cell:
- Filter by this value.
- Exclude from filter.
- Copy value to clipboard.
- Host name:
- File name:
- MD5 hash:
- SHA256 hash:
- Find events.
- Find alerts.
- Find on Kaspersky TIP.
- Find on virustotal.com.
- Create prevention rule.
- Find in Storage.
Configuring the event table display
You can show or hide columns and change the order of columns in the event table.
To configure the event table display:
- Perform an event search in design mode or source code mode.
The event table is displayed.
- In the heading part of the table, click .
This opens the Customize table window.
- If you want to show a column in the table, select the check box next to the name of the parameter that you want displayed in the table.
If you want to hide a parameter in the table, clear the check box.
At least one check box must be selected.
- If you want to change the order of columns in the table, move the mouse cursor to the row with the relevant parameter, click and move the row to its new place.
- If you want to restore default table display settings, click Default.
- Click Apply.
The display of the event table is configured.
Page top
Viewing information about an event
To view event details:
- In the application web interface window, select the Threat Hunting section, Builder or Source code tab.
This opens the event search form.
- If you are using the distributed solution and multitenancy mode and want to enable the display of events for all tenants, turn on the Search in all tenants toggle switch.
- Perform an event search in builder mode or source code mode.
The event table is displayed.
- Select the event whose information you want to view.
This opens a window containing information about the event.
Information about the "Process started" event
The window displaying information about Process started events contains the following details:
- Tree of events.
- Actions that can be performed to handle an event.
- Process started section:
- IOA tags—Information about the results of file analysis using the Targeted Attack Analyzer technology: name of the TAA (IOA) rule that was used to create the alert.
Click the link to display information about the TAA (IOA) rule. If the rule was provided by Kaspersky experts, it contains information about the triggered MITRE technique as well as recommendations for reacting to the event.
The field is displayed if a TAA (IOA) rule was triggered when the event was created.
- File—Process file name.
- Process ID—Process identifier.
- Launch parameters—Process startup settings.
If the event was logged in the event database by Kaspersky Endpoint Security for Linux or Kaspersky Endpoint Security for Mac, instead of the Launch parameters field, the Command field is displayed, that is, the command that was used to run the process.
- Current directory—Current directory of the process
- MD5—MD5 hash of the process file.
- SHA256—SHA256 hash of the process file.
- Size—Size of the process file.
- File type—Type of the process file.
- Event time—Process start time.
- Attributes modification time—Time when the attributes of the process file were changed.
- Time created—Process file creation time.
- Time modified—Time of last modification of the process file.
- IOA tags—Information about the results of file analysis using the Targeted Attack Analyzer technology: name of the TAA (IOA) rule that was used to create the alert.
- Details section:
- Application name—For example, the name of the operating system.
- Vendor—For example, vendor of the operating system.
- File description—For example, Example File.
- Original file name—For example, ExampleFile.exe.
- Signature subject—Organization that issued the digital certificate of the file.
- Signature validation result—For example, "Invalid" or "OK".
- Attributes—File attribute in accordance with the Windows classification. For example, A (archive), D (directory), or S (system file).
If the event was logged in the event database by Kaspersky Endpoint Security for Linux or Kaspersky Endpoint Security for Mac, the Details section also includes the following fields:
- Attributes—Attributes of the process file.
- Process type—For example, exec.
- Environment variables—Environment variables of the process.
- Real user name—Name of the user assigned when registering in the system.
- Real group name—Group to which the user belongs.
- Effective user name—User name that was used to log in to the system.
- Effective group name—Group of the user whose name was used to log in to the system.
- Owner user name—Name of the user that created the process file.
- Owner group name—Name of the group whose users can modify or delete the file of the process.
- File permitted capabilities—Permissions that can be used to gain access to the process file. This field is not displayed if the event was recorded by Kaspersky Endpoint Security for Mac.
- File inheritable capabilities—Permissions that an user group has to perform operations on the parent directory of the process file. This field is not displayed if the event was recorded by Kaspersky Endpoint Security for Mac.
- File effective capabilities—Permissions that are relevant to the process file at the current moment. This field is not displayed if the event was recorded by Kaspersky Endpoint Security for Mac.
- Downloaded from URL—URL from which the process file was downloaded.
- Source—Metadata of the message from which the process file was obtained.
- Account properties—Flags of the user account that ran the process.
- Process creation flags—Process creation flags.
- Symbolic link—Path to the symbolic link.
- Call trace—Call stack.
- Event initiator section:
- File—Path to the parent process file.
- Process ID—Identifier of the parent process.
- Launch parameters—Parent process startup settings.
If the event was logged in the event database by Kaspersky Endpoint Security for Linux or Kaspersky Endpoint Security for Mac, instead of the Launch parameters field, the Command field is displayed, that is, the command that was used to run the parent process.
- MD5—MD5 hash of the parent process file.
- SHA256—SHA256 hash of the parent process file.
- System info section:
- Host name—Name of the host on which the process was started.
- Host IP—IP address of the host on which the process was started.
If you are using dynamic IP addresses, the field displays the IP address assigned to the host at the moment when the event was created.
The application does not support IPv6. If you are using IPv6, the IP address of the host is not displayed.
- User account type—Type of the account that ran the process. For example, administrator.
- Logon type—For example, using a running service.
- User name—Name of the user that started the process.
- OS version—Version of the operating system that is being used on the host.
If the event was logged in the event database by Kaspersky Endpoint Security for Linux or Kaspersky Endpoint Security for Mac, the System info section also displays the Logon from remote host field for the name of host from which the remote logon was performed.
Clicking the link with the file name or file path opens a list in which you can select one of the following actions:
- Find events.
- Find alerts.
- Run the following tasks:
- Copy value to clipboard.
In the information about the event that Kaspersky Endpoint Security for Linux or Kaspersky Endpoint Security for Mac recorded in the event database, you can click the links with the file name or file path to open a list in which you can select one of the following actions:
- Find events.
- Find alerts.
- Run the Get file task.
- Copy value to clipboard.
Clicking the link with the host name opens a list in which you can select one of the following actions:
- Find events.
- Find alerts.
- Run the following tasks:
- Get data → File, Forensics, Disk image, Memory dump.
- Kill process.
- Delete file.
- Quarantine file.
- Run application.
- Copy value to clipboard.
In the information about the event that Kaspersky Endpoint Security for Linux recorded in the event database, you can click the link with the host name to open a list in which you can select one of the following actions:
- Find events.
- Find alerts.
- Run the following tasks:
- Kill process.
- Delete file.
- Get file.
- Quarantine file.
- Run application.
- Copy value to clipboard.
In the information about the event that Kaspersky Endpoint Security for Mac recorded in the event database, you can click the links with the file name or file path to open a list in which you can select one of the following actions:
- Find events.
- Find alerts.
- Run the Get file task.
- Copy value to clipboard.
Clicking the MD5 link opens a list in which you can select one of the following actions:
- Find events.
- Find alerts.
- Find on Kaspersky TIP.
- Find in Storage.
- Create prevention rule.
- Copy value to clipboard.
Clicking the SHA256 link opens a list in which you can select one of the following actions:
- Find events.
- Find alerts.
- Find on Kaspersky TIP.
- Find on virustotal.com.
- Find in Storage.
- Create prevention rule.
- Copy value to clipboard.
Information about the "Process terminated" event
The window displaying information about Process terminated events contains the following details:
- Tree of events.
- Actions that can be performed to handle an event.
- Process terminated section:
- IOA tags—Information about the results of file analysis using the Targeted Attack Analyzer technology: name of the TAA (IOA) rule that was used to create the alert.
Click the link to display information about the TAA (IOA) rule. If the rule was provided by Kaspersky experts, it contains information about the triggered MITRE technique as well as recommendations for reacting to the event.
The field is displayed if a TAA (IOA) rule was triggered when the event was created.
- File—Process file name.
- Process ID—Process identifier.
- Launch parameters—Process startup settings.
If the event was logged in the event database by Kaspersky Endpoint Security for Linux or Kaspersky Endpoint Security for Mac, instead of the Launch parameters field, the Command field is displayed, that is, the command that was used to run the process.
- MD5—MD5 hash of the process file.
- SHA256—SHA256 hash of the process file.
- Size—Size of the process file.
- Event time— Process termination time.
- IOA tags—Information about the results of file analysis using the Targeted Attack Analyzer technology: name of the TAA (IOA) rule that was used to create the alert.
- Event initiator section:
- File—Path to the parent process file.
- Process ID—Identifier of the parent process.
- Launch parameters—Parent process startup settings.
If the event was logged in the event database by Kaspersky Endpoint Security for Linux or Kaspersky Endpoint Security for Mac, instead of the Launch parameters field, the Command field is displayed, that is, the command that was used to run the parent process.
- MD5—MD5 hash of the parent process file.
- SHA256—SHA256 hash of the parent process file.
- System info section:
- Host name—Name of the host on which the process was started.
- Host IP—IP address of the host on which the process was started.
If you are using dynamic IP addresses, the field displays the IP address assigned to the host at the moment when the event was created.
The application does not support IPv6. If you are using IPv6, the IP address of the host is not displayed.
- User account type—Type of the account that terminated the process. For example, administrator.
- User name—Name of the user that started the process.
- OS version—Version of the operating system that is being used on the host.
If the event was logged in the event database by Kaspersky Endpoint Security for Linux or Kaspersky Endpoint Security for Mac, the System info section also displays the Logon from remote host field for the name of host from which the remote logon was performed.
Clicking the link with the file name or file path opens a list in which you can select one of the following actions:
- Find events.
- Find alerts.
- Run the following tasks:
- Copy value to clipboard.
In the information about the event that Kaspersky Endpoint Security for Linux or Kaspersky Endpoint Security for Mac recorded in the event database, you can click the links with the file name or file path to open a list in which you can select one of the following actions:
- Find events.
- Find alerts.
- Run the Get file task.
- Copy value to clipboard.
Clicking the link with the host name opens a list in which you can select one of the following actions:
- Find events.
- Find alerts.
- Run the following tasks:
- Get data → File, Forensics, Disk image, Memory dump.
- Kill process.
- Delete file.
- Quarantine file.
- Run application.
- Copy value to clipboard.
In the information about the event that Kaspersky Endpoint Security for Linux recorded in the event database, you can click the link with the host name to open a list in which you can select one of the following actions:
- Find events.
- Find alerts.
- Run the following tasks:
- Kill process.
- Delete file.
- Get file.
- Quarantine file.
- Run application.
- Copy value to clipboard.
In the information about the event that Kaspersky Endpoint Security for Mac recorded in the event database, you can click the links with the file name or file path to open a list in which you can select one of the following actions:
- Find events.
- Find alerts.
- Run the Get file task.
- Copy value to clipboard.
Clicking the MD5 link opens a list in which you can select one of the following actions:
- Find events.
- Find alerts.
- Find on Kaspersky TIP.
- Find in Storage.
- Create prevention rule.
- Copy value to clipboard.
Clicking the SHA256 link opens a list in which you can select one of the following actions:
- Find events.
- Find alerts.
- Find on Kaspersky TIP.
- Find on virustotal.com.
- Find in Storage.
- Create prevention rule.
- Copy value to clipboard.
Information about the "Module loaded" event
The window displaying information about Module loaded events contains the following details:
- Tree of events.
- Actions that can be performed to handle an event.
- Module loaded section:
- IOA tags—Information about the results of file analysis using the Targeted Attack Analyzer technology: name of the TAA (IOA) rule that was used to create the alert.
Click the link to display information about the TAA (IOA) rule. If the rule was provided by Kaspersky experts, it contains information about the triggered MITRE technique as well as recommendations for reacting to the event.
The field is displayed if a TAA (IOA) rule was triggered when the event was created.
- File—Name of the loaded module file.
- MD5—MD5 hash of the loaded module file.
- SHA256—SHA256 hash of the loaded module file.
- DLL file type—Type of the loaded module.
- Size—Size of the loaded module.
- Event time—Time when the module was loaded.
- IOA tags—Information about the results of file analysis using the Targeted Attack Analyzer technology: name of the TAA (IOA) rule that was used to create the alert.
- Details section:
- Application name—For example, name of the operating system.
- Vendor—For example, vendor of the operating system.
- File description—For example, Example File.
- Original file name—For example, Example File.
- Zone ID—
- Signature subject—Organization that issued the digital certificate of the loaded module.
- Signature validation result—For example, "Signature invalid" or "Signature OK".
- Digital signature time—Signing time of the loaded module.
- File attributes modified—Attribute modification time of the loaded module.
- Time created—Creation time of the loaded module.
- Time modified—Date of last modification of the loaded module.
- .NET assembly name—Name of the .NET assembly of the loaded module.
- .NET assembly flags—Flags of the .NET assembly of the loaded module.
- .NET module flags—Flags of the loaded module.
- Next DLL in bypass path—The field contains the path to the DLL library that could have been loaded instead of the existing library.
The field is displayed if the following conditions are satisfied:
- The source of the loaded DLL is not trusted.
- A folder in the standard search path contains a library with the same name but a different hash.
If you are using Kaspersky Endpoint Agent as the Endpoint Agent component, Kaspersky Anti Targeted Attack Platform receives the data required to populate the Next DLL in bypass path field only when Kaspersky Anti Targeted Attack Platform is integrated with Kaspersky Endpoint Agent 3.10 for Windows. When integrating the application with older versions of the Kaspersky Endpoint Agent application the field is not displayed in the event information.
- Event initiator section:
- File—Path to the parent process file.
- MD5—MD5 hash of the parent process file.
- SHA256—SHA256 hash of the parent process file.
- System info section:
- Host name—Name of the host on which the module was loaded.
- Host IP—IP address of the host on which the module was loaded.
If you are using dynamic IP addresses, the field displays the IP address assigned to the host at the moment when the event was created.
The application does not support IPv6. If you are using IPv6, the IP address of the host is not displayed.
- User name—Name of the user that loaded the module.
- OS version—Version of the operating system being used on the host.
Clicking the link with the file name or file path in the Module loaded section opens a list in which you can select one of the following actions:
- Find events.
- Find alerts.
- Run the following tasks:
- Copy value to clipboard.
Clicking the link with the file name or file path in the Event initiator section opens a list in which you can select one of the following actions:
- Find events.
- Find alerts.
- Run the following tasks:
- Copy value to clipboard.
Clicking the link with the host name opens a list in which you can select one of the following actions:
- Find events.
- Find alerts.
- Run the following tasks:
- Get data → File, Forensics, Disk image, Memory dump.
- Kill process.
- Delete file.
- Quarantine file.
- Run application.
- Copy value to clipboard.
Clicking the MD5 link opens a list in which you can select one of the following actions:
- Find events.
- Find alerts.
- Find on Kaspersky TIP.
- Find in Storage.
- Create prevention rule.
- Copy value to clipboard.
Clicking the SHA256 link opens a list in which you can select one of the following actions:
- Find events.
- Find alerts.
- Find on Kaspersky TIP.
- Find on virustotal.com.
- Find in Storage.
- Create prevention rule.
- Copy value to clipboard.
Information about the "Remote connection" event
The window displaying information about Connection to remote host events contains the following details:
- Tree of events.
- Actions that can be performed to handle an event.
- Connection to remote host section:
- IOA tags—Information about the results of file analysis using the Targeted Attack Analyzer technology: name of the TAA (IOA) rule that was used to create the alert.
Click the link to display information about the TAA (IOA) rule. If the rule was provided by Kaspersky experts, it contains information about the triggered MITRE technique as well as recommendations for reacting to the event.
The field is displayed if a TAA (IOA) rule was triggered when the event was created.
- Connection direction is the direction of the connection (inbound or outbound).
- Remote IP—IP address of the host to which a remote connection attempt was made.
- Local IP – IP address of the local computer from which a remote connection attempt was made.
- Event time—Time of the remote connection attempt.
- IOA tags—Information about the results of file analysis using the Targeted Attack Analyzer technology: name of the TAA (IOA) rule that was used to create the alert.
- TLS section:
- Version—Version of the protocol.
- SNI—Name of the website to connect to.
- Encrypted SNI—Encrypted name of the website.
- Certificate MD5—MD5 hash of the certificate file.
- Certificate SHA1—SHA1 hash of the certificate file.
- Certificate issuer name—Name of the organization that signed the certificate.
- Serial number—Unique number of the certificate.
- Certificate verification result—Result of certificate verification.
- Certificate valid from—Date from which the certificate is valid.
- Certificate valid to—Date after which the certificate expires.
- JA3—Decimal byte values for the following fields in the client hello packet: TLS version, cipher suite, list of TLS protocol extensions, elliptic curves, and elliptic curve formats. To delimit fields, use the "," character; to delimit values in each field, use the "-" character.
- JA3S—Decimal byte values for the following fields in the server hello packet: TLS version, cipher suite, and list of TLS protocol extensions. To delimit fields, use the "," character; to delimit values in each field, use the "-" character.
- JA3 MD5—JA3 fingerprint.
- JA3S MD5—JA3S fingerprint.
- Event initiator section:
- File—Name of the parent process file.
- MD5—MD5 hash of the parent process file.
- SHA256—SHA256 hash of the parent process file.
- System info section:
- Host name—Host name from which a remote connection attempt was made.
- Host IP—IP address of the host from which a remote connection attempt was made.
If you are using dynamic IP addresses, the field displays the IP address assigned to the host at the moment when the event was created.
The application does not support IPv6. If you are using IPv6, the IP address of the host is not displayed.
- User name—Name of the user that attempted to establish a remote connection.
- OS version—Version of the operating system being used on the host.
Clicking the link with the file name or file path in the Connection to remote host section opens a list in which you can select one of the following actions:
- Find events.
- Find alerts.
- Run the following tasks:
- Copy value to clipboard.
Clicking the link with the file name or file path in the Event initiator section opens a list in which you can select one of the following actions:
- Find events.
- Find alerts.
- Run the following tasks:
- Copy value to clipboard.
Clicking the link with the host name opens a list in which you can select one of the following actions:
- Find events.
- Find alerts.
- Run the following tasks:
- Get data → File, Forensics, Disk image, Memory dump.
- Kill process.
- Delete file.
- Quarantine file.
- Run application.
- Copy value to clipboard.
Clicking the MD5 link opens a list in which you can select one of the following actions:
- Find events.
- Find alerts.
- Find on Kaspersky TIP.
- Find in Storage.
- Create prevention rule.
- Copy value to clipboard.
Clicking the SHA256 link opens a list in which you can select one of the following actions:
- Find events.
- Find alerts.
- Find on Kaspersky TIP.
- Find on virustotal.com.
- Find in Storage.
- Create prevention rule.
- Copy value to clipboard.
Information about the "Prevention rule" event
The window with information about events in which prevention rules were triggered, i. e. events of the Blocked application (prevention rule) type, displays the following details:
- Tree of events.
- Actions that can be performed to handle an event.
- Blocked application (prevention rule) section:
- IOA tags—Information about the results of file analysis using the Targeted Attack Analyzer technology: name of the TAA (IOA) rule that was used to create the alert.
Click the link to display information about the TAA (IOA) rule. If the rule was provided by Kaspersky experts, it contains information about the triggered MITRE technique as well as recommendations for reacting to the event.
The field is displayed if a TAA (IOA) rule was triggered when the event was created.
- File—Name of the file that was prevented from running.
- Launch parameters—Parameters that were used for the attempt to run the file.
- MD5—MD5 hash of the file that was prevented from running.
- SHA256—SHA256 hash of the file that was prevented from running.
- Size—Size of the file that was prevented from running.
- Event time—Time when the file startup prevention was triggered.
- IOA tags—Information about the results of file analysis using the Targeted Attack Analyzer technology: name of the TAA (IOA) rule that was used to create the alert.
- Details section:
- Application name—For example, the name of the operating system.
- Vendor—For example, vendor of the operating system.
- File description—For example, Example File.
- Original file name—For example, ExampleFile.exe.
- Signature subject—Organization that issued the digital certificate of the file.
- Signature validation result—For example, "Signature invalid" or "Signature OK".
- Time created—Creation time of the file that was prevented from running.
- Time modified—Date of last modification of the file that was prevented from running.
- Event initiator section:
- File—Name of the parent process file.
- MD5—MD5 hash of the parent process file.
- SHA256—SHA256 hash of the parent process file.
- Process ID—Identifier of the parent process.
- System info section:
- Host name—Name of the host on which the file startup prevention was triggered.
- Host IP—IP address of the host on which the file startup prevention was triggered.
If you are using dynamic IP addresses, the field displays the IP address assigned to the host at the moment when the event was created.
The application does not support IPv6. If you are using IPv6, the IP address of the host is not displayed.
- User name—Name of the user whose account was used to run the file.
- OS version—Version of the operating system being used on the host.
Clicking the link with the file name or file path opens a list in which you can select one of the following actions:
- Find events.
- Find alerts.
- Run the following tasks:
- Copy value to clipboard.
Clicking the link with the host name opens a list in which you can select one of the following actions:
- Find events.
- Find alerts.
- Run the following tasks:
- Get data → File, Forensics, Disk image, Memory dump.
- Kill process.
- Delete file.
- Quarantine file.
- Run application.
- Copy value to clipboard.
In the information about the event that Kaspersky Endpoint Security for Linux recorded in the event database, you can click the link with the host name to open a list in which you can select one of the following actions:
- Find events.
- Find alerts.
- Run the following tasks:
- Kill process.
- Delete file.
- Get file.
- Quarantine file.
- Run application.
- Copy value to clipboard.
Clicking the MD5 link opens a list in which you can select one of the following actions:
- Find events.
- Find alerts.
- Find on Kaspersky TIP.
- Find in Storage.
- Create prevention rule.
- Copy value to clipboard.
Clicking the SHA256 link opens a list in which you can select one of the following actions:
- Find events.
- Find alerts.
- Find on Kaspersky TIP.
- Find on virustotal.com.
- Find in Storage.
- Create prevention rule.
- Copy value to clipboard.
Information about the "Document blocked" event
The window displaying information about Document blocked events contains the following details:
- Tree of events.
- Actions that can be performed to handle an event.
- Document blocked section:
- IOA tags—Information about the results of file analysis using the Targeted Attack Analyzer technology: name of the TAA (IOA) rule that was used to create the alert.
Click the link to display information about the TAA (IOA) rule. If the rule was provided by Kaspersky experts, it contains information about the triggered MITRE technique as well as recommendations for reacting to the event.
The field is displayed if a TAA (IOA) rule was triggered when the event was created.
- File—Name of the blocked document.
- MD5—MD5 hash of the blocked document.
- SHA256—SHA256 hash of the blocked document.
- Event time—Time when the document was blocked.
- Process file – name of the file of the process that attempted to open the document.
- Process MD5 – MD5 hash of the process that attempted to open the document.
- Process SHA256 – SHA256 hash of the process that attempted to open the document.
- IOA tags—Information about the results of file analysis using the Targeted Attack Analyzer technology: name of the TAA (IOA) rule that was used to create the alert.
- Event initiator section:
- File—Name of the parent process file.
- MD5—MD5 hash of the parent process file.
- SHA256—SHA256 hash of the parent process file.
- Process ID—Identifier of the parent process.
- System info section:
- Host name—Name of the host on which the document was blocked.
- Host IP—IP address of the host on which the document was blocked.
If you are using dynamic IP addresses, the field displays the IP address assigned to the host at the moment when the event was created.
The application does not support IPv6. If you are using IPv6, the IP address of the host is not displayed.
- User name—Name of the user that attempted to open the document.
- OS version—Version of the operating system being used on the host.
Clicking the link with the file name or file path in the Document blocked section opens a list in which you can select one of the following actions:
- Find events.
- Find alerts.
- Run the following tasks:
- Copy value to clipboard.
Clicking the link with the file name or file path in the Event initiator section opens a list in which you can select one of the following actions:
- Find events.
- Find alerts.
- Run the following tasks:
- Copy value to clipboard.
Clicking the link with the host name opens a list in which you can select one of the following actions:
- Find events.
- Find alerts.
- Run the following tasks:
- Get data → File, Forensics, Disk image, Memory dump.
- Kill process.
- Delete file.
- Quarantine file.
- Run application.
- Copy value to clipboard.
In the information about the event that Kaspersky Endpoint Security for Linux recorded in the event database, you can click the link with the host name to open a list in which you can select one of the following actions:
- Find events.
- Find alerts.
- Run the following tasks:
- Kill process.
- Delete file.
- Get file.
- Quarantine file.
- Run application.
- Copy value to clipboard.
Clicking the MD5 link opens a list in which you can select one of the following actions:
- Find events.
- Find alerts.
- Find on Kaspersky TIP.
- Find in Storage.
- Create prevention rule.
- Copy value to clipboard.
Clicking the SHA256 link opens a list in which you can select one of the following actions:
- Find events.
- Find alerts.
- Find on Kaspersky TIP.
- Find on virustotal.com.
- Find in Storage.
- Create prevention rule.
- Copy value to clipboard.
Information about the "File modified" event
The window displaying information about File changed events contains the following details:
- Tree of events.
- Actions that can be performed to handle an event.
- Depending on the type of operation that was performed with the file, one of the following section names is displayed in the event information:
- File created.
- File modified.
- File renamed.
- File attributes modified.
- File deleted.
- File read.
- Hard link created.
- Symbolic link created.
- File creation time modified.
This section may display the following information:
- IOA tags—Information about the results of file analysis using the Targeted Attack Analyzer technology: name of the TAA (IOA) rule that was used to create the alert.
Click the link to display information about the TAA (IOA) rule. If the rule was provided by Kaspersky experts, it contains information about the triggered MITRE technique as well as recommendations for reacting to the event.
The field is displayed if a TAA (IOA) rule was triggered when the event was created.
- File—Name of the created, deleted, or modified file.
- MD5—MD5 hash of the created, deleted, or modified file.
- MD5 of the file referenced by the link—MD5 hash of the file to which the created link points.
- SHA256—SHA256 hash of the created, deleted, or modified file.
- SHA256 of the file referenced by the link—SHA256 hash of the file to which the created link points.
- Symbolic link—Full name of the file to which the created symbolic link points.
- Size—Size of the created, deleted, or modified file.
- Event time—Time when the event was detected.
- Time created—Time when the file was created.
- Time modified—Time of last modification of the file.
- Attributes modification time—Time when file attributes were modified.
- Previous version—Name of the previous version of the file.
The Previous version field is displayed in event details only for operations of the File renamed type.
- Remove file after reboot—Status of the file to be deleted.
If the file to which the "delete" operation was applied is opened in any application or is used by other processes, it is deleted when these processes terminate after a restart of the host. In this case, Remove file after reboot displays Yes.
If the file to which the "delete" operation was applied was deleted immediately, the Remove file after reboot field displays No.
The Remove file after reboot field is displayed in event details only for operations of the File deleted type.
If the event was logged in the event database by Kaspersky Endpoint Security for Linux or Kaspersky Endpoint Security for Mac, the section also includes the following fields:
- File type—Extension of the created, deleted, or modified file.
- File open flags—Value of the open flags for the created, deleted, or modified file.
- Owner user name—Name of the user that created the file.
- Owner group name—Name of the group whose users can modify or delete the file.
- File permitted capabilities—Permissions that can be used to gain access to a created, deleted, or modified file. This field is not displayed if the event was recorded by Kaspersky Endpoint Security for Mac.
- File inheritable capabilities—Permissions that a user group has to perform operations on the parent directory of the created, deleted, or modified file. This field is not displayed if the event was recorded by Kaspersky Endpoint Security for Mac.
- File effective capabilities—Permissions that are relevant to the created, deleted, or modified file at the current moment. This field is not displayed if the event was recorded by Kaspersky Endpoint Security for Mac.
- Event initiator section:
- File—Path to the parent process file.
- MD5—MD5 hash of the parent process file.
- SHA256—SHA256 hash of the parent process file.
If the event was logged in the event database by Kaspersky Endpoint Security for Linux or Kaspersky Endpoint Security for Mac, the Event initiator section also includes the following fields:
- Environment variables—Environment variables of the process.
- Real user name—Name of the user assigned when registering in the system.
- Real group name—Group to which the user belongs.
- Effective user name—User name that was used to log in to the system.
- Effective group name—Group of the user whose name was used to log in to the system.
- System info section:
- Host name—Name of the host on which the file was created.
- Host IP—IP address of the host on which the file was created.
If you are using dynamic IP addresses, the field displays the IP address assigned to the host at the moment when the event was created.
The application does not support IPv6. If you are using IPv6, the IP address of the host is not displayed.
- User name—Name of the user that created the file.
- OS version—Version of the operating system that is being used on the host.
If the event was logged in the event database by Kaspersky Endpoint Security for Linux or Kaspersky Endpoint Security for Mac, the System info section also displays the Logon from remote host field for the name of host from which the remote logon was performed.
Clicking the link with the file name or path to the file in the section with information about the file with which the operation was performed opens a list in which you can select one of the following actions:
- Find events.
- Find alerts.
- Run the following tasks:
- Copy value to clipboard.
Clicking the link with the file name or file path in the Event initiator section opens a list in which you can select one of the following actions:
- Find events.
- Find alerts.
- Run the following tasks:
- Copy value to clipboard.
In the information about the event that Kaspersky Endpoint Security for Linux or Kaspersky Endpoint Security for Mac recorded in the event database, you can click the links with the file name or file path to open a list in which you can select one of the following actions:
- Find events.
- Find alerts.
- Run the Get file task.
- Copy value to clipboard.
Clicking the link with the host name opens a list in which you can select one of the following actions:
- Find events.
- Find alerts.
- Run the following tasks:
- Get data → File, Forensics, Disk image, Memory dump.
- Kill process.
- Delete file.
- Quarantine file.
- Run application.
- Copy value to clipboard.
In the information about the event that Kaspersky Endpoint Security for Linux recorded in the event database, you can click the link with the host name to open a list in which you can select one of the following actions:
- Find events.
- Find alerts.
- Run the following tasks:
- Kill process.
- Delete file.
- Get file.
- Quarantine file.
- Run application.
- Copy value to clipboard.
In the information about the event that Kaspersky Endpoint Security for Mac recorded in the event database, you can click the links with the file name or file path to open a list in which you can select one of the following actions:
- Find events.
- Find alerts.
- Run the Get file task.
- Copy value to clipboard.
Clicking the MD5 link opens a list in which you can select one of the following actions:
- Find events.
- Find alerts.
- Find on Kaspersky TIP.
- Find in Storage.
- Create prevention rule.
- Copy value to clipboard.
Clicking the SHA256 link opens a list in which you can select one of the following actions:
- Find events.
- Find alerts.
- Find on Kaspersky TIP.
- Find on virustotal.com.
- Find in Storage.
- Create prevention rule.
- Copy value to clipboard.
Information about the "System event log" event
The window displaying information about System event log events contains the following details:
- Tree of events.
- Actions that can be performed to handle an event.
- System event log section:
- IOA tags—Information about the results of file analysis using the Targeted Attack Analyzer technology: name of the TAA (IOA) rule that was used to create the alert.
Click the link to display information about the TAA (IOA) rule. If the rule was provided by Kaspersky experts, it contains information about the triggered MITRE technique as well as recommendations for reacting to the event.
The field is displayed if a TAA (IOA) rule was triggered when the event was created.
- Event time—Time when the event was detected.
- Security event ID—Identifier of the type of security event in the Windows log.
If the event was logged in the event database by Kaspersky Endpoint Security for Linux, the System event log section also includes the following fields:
- Event type—Type of the event.
- Operation result—For example, Success or Failed.
- IOA tags—Information about the results of file analysis using the Targeted Attack Analyzer technology: name of the TAA (IOA) rule that was used to create the alert.
- The Event data section containing information from the system log. The scope of data depends on the type of Windows event.
The Event data section is not displayed in information about events logged to the event database by Kaspersky Endpoint Agent for Linux.
- Event initiator section:
- File—Process file name.
- Process ID—Process identifier.
- Command—Command used to run the parent process.
- Environment variables—Environment variables of the process.
- Real user name—Name of the user assigned when registering in the system.
- Real group name—Group to which the user belongs.
The Event initiator section is not displayed in information about events logged to events database by Kaspersky Endpoint Agent for Windows or Kaspersky Endpoint Security for Windows.
- System info section:
- Host name—Name of the host on which the event occurred.
- Host IP—IP address of the host on which the event took place.
If you are using dynamic IP addresses, the field displays the IP address assigned to the host at the moment when the event was created.
The application does not support IPv6. If you are using IPv6, the IP address of the host is not displayed.
- User name—Name of the user who started the process that initiated the system log record.
- OS version—Version of the operating system that is being used on the host.
Event information logged to events database by Kaspersky Endpoint Security for Linux also includes the Logon from remote host field, that is, the name of the host from which remote logon was performed.
In the information about the event that Kaspersky Endpoint Security for Linux recorded in the event database, you can click the links with the file name or file path to open a list in which you can select one of the following actions:
- Find events.
- Find alerts.
- Run the Get file task.
- Copy value to clipboard.
Clicking the link with the host name opens a list in which you can select one of the following actions:
- Find events.
- Find alerts.
- Run the following tasks:
- Get data → File, Forensics, Disk image, Memory dump.
- Kill process.
- Delete file.
- Quarantine file.
- Run application.
- Copy value to clipboard.
In the information about the event that Kaspersky Endpoint Security for Linux recorded in the event database, you can click the link with the host name to open a list in which you can select one of the following actions:
- Find events.
- Find alerts.
- Run the following tasks:
- Kill process.
- Delete file.
- Get file.
- Quarantine file.
- Run application.
- Copy value to clipboard.
Information about the "Changes in the registry" event
The window displaying information about Registry modified events contains the following details:
- Tree of events.
- Actions that can be performed to handle an event.
- Depending on the type of operation that was performed with the registry, one of the following section names is displayed in the event information:
- Registry key created
- Registry key deleted
- Registry modified
- Registry key queried
- Registry key renamed
- Registry key saved
This section displays the following information:
- IOA tags—Information about the results of file analysis using the Targeted Attack Analyzer technology: name of the TAA (IOA) rule that was used to create the alert.
Click the link to display information about the TAA (IOA) rule. If the rule was provided by Kaspersky experts, it contains information about the triggered MITRE technique as well as recommendations for reacting to the event.
The field is displayed if a TAA (IOA) rule was triggered when the event was created.
- File is the full path to the file to which the registry key was saved.
This field is displayed for events of the Registry key saved type.
- Key path is the path to the registry key that was modified
- Value name: for example, RegistrySizeLimit
- Value data is the value of the registry entry
- Value type: for example, REG_DWORD
- Event time is the time of registry modification
When changing the name or value of a registry key, you may see additional fields containing information about the state of the registry key prior to its modification:
- The Previous key path field is displayed when the name of the registry key is modified.
- The Previous value data field is displayed when the registry value is modified.
- The Previous value type field is displayed when the type of the registry value is modified.
If you are using Kaspersky Endpoint Agent as the Endpoint Agent component, Kaspersky Anti Targeted Attack Platform receives the data required to populate the Previous key path, Previous value data, Previous value type fields only when Kaspersky Anti Targeted Attack Platform is integrated with the Kaspersky Endpoint Agent for Windows application version 3.10 and higher. When integrating the application with older versions of the Kaspersky Endpoint Agent, the fields are not displayed in the event information.
- Event initiator section:
- File—Path to the parent process file.
Clicking the link with the file name or file path opens a list in which you can select one of the following actions:
- Find events.
- Find alerts.
- Copy value to clipboard.
Run the following tasks:
- MD5—MD5 hash of the parent process file.
Clicking the MD5 link opens a list in which you can select one of the following actions:
- Find events.
- Find alerts.
- Find on Kaspersky TIP.
- Find in Storage.
- Create prevention rule.
Copy value to clipboard.
- SHA256—SHA256 hash of the parent process file.
Clicking the SHA256 link opens a list in which you can select one of the following actions:
- Find events.
- Find alerts.
- Find on Kaspersky TIP.
- Find in Storage.
- Create prevention rule.
- Copy value to clipboard.
- File—Path to the parent process file.
- System info section:
- Host name—Name of the host on which the registry modification was made.
Clicking the link with the host name opens a list in which you can select one of the following actions:
- Find events.
- Find alerts.
- Copy value to clipboard.
Run the following tasks:
- Get data → File, Forensics, Disk image, Memory dump.
- Kill process.
- Delete file.
- Quarantine file.
- Run application.
- Host IP—IP address of the host on which the registry modification was made.
If you are using dynamic IP addresses, the field displays the IP address assigned to the host at the moment when the event was created.
The application does not support IPv6. If you are using IPv6, the IP address of the host is not displayed.
- User name—Name of the user that made the change in the registry.
- OS version—Version of the operating system being used on the host.
- Host name—Name of the host on which the registry modification was made.
You can view information about the modification of the selected register key by editing or replacing the Kaspersky Anti Targeted Attack Platform configuration file. To edit or replace the configuration file of the application, you must contact Technical Support.
You are strongly advised not to perform any operations with the Kaspersky Anti Targeted Attack Platform configuration file in Technical Support Mode without advice or instructions from Technical Support staff.
Information about the "Port listened" event
The window displaying information about Port listened events contains the following details:
- Tree of events.
- Actions that can be performed to handle an event.
- Port listened section:
- IOA tags—Information about the results of file analysis using the Targeted Attack Analyzer technology: name of the TAA (IOA) rule that was used to create the alert.
Click the link to display information about the TAA (IOA) rule. If the rule was provided by Kaspersky experts, it contains information about the triggered MITRE technique as well as recommendations for reacting to the event.
The field is displayed if a TAA (IOA) rule was triggered when the event was created.
- Local port—Port that was listened to.
- Local IP—IP address of the network interface whose port was listened to.
- Event time—Port listening time.
- IOA tags—Information about the results of file analysis using the Targeted Attack Analyzer technology: name of the TAA (IOA) rule that was used to create the alert.
- Event initiator section:
- File—Path to the parent process file.
Clicking the link with the file name or file path opens a list in which you can select one of the following actions:
- Find events.
- Find alerts.
- Copy value to clipboard.
Run the following tasks:
- MD5—MD5 hash of the parent process file.
Clicking the MD5 link opens a list in which you can select one of the following actions:
- Find events.
- Find alerts.
- Find on Kaspersky TIP.
- Find in Storage.
- Create prevention rule.
- Copy value to clipboard.
- SHA256—SHA256 hash of the parent process file.
Clicking the SHA256 link opens a list in which you can select one of the following actions:
- Find events.
- Find alerts.
- Find on Kaspersky TIP.
- Find in Storage.
- Create prevention rule.
- Copy value to clipboard.
- File—Path to the parent process file.
- System info section:
- Host name—Name of the host whose port was listened to.
Clicking the link with the host name opens a list in which you can select one of the following actions:
- Find events.
- Find alerts.
- Copy value to clipboard.
Run the following tasks:
- Get data → File, Forensics, Disk image, Memory dump.
- Kill process.
- Delete file.
- Quarantine file.
- Run application.
- Host IP—IP address of the host whose port was listened.
If you are using dynamic IP addresses, the field displays the IP address assigned to the host at the moment when the event was created.
The application does not support IPv6. If you are using IPv6, the IP address of the host is not displayed.
- User name—Name of the user whose account was used to listen to the port.
- OS version—Version of the operating system that is being used on the host.
- Host name—Name of the host whose port was listened to.
Information about the "Driver loaded" event
The window displaying information about Driver loaded events contains the following details:
- Tree of events.
- Actions that can be performed to handle an event.
- Driver loaded section:
- IOA tags—Information about the results of file analysis using the Targeted Attack Analyzer technology: name of the TAA (IOA) rule that was used to create the alert.
Click the link to display information about the TAA (IOA) rule. If the rule was provided by Kaspersky experts, it contains information about the triggered MITRE technique as well as recommendations for reacting to the event.
The field is displayed if a TAA (IOA) rule was triggered when the event was created.
- File—Name of the loaded driver file.
- MD5—MD5 hash of the loaded driver file.
- SHA256—SHA256 hash of the loaded driver file.
- Size—Size of the loaded driver.
- Event time—Time when the driver was loaded.
- IOA tags—Information about the results of file analysis using the Targeted Attack Analyzer technology: name of the TAA (IOA) rule that was used to create the alert.
- Details section:
- Application name—For example, the name of the operating system.
- Vendor—For example, vendor of the operating system.
- File description—For example, Example File.
- Original file name—For example, ExampleFile.exe.
- Signature subject—Organization that issued the digital certificate of the file.
- Signature validation result—For example, "Signature invalid" or "Signature OK".
- Time created—Creation time of the loaded driver.
- Time modified—Time of last modification of the loaded driver.
- System info section:
- Host name—Name of the host on which the driver was loaded.
- Host IP—IP address of the host to which the driver was loaded.
If you are using dynamic IP addresses, the field displays the IP address assigned to the host at the moment when the event was created.
The application does not support IPv6. If you are using IPv6, the IP address of the host is not displayed.
- User name—Name of the user that loaded the driver.
- OS version—Version of the operating system being used on the host.
Clicking the link with the file name or file path opens a list in which you can select one of the following actions:
- Find events.
- Find alerts.
- Run the following tasks:
- Copy value to clipboard.
Clicking the link with the host name opens a list in which you can select one of the following actions:
- Find events.
- Find alerts.
- Run the following tasks:
- Get data → File, Forensics, Disk image, Memory dump.
- Kill process.
- Delete file.
- Quarantine file.
- Run application.
- Copy value to clipboard.
Clicking the MD5 link opens a list in which you can select one of the following actions:
- Find events.
- Find alerts.
- Find on Kaspersky TIP.
- Find in Storage.
- Create prevention rule.
- Copy value to clipboard.
Clicking the SHA256 link opens a list in which you can select one of the following actions:
- Find events.
- Find alerts.
- Find on Kaspersky TIP.
- Find on virustotal.com.
- Find in Storage.
- Create prevention rule.
- Copy value to clipboard.
Information about the "DNS" event
The window displaying information about DNS events contains the following details:
- Tree of events.
- Actions that can be performed to handle an event.
- DNS section:
- IOA tags—Information about the results of file analysis using the Targeted Attack Analyzer technology: name of the TAA (IOA) rule that was used to create the alert.
Click the link to display information about the TAA (IOA) rule. If the rule was provided by Kaspersky experts, it contains information about the triggered MITRE technique as well as recommendations for reacting to the event.
The field is displayed if a TAA (IOA) rule was triggered when the event was created.
- Server IP—IPv4 address of the DNS server.
- Query options—DNS query options.
- Request status—Status of the DNS query.
- Domain name—Name of the domain for which the DNS record is to be resolved.
- Record type ID—Type of resource record.
- Response data—Contents of the DNS server response to the query.
- Event time—Time when the DNS query was sent.
- IOA tags—Information about the results of file analysis using the Targeted Attack Analyzer technology: name of the TAA (IOA) rule that was used to create the alert.
- Event initiator section:
- File—Name of the parent process file.
- MD5—MD5 hash of the parent process file.
- SHA256—SHA256 hash of the parent process file.
- Process ID—Identifier of the parent process.
If the event was logged in the event database by Kaspersky Endpoint Agent for Linux, the Event initiator section also includes the following fields:
- Environment variables—Environment variables of the process.
- Real user name—Name of the user assigned when registering in the system.
- Real group name—Group to which the user belongs.
- Effective user name—User name that was used to log in to the system.
- Effective group name—Group of the user whose name was used to log in to the system.
- System info section:
- Host name—Name of the host from which the query to the DNS server was issued.
- Host IP—IP address of the host from which the query to the DNS server was issued.
If you are using dynamic IP addresses, the field displays the IP address assigned to the host at the moment when the event was created.
The application does not support IPv6. If you are using IPv6, the IP address of the host is not displayed.
- Logon from remote host—Name of the host that was used to remotely log in to the system.
- User name—Name of the user that issued the query to the DNS server.
- OS version—Version of the operating system that is being used on the host.
Links with the server IP address, record type ID, and user name open a list in which you can do one of the following:
- Find alerts.
- Copy value to clipboard.
Clicking the link with the domain name opens a list in which you can do one of the following:
- Find events.
- Find alerts.
- Find on Kaspersky TIP.
- Copy value to clipboard.
Clicking the link with the file name or file path opens a list in which you can select one of the following actions:
- Find events.
- Find alerts.
- Run the following tasks:
- Copy value to clipboard.
Clicking the MD5 link opens a list in which you can select one of the following actions:
- Find events.
- Find alerts.
- Find on Kaspersky TIP.
- Find in Storage.
- Create prevention rule.
- Copy value to clipboard.
Clicking the SHA256 link opens a list in which you can select one of the following actions:
- Find events.
- Find alerts.
- Find on Kaspersky TIP.
- Find on virustotal.com.
- Find in Storage.
- Create prevention rule.
- Copy value to clipboard.
Clicking the link with the host name opens a list in which you can select one of the following actions:
- Find events.
- Find alerts.
- Run the following tasks:
- Get data → File, Forensics, Disk image, Memory dump.
- Kill process.
- Delete file.
- Quarantine file.
- Run application.
- Copy value to clipboard.
In the information about the event that Kaspersky Endpoint Security for Linux recorded in the event database, you can click the link with the host name to open a list in which you can select one of the following actions:
- Find events.
- Find alerts.
- Run the following tasks:
- Kill process.
- Delete file.
- Get file.
- Quarantine file.
- Run application.
- Copy value to clipboard.
Clicking the link with the IP address of the host opens a list in which you can select one of the following actions:
- Find events.
- Find alerts.
- Copy value to clipboard.
Information about the "LDAP" event
The window displaying information about LDAP events contains the following details:
- Tree of events.
- Actions that can be performed to handle an event.
- LDAP section:
- IOA tags—Information about the results of file analysis using the Targeted Attack Analyzer technology: name of the TAA (IOA) rule that was used to create the alert.
Click the link to display information about the TAA (IOA) rule. If the rule was provided by Kaspersky experts, it contains information about the triggered MITRE technique as well as recommendations for reacting to the event.
The field is displayed if a TAA (IOA) rule was triggered when the event was created.
- Search scope—LDAP search scope. Can have one of the following values: ADS_SCOPE_BASE, ADS_SCOPE_ONELEVEL, ADS_SCOPE_SUBTREE.
- Search filter—LDAP search filter.
- Distinguished name—Name of the LDAP directory entry.
- Search attribute list—Attributes specified in the search query as values to be returned.
- Launch parameters—Process startup settings.
- IOA tags—Information about the results of file analysis using the Targeted Attack Analyzer technology: name of the TAA (IOA) rule that was used to create the alert.
- Event initiator section:
- File—Name of the parent process file.
- MD5—MD5 hash of the parent process file.
- SHA256—SHA256 hash of the parent process file.
- System info section:
- Host name—Name of the host on which the LDAP search was performed.
- User name—Name of the user whose account was used to run the LDAP search.
- OS version—Version of the operating system that is being used on the host.
Information about the "Named pipe" event
The window displaying information about Named pipe events contains the following details:
- Tree of events.
- Actions that can be performed to handle an event.
Depending on the type of the named pipe operation, one of the following section names is displayed in the event information:
- Pipe created
- Pipe connected
This section displays the following information:
- IOA tags—Information about the results of file analysis using the Targeted Attack Analyzer technology: name of the TAA (IOA) rule that was used to create the alert.
Click the link to display information about the TAA (IOA) rule. If the rule was provided by Kaspersky experts, it contains information about the triggered MITRE technique as well as recommendations for reacting to the event.
The field is displayed if a TAA (IOA) rule was triggered when the event was created.
- File—File name of the process that created or connected to the named pipe.
- Event time—Time when the named pipe was created or connected to.
- Event initiator section:
- File—Name of the parent process file.
- MD5—MD5 hash of the parent process file.
- SHA256—SHA256 hash of the parent process file.
- System info section:
- Host name—Name of the host on which the named pipe was created or connected to.
- User name—Name of the user that created or connected to the named pipe.
- OS version—Version of the operating system that is being used on the host.
Clicking the link with the pipe name opens a list in which you can do one of the following:
- Find alerts.
- Copy value to clipboard.
Clicking the link with the file name or file path opens a list in which you can select one of the following actions:
- Find events.
- Find alerts.
- Run the following tasks:
- Copy value to clipboard.
Clicking the MD5 link opens a list in which you can select one of the following actions:
- Find events.
- Find alerts.
- Find on Kaspersky TIP.
- Find in Storage.
- Create prevention rule.
- Copy value to clipboard.
Clicking the SHA256 link opens a list in which you can select one of the following actions:
- Find events.
- Find alerts.
- Find on Kaspersky TIP.
- Find on virustotal.com.
- Find in Storage.
- Create prevention rule.
- Copy value to clipboard.
Clicking the link with the host name opens a list in which you can select one of the following actions:
- Find events.
- Find alerts.
- Run the following tasks:
- Get data → File, Forensics, Disk image, Memory dump.
- Kill process.
- Delete file.
- Quarantine file.
- Run application.
- Copy value to clipboard.
Clicking the link with the IP address of the host opens a list in which you can select one of the following actions:
- Find events.
- Find alerts.
- Copy value to clipboard.
Clicking the link with the user name opens a list in which you can do one of the following:
- Find alerts.
- Copy value to clipboard.
Information about the "WMI" event
The window displaying information about WMI events contains the following details:
- Tree of events.
- Actions that can be performed to handle an event.
Depending on the type of the operation, one of the following section names is displayed in the event information:
- WMI activity
- WMI event consumer name
The WMI activity section displays the following information:
- IOA tags—Information about the results of file analysis using the Targeted Attack Analyzer technology: name of the TAA (IOA) rule that was used to create the alert.
Click the link to display information about the TAA (IOA) rule. If the rule was provided by Kaspersky experts, it contains information about the triggered MITRE technique as well as recommendations for reacting to the event.
The field is displayed if a TAA (IOA) rule was triggered when the event was created.
- Connection to remote host—Remote start of the WMI service. If the service was started remotely, the field displays Yes.
- Machine name—Name of the host on which the WMI service was started.
- User name—Name of the user that started the WMI service.
- Namespace—WMI namespace.
- Query—Command that was used to start the WMI service.
The WMI activity section displays the following information:
- Connection to remote host—Remote start of the WMI service. If the service was started remotely, the field displays Yes.
- Namespace—Namespace of the event consumer.
- Event filter name—Name of the filter of the event consumer. This field is displayed for the WMI activity event type.
- Event consumer name—Name of the created event consumer.
- Event consumer description—Description of the created event consumer. This field is displayed for the WMI event consumer name event type.
- Event initiator section:
- File—Name of the parent process file.
- Launch parameters—Parent process startup settings.
- MD5—MD5 hash of the parent process file.
- SHA256—SHA256 hash of the parent process file.
- System info section:
- Host name—Name of the host on which the WMI service was started or the event consumer was created.
- Host IP—IP address of the host on which the WMI service was started or the event consumer was created.
- User name—Name of the user that started the WMI service or created the event consumer.
- OS version—Version of the operating system that is being used on the host.
Information about the "Alert" event
The window showing information about a Detection type event contains the following details:
- Tree of events.
- Actions that can be performed to handle an event.
- On the Details tab, in the Detection section:
- IOA tags—Information about the results of file analysis using the Targeted Attack Analyzer technology: name of the TAA (IOA) rule that was used to create the alert.
Click the link to display information about the TAA (IOA) rule. If the rule was provided by Kaspersky experts, it contains information about the triggered MITRE technique as well as recommendations for reacting to the event.
The field is displayed if a TAA (IOA) rule was triggered when the event was created.
- Detect—Name of the detected object.
Clicking the link with the object name opens a list in which you can select one of the following actions:
- Find events.
- View on Kaspersky Threats.
- Copy value to clipboard.
- Last action—Last action taken on the detected object.
- Object name—Full name of the file in which the object was detected.
- MD5—MD5 hash of the file in which the object was detected.
- SHA256—SHA256 hash of the file in which the object was detected.
- Object type—Type of object (for example, a file).
- Detection mode—Scan mode in which the alert was generated.
- Event time—Date and time of the event.
- Record ID—ID of the record of the alert in the database.
- Database version—Version of the database used to generate the alert.
- Content—Contents of the script sent to be scanned.
You can download this data by clicking Save to file.
- IOA tags—Information about the results of file analysis using the Targeted Attack Analyzer technology: name of the TAA (IOA) rule that was used to create the alert.
- On the Details tab, in the Event initiator section:
- File—Path to the parent process file.
Clicking the link with the file name or file path opens a list in which you can select one of the following actions:
- Find events.
- Find alerts.
- Copy value to clipboard.
Run the following tasks:
- Process ID—Identifier of the parent process.
- Launch parameters—Parent process startup settings.
- MD5—MD5 hash of the parent process file.
- SHA256—SHA256 hash of the parent process file.
- File—Path to the parent process file.
- On the Details tab, in the System info section:
- Host name—Name of the host on which the alert was generated.
Clicking the link with the host name opens a list in which you can select one of the following actions:
- Find events.
- Find alerts.
- Copy value to clipboard.
Run the following tasks:
- Get data → File, Forensics, Disk image, Memory dump.
- Kill process.
- Delete file.
- Quarantine file.
- Run application.
In the information about the event that Kaspersky Endpoint Security for Linux recorded in the event database, you can click the link with the host name to open a list in which you can select one of the following actions:
- Find events.
- Find alerts.
- Run tasks: Get file, Delete file, Quarantine file, Run application.
- Copy value to clipboard.
In the information about the event that Kaspersky Endpoint Security for Mac recorded in the event database, you can click the links with the file name or file path to open a list in which you can select one of the following actions:
- Find events.
- Find alerts.
- Run the Get file task.
- Copy value to clipboard.
- Host IP—IP address of the host on which the alert was generated.
If you are using dynamic IP addresses, the field displays the IP address assigned to the host at the moment when the event was created.
The application does not support IPv6. If you are using IPv6, the IP address of the host is not displayed.
- User name—User account used to complete the action taken on the detected object.
- OS version—Version of the operating system that is being used on the host.
- Host name—Name of the host on which the alert was generated.
- On the History tab, in the table:
- Type—Type of event: Detection or Detection processing result.
- Description—Description of the event.
- Time—Date and time of detection and alert processing result.
Clicking the MD5 link opens a list in which you can select one of the following actions:
- Find events.
- Find alerts.
- Find on Kaspersky TIP.
- Find in Storage.
- Create prevention rule.
- Copy value to clipboard.
Clicking the SHA256 link opens a list in which you can select one of the following actions:
- Find events.
- Find alerts.
- Find on Kaspersky TIP.
- Find on virustotal.com.
- Find in Storage.
- Create prevention rule.
- Copy value to clipboard.
Information about the "Alert processing result" event
The window showing information about a Detection processing result type event contains the following details:
- Tree of events.
- Actions that can be performed to handle an event.
- On the Details tab, under Detection processing result:
- IOA tags—Information about the results of file analysis using the Targeted Attack Analyzer technology: name of the TAA (IOA) rule that was used to create the alert.
Click the link to display information about the TAA (IOA) rule. If the rule was provided by Kaspersky experts, it contains information about the triggered MITRE technique as well as recommendations for reacting to the event.
The field is displayed if a TAA (IOA) rule was triggered when the event was created.
- Detect—Name of the detected object.
Clicking the link with the object name opens a list in which you can select one of the following actions:
- Find events.
- View on Kaspersky Threats.
- Copy value to clipboard.
- Last action—Last action taken on the detected object.
- MD5—MD5 hash of the file in which the object was detected.
- SHA256—SHA256 hash of the file in which the object was detected.
- Object type—Type of object (for example, a file).
- Object name—Full name of the file in which the object was detected.
- Detection mode—Scan mode in which the alert was generated.
- Event time—Date and time of the event.
- Record ID—ID of the record of the alert in the database.
- Database version—Version of the database used to generate the alert.
- IOA tags—Information about the results of file analysis using the Targeted Attack Analyzer technology: name of the TAA (IOA) rule that was used to create the alert.
- On the Details tab, under Event initiator:
- File—Path to the parent process file.
Clicking the link with the file name or file path opens a list in which you can select one of the following actions:
- Find events.
- Find alerts.
- Copy value to clipboard.
Run the following tasks:
- Process ID—Identifier of the parent process.
- Launch parameters—Parent process startup settings.
- MD5—MD5 hash of the parent process file.
- SHA256—SHA256 hash of the parent process file.
- File—Path to the parent process file.
- On the Details tab, under System info:
- Host name—Name of the host on which the alert was generated.
Clicking the link with the host name opens a list in which you can select one of the following actions:
- Find events.
- Find alerts.
- Copy value to clipboard.
Run the following tasks:
- Get data → File, Forensics, Disk image, Memory dump.
- Kill process.
- Delete file.
- Quarantine file.
- Host IP—IP address of the host on which the alert was generated.
If you are using dynamic IP addresses, the field displays the IP address assigned to the host at the moment when the event was created.
The application does not support IPv6. If you are using IPv6, the IP address of the host is not displayed.
- User name—User account used to complete the action taken on the detected object.
- OS version—Version of the operating system that is being used on the host.
- Host name—Name of the host on which the alert was generated.
- On the History tab, in the table:
- Type is the type of the Detection processing result event.
- Description—Description of the event.
- Time is the date and time of the alert processing result.
Clicking the MD5 link opens a list in which you can select one of the following actions:
- Find events.
- Find alerts.
- Find on Kaspersky TIP.
- Find in Storage.
- Create prevention rule.
- Copy value to clipboard.
Clicking the SHA256 link opens a list in which you can select one of the following actions:
- Find events.
- Find alerts.
- Find on Kaspersky TIP.
- Find on virustotal.com.
- Find in Storage.
- Create prevention rule.
- Copy value to clipboard.
Information about the "Interpreted file run" event
The window displaying information about Process: interpreted file run events contains the following details:
- Tree of events.
- Actions that can be performed to handle an event.
- Process: interpreted file run section:
- IOA tags—Information about the results of file analysis using the Targeted Attack Analyzer technology: name of the TAA (IOA) rule that was used to create the alert.
Click the link to display information about the TAA (IOA) rule. If the rule was provided by Kaspersky experts, it contains information about the triggered MITRE technique as well as recommendations for reacting to the event.
The field is displayed if a TAA (IOA) rule was triggered when the event was created.
- File—Name of the file.
- MD5—MD5 hash of a file.
- SHA256—SHA256 hash of a file.
- Size—Size of the file.
- Time created—Time when the file was created.
- Time modified—Time of last modification of the file.
- IOA tags—Information about the results of file analysis using the Targeted Attack Analyzer technology: name of the TAA (IOA) rule that was used to create the alert.
- Event initiator section:
- File—Path to the parent process file.
- MD5—MD5 hash of the parent process file.
- SHA256—SHA256 hash of the parent process file.
- Process ID—Identifier of the parent process.
- System info section:
- Host name—Name of the host on which the file was run.
- Host IP—IP address of the host on which the file was run.
If you are using dynamic IP addresses, the field displays the IP address assigned to the host at the moment when the event was created.
The application does not support IPv6. If you are using IPv6, the IP address of the host is not displayed.
- User name—Name of the user whose account was used to run the file.
- OS version—Version of the operating system being used on the host.
Clicking the link with the file name or file path in the Process: interpreted file run section opens a list in which you can select one of the following actions:
- Find events.
- Find alerts.
- Run the following tasks:
- Copy value to clipboard.
Clicking the link with the file name or file path in the Event initiator section opens a list in which you can select one of the following actions:
- Find events.
- Find alerts.
- Run the following tasks:
- Copy value to clipboard.
Clicking the link with the host name opens a list in which you can select one of the following actions:
- Find events.
- Find alerts.
- Run the following tasks:
- Get data → File, Forensics, Disk image, Memory dump.
- Kill process.
- Delete file.
- Quarantine file.
- Run application.
- Copy value to clipboard.
Clicking the MD5 link opens a list in which you can select one of the following actions:
- Find events.
- Find alerts.
- Find on Kaspersky TIP.
- Find in Storage.
- Create prevention rule.
- Copy value to clipboard.
Clicking the SHA256 link opens a list in which you can select one of the following actions:
- Find events.
- Find alerts.
- Find on Kaspersky TIP.
- Find on virustotal.com.
- Find in Storage.
- Create prevention rule.
- Copy value to clipboard.
Information about the "AMSI scan" event
The window showing information about an AMSI scan event contains the following details:
- Tree of events.
- Actions that can be performed to handle an event.
- In the AMSI scan section:
- IOA tags—Information about the results of file analysis using the Targeted Attack Analyzer technology: name of the TAA (IOA) rule that was used to create the alert.
Click the link to display information about the TAA (IOA) rule. If the rule was provided by Kaspersky experts, it contains information about the triggered MITRE technique as well as recommendations for reacting to the event.
The field is displayed if a TAA (IOA) rule was triggered when the event was created.
- Object name—Name of the scanned object.
- MD5—MD5 hash of the scanned object.
- SHA256—SHA256 hash of the scanned object.
- Event time—Date and time of the event.
- Content type—Type of script.
The application provides two types of scripts:
- If the script is presented as text, the Content type field shows the Text script type.
- If the script is presented in another format, the Content type field displays the Binary script type.
- Content—Contents of the script sent to be scanned.
You can copy this data by clicking Copy to clipboard if the data is presented as text or download a file containing the data by clicking Save to file if the data has a different format.
The Content field is displayed in the event information if the application registers signs of targeted attacks.
- IOA tags—Information about the results of file analysis using the Targeted Attack Analyzer technology: name of the TAA (IOA) rule that was used to create the alert.
- In the Event initiator section:
- File—Path to the parent process file.
Clicking the link with the file name or file path opens a list in which you can select one of the following actions:
- Find events.
- Find alerts.
- Copy value to clipboard.
Run the following tasks:
- MD5—MD5 hash of the parent process file.
Clicking the MD5 link opens a list in which you can select one of the following actions:
- Find events.
- Find alerts.
- Find on Kaspersky TIP.
- Find in Storage.
- Create prevention rule.
- Copy value to clipboard.
- SHA256—SHA256 hash of the parent process file.
Clicking the SHA256 link opens a list in which you can select one of the following actions:
- Find events.
- Find alerts.
- Find on Kaspersky TIP.
- Find in Storage.
- Create prevention rule.
- Copy value to clipboard.
- File—Path to the parent process file.
- In the System info section:
- Host name—Name of the host on which the alert was generated.
Clicking the link with the host name opens a list in which you can select one of the following actions:
- Find events.
- Find alerts.
- Copy value to clipboard.
Run the following tasks:
- Get data → File, Forensics, Disk image, Memory dump.
- Kill process.
- Delete file.
- Quarantine file.
- Run application.
- Host IP—IP address of the host on which the alert was created.
If you are using dynamic IP addresses, the field displays the IP address assigned to the host at the moment when the event was created.
The application does not support IPv6. If you are using IPv6, the IP address of the host is not displayed.
- User name—User account that was used to make the change in the registry.
- OS version—Version of the operating system that is being used on the host.
- Host name—Name of the host on which the alert was generated.
Information about the "Interactive command input at the console" event
The window displaying information about Process: console interactive input events contains the following details:
- Tree of events.
- Actions that can be performed to handle an event.
- Process: console interactive input section:
- IOA tags—Information about the results of file analysis using the Targeted Attack Analyzer technology: name of the TAA (IOA) rule that was used to create the alert.
Click the link to display information about the TAA (IOA) rule. If the rule was provided by Kaspersky experts, it contains information about the triggered MITRE technique as well as recommendations for reacting to the event.
The field is displayed if a TAA (IOA) rule was triggered when the event was created.
- Input type—Type of input of commands that were passed to the console application.
The application provides two ways to enter commands:
- If commands were entered by the user in the console application, the Input type field displays the Console command input type.
- If commands were passed to the console application from another application through a pipe, the Input type field displays the Pipe command input type.
If you are using the Kaspersky Endpoint Agent application as the Endpoint Agent component, Kaspersky Anti Targeted Attack Platform receives the data required to populate the Input field only when Kaspersky Anti Targeted Attack Platform is integrated with Kaspersky Endpoint Agent 3.10 for Windows. When integrating the application with older versions of the Kaspersky Endpoint Agent for Windows application, the field is not displayed in the event information.
- Input text—Text entered at the command line (for example, CMD) on the host with the Kaspersky Endpoint Agent for Windows application.
You can copy this text by clicking the Copy to clipboard button located in the Input text field.
- Event time—Time when the event was detected.
- IOA tags—Information about the results of file analysis using the Targeted Attack Analyzer technology: name of the TAA (IOA) rule that was used to create the alert.
- Event initiator section:
- File—Path to the parent process file.
Clicking the link with the file name or file path opens a list in which you can select one of the following actions:
- Find events.
- Find alerts.
- Copy value to clipboard.
Run the following tasks:
- MD5—MD5 hash of the parent process file.
Clicking the MD5 link opens a list in which you can select one of the following actions:
- Find events.
- Find alerts.
- Find on Kaspersky TIP.
- Find in Storage.
- Create prevention rule.
- Copy value to clipboard.
- SHA256—SHA256 hash of the parent process file.
Clicking the SHA256 link opens a list in which you can select one of the following actions:
- Find events.
- Find alerts.
- Find on Kaspersky TIP.
- Find in Storage.
- Create prevention rule.
- Copy value to clipboard.
- File—Path to the parent process file.
- System info section:
- Host name—Name of the host on which the command was entered.
Clicking the link with the host name opens a list in which you can select one of the following actions:
- Find events.
- Find alerts.
- Copy value to clipboard.
Run the following tasks:
- Get data → File, Forensics, Disk image, Memory dump.
- Kill process.
- Delete file.
- Quarantine file.
- Run application.
- Host IP—IP address of the host on which the command was entered.
If you are using dynamic IP addresses, the field displays the IP address assigned to the host at the moment when the event was created.
The application does not support IPv6. If you are using IPv6, the IP address of the host is not displayed.
- User name—User account that was used to enter the command.
- OS version—Version of the operating system that is being used on the host.
- Host name—Name of the host on which the command was entered.
Information about the "Code injection" event
The window displaying information about Code injection events contains the following details:
- Tree of events.
- Actions that can be performed to handle an event.
- Code injection section:
- IOA tags—Information about the results of file analysis using the Targeted Attack Analyzer technology: name of the TAA (IOA) rule that was used to create the alert.
Click the link to display information about the TAA (IOA) rule. If the rule was provided by Kaspersky experts, it contains information about the triggered MITRE technique as well as recommendations for reacting to the event.
The field is displayed if a TAA (IOA) rule was triggered when the event was created.
- File—Path to the target process file.
- Process ID—Identifier of the target process.
- Launch parameters—Command line options of the target process.
- Modified start options—Modified command line options of the target process.
This field is displayed if the ARG_SPOOFING method was used to inject code.
- MD5—MD5 hash of the target process file.
- SHA256—SHA256 hash of the target process file.
- Access method—Method of access to the target process.
This field can have the following values: WRITE_EXECUTABLE_MEMORY, SET_WINDOWS_HOOK, QUEUE_APC_THREAD, SET_THREAD_CONTEXT – .MAP_VIEW_OF_SECTION, CREATE_REMOTE_THREAD, ARG_SPOOFING.
- Address space—Address in the address space of the target process at which the remotely executed code was placed.
This field is not populated if the code was injected using the SET_WINDOWS_HOOK or ARG_SPOOFING methods.
- System call parameters—Command line that the target process was started with.
- DLL name—Name of the DLL that contains the hook procedure and the name of the function to which control is passed after injection.
This field is filled if the SET_WINDOWS_HOOK method was used to inject code.
- DLL full path—Path to the DLL containing the hook procedure.
This field is filled if the SET_WINDOWS_HOOK method was used to inject code.
- Event time—Time of code injection.
- Call trace—API call stack at the time of interception of the function related to code injection.
- IOA tags—Information about the results of file analysis using the Targeted Attack Analyzer technology: name of the TAA (IOA) rule that was used to create the alert.
- Event initiator section:
- File—Name of the parent process file.
- MD5—MD5 hash of the parent process file.
- SHA256—SHA256 hash of the parent process file.
- System info section:
- Host name—Name of the host on which the code injection occurred.
- User name—Name of the user account that was used for the code injection.
- OS version—Version of the operating system that is being used on the host.
Information about the "Process access" event
The window displaying information about File changed events contains the following details:
- Tree of events.
- Actions that can be performed to handle an event.
- Depending on the type of operation that was performed with the process file, one of the following section names is displayed in the event information:
- Process access is open
- Duplicate handle
The Process access is open displays the following information:
- IOA tags—Information about the results of file analysis using the Targeted Attack Analyzer technology: name of the TAA (IOA) rule that was used to create the alert.
Click the link to display information about the TAA (IOA) rule. If the rule was provided by Kaspersky experts, it contains information about the triggered MITRE technique as well as recommendations for reacting to the event.
The field is displayed if a TAA (IOA) rule was triggered when the event was created.
- File—Name of the recipient process.
- Process ID—Process ID of the recipient process.
- Launch parameters—Command line options of the recipient process.
- MD5—MD5 hash of the recipient process file.
- SHA256—SHA256 hash of the recipient process file.
- Access permissions—Requested process access rights.
- Size—Size of the recipient process file.
- Event time—Time when the event was detected.
- Time created—Recipient process file creation time.
- Time modified—Time of last modification of the recipient process file.
- Attributes modification time—Time when the attributes of the recipient process file were changed.
- Call trace—Call stack.
The Duplicate handle section displays the following information:
- File—File name of the duplicated process.
- MD5—MD5 hash of the duplicated process file.
- SHA256—SHA256 hash of the duplicated process file.
- Time created—Duplicated process file creation time.
- Time modified—Time of last modification of the duplicated process file.
- Attributes modification time—Time when the attributes of the duplicated process file were changed.
- Size—Size of the duplicated process file.
- Process ID—ID of the duplicated process.
- Launch parameters—Command line options of the duplicated process.
For events of this type, the event information also includes the Information about the process to which the handle was duplicated and Information about the process from which the handle was duplicated sections. These sections contain the following information:
- File—Process file name.
- MD5—MD5 hash of the process file.
- SHA256—SHA256 hash of the process file.
- Process ID—Process identifier.
- Launch parameters—Process startup settings.
- Size—Size of the process file.
- Time created—Process file creation time.
- Time modified—Time of last modification of the file.
- Attributes modification time—Time when the attributes of the process file were changed.
- Event initiator section:
- File—Path to the parent process file.
- MD5—MD5 hash of the parent process file.
- SHA256—SHA256 hash of the parent process file.
- Launch parameters—Parent process startup settings.
- System info section:
- Host name—Name of the host on which the file was created.
- User name—Name of the user that created the file.
- OS version—Version of the operating system that is being used on the host.
Clicking the link with the file name or path to the file in the section with information about the file with which the operation was performed opens a list in which you can select one of the following actions:
- Find events.
- Find alerts.
- Run the following tasks:
- Copy value to clipboard.
Clicking the link with the file name or file path in the Event initiator section opens a list in which you can select one of the following actions:
- Find events.
- Find alerts.
- Run the following tasks:
- Copy value to clipboard.
Clicking the MD5 link opens a list in which you can select one of the following actions:
- Find events.
- Find alerts.
- Find on Kaspersky TIP.
- Find in Storage.
- Create prevention rule.
- Copy value to clipboard.
Clicking the SHA256 link opens a list in which you can select one of the following actions:
- Find events.
- Find alerts.
- Find on Kaspersky TIP.
- Find on virustotal.com.
- Find in Storage.
- Create prevention rule.
- Copy value to clipboard.
Event chain scanning by Kaspersky TAA (IOA) rules
Some cyberattacks can be detected only by looking at a certain sequence of events. If the event chain scanning functionality is enabled, Kaspersky Anti Targeted Attack Platform marks events arriving at the Central Node server in accordance with Kaspersky TAA (IOA) rules and, when it detects a suspicious sequence of events, an alert is recorded in the table of alerts.
You can view events marked by a Kaspersky TAA (IOA) rule in one of the following ways:
- By creating a search query to the event database with the following criteria: IOATag, IOAImportance, IOAConfidence.
- While viewing events and alerts.
Kaspersky TAA (IOA) rules cannot be edited. If you do not want the application to create alerts for events generated as part of host activity that is normal for your organization, you can add a TAA (IOA) rule to exclusions. Only one exclusion can be created per Kaspersky TAA (IOA) rule.
In
, you must enable the event chain scanning functionality on each Central Node server on which you want to use it. If the Central Node component is deployed as a cluster, you can enable the functionality on any server in the cluster.Using TAA (IOA) rules that scan chains of events causes higher usage of system resources. If you encounter performance problems with the application, we recommend disabling this functionality.
Special considerations for displaying event chain information in widgets
The top 10 widgets display information only about events that triggered a TAA (IOA) rule. Widgets do not take into account events that occurred earlier and participate in the event chain, but did not trigger a rule. For this reason, the number of events reported by the widget may not match the number of events in the selection displayed when you click the link with the host name and the name of the TAA (IOA) rule.
Page top
Enabling or disabling event chain scanning by Kaspersky TAA (IOA) rules
To enable or disable event chain scanning by Kaspersky TAA (IOA) rules:
- In the window of the application web interface, select the Settings section, Endpoint Agents subsection.
- Under Use TAA (IOA) rules for chains of events, do one of the following:
- If you want to enable the functionality, set the Use rules for chains of events toggle switch to Enabled.
- If you want to disable the functionality, set the Use rules for chains of events toggle switch to Disabled.
This functionality is disabled by default.
Event chain scanning by Kaspersky TAA (IOA) rules is enabled or disabled.
Page top
Viewing events marked by a Kaspersky TAA (IOA) rule
To view all events marked by the selected Kaspersky TAA (IOA) rule in the Alerts section:
- Select the Alerts section in the window of the application web interface.
This opens the table of alerts.
- Click the link in the Technologies column to open the filter configuration window.
- In the drop-down list on the left, select Contain.
- In the drop-down list on the right, select the (TAA) Targeted Attack Analyzer technology.
- Click Apply.
The table displays alerts generated by the TAA technology based on TAA (IOA) rules.
- Select an alert for which the Detected column displays the name of the relevant rule.
This opens a window containing information about the alert.
- Under Scan results, click the link with the name of the rule to open the rule information window.
- This opens a window; in that window, click Events.
A table of events matching the selected TAA (IOA) rule is displayed.
To view all events marked by the selected Kaspersky TAA (IOA) rule in the Threat Hunting section:
- Select the Threat Hunting section in the application web interface window.
This opens the event search form.
- Define the search conditions and click the Search button. For example, you can select event search criteria in the TAA properties group in builder mode.
The table of events that satisfy the search criteria is displayed.
- Select an event.
- To the right of the IOA tags setting, click the name of the rule.
This opens a window containing information about the rule.
- This opens a window; in that window, click Events.
A table of events matching the selected TAA (IOA) rule is displayed.
Page top
Managing assets
Assets are all devices present in the local and internal network of the organization. To manage assets, you can view the table of devices in the Assets section of the Kaspersky Anti Targeted Attack Platform web interface. You can also view information about interactions of devices and perform various actions on devices when managing the network interactions map and the topology map.
Viewing the table of devices
To manage devices, the application generates a table of devices. The application considers all devices in the table to be known devices.
To view the table of devices:
- Select the Assets section in the application web interface window.
- Go to the Devices tab.
The table of devices is displayed.
The table displays the following information:
- Name is the name that represents the device in the application.
- Device ID is the ID of the device assigned in Kaspersky Anti Targeted Attack Platform.
- Status is the device status that determines whether the device is allowed to be active on the corporate LAN. A device can have one of the following statuses:
- Authorized. This status is assigned to a device that is allowed to be active on the network.
- Unauthorized. This status is assigned to a device that is not allowed to be active on the network.
- Archived. This status is assigned to a device if it is no longer in use or must not be used on the network, or if the device has not been active for a long time (30 days or more) and information about this device has not been updated.
- Address information lists MAC and/or IP addresses of the device. If a device has multiple network interfaces, each network interface can have a different MAC and/or IP address.
- Category is the name of the category that characterizes the functional purpose of the device. Kaspersky Anti Targeted Attack Platform recognizes the following device categories:
- Server for a computer on which server software is deployed.
- Network device for a piece of network equipment (for example, a router, a switch).
- Workstation for a stationary personal computer or operator workstation.
- Mobile device for a portable electronic device with computing functionality.
- Laptop for a portable personal computer.
- Printer for a printing device.
- UPS for an uninterruptible power supply connected to a computer network.
- Network camera for a device that performs video surveillance and transmits digital imaging data.
- Gateway for a device that connects networks by converting various interfaces (for example, Serial Ethernet) in networks with a heterogeneous data transmission medium and different protocols.
- Storage system for a device that stores information inside memory systems.
- Firewall for a device that act as a firewall to scan and block unwanted traffic.
- Switch for a device that physically connects hosts of the local network.
- Virtual switch for a device that logically combines physical switches or software switches for virtualization systems.
- Router for a device that forwards network packets between segments of a computer network.
- Virtual router for a device that logically combines physical routers or routers that use multiple independent routing and forwarding tables.
- Wi-Fi for an access point that provides wireless connection of devices from Wi-Fi networks.
- Historian server for a server with archived data.
- Other for a device that does not belong to any of the above categories.
- Group is the name of the group in which the device is placed in the device group tree (contains the name of the group itself and the names of all its parent groups).
- Security state is the security state of the device, which is determined by the existence of events related to the device. A device can have one of the following security states:
- Critical. The device has associated events that have a 8.0–10.0 severity score.
- Warning. The device has associated events that have a 4.0–7.9 severity score.
- OК. The device has associated events that have a 0.0-3.9 severity score, or the device has no associated events.
- Importance is the importance of the device. Importance is assigned to the device in accordance with its category. A device can have one of the following importance ratings:
- High. Assigned to devices of the Server category.
- Medium. Assigned to devices of the following categories: Network device, Workstation, Gateway, Storage system, Firewall, Switch, Virtual switch, Router, Virtual router, Wi-Fi, Historian server.
- Low. Assigned to devices of the following categories: Mobile device, Laptop, Printer, UPS, Network camera, or Other.
- Last seen is the date and time of the last recorded activity of the device.
- Risks lists the categories of risks detected for the device. By default, the device table displays information only for current risks. To display information for all risks, you can select the Show remediated and accepted risks check box when configuring the device table.
- Last modified is the date and time when the device information was last modified.
- Created is date and time when the device was added to the table of devices.
- OS is the name of the operating system installed on the device.
- Hardware vendor is the name of the vendor of the hardware of the device. In the details area, this parameter is called Vendor and is displayed on the General tab under Hardware.
- Hardware Model is the name of the device model. In the details area, this parameter is called Model and is displayed on the General tab under Hardware.
- Hardware version is the version number of the device hardware. In the details area, this parameter is called Version and is displayed on the General tab under Hardware.
- Software vendor is the vendor name of the device software. In the details area, this parameter is called Vendor and is displayed on the General tab under Software.
- Software name is the name of the device software. In the details area, this parameter is called Name and is displayed on the General tab under Software.
- Software version is the version number of the device software. In the details area, this parameter is called Version and is displayed on the General tab under Software.
- Network name is the name that represents the device on the network.
- Labels lists labels assigned to the device.
- EPP application is the short name of the EPP application installed on the device (if this application has communicated with Kaspersky Anti Targeted Attack Platform).
- EPP connection is the status of the connection of the Endpoint Agent component installed on the device to the integration server. The following statuses are possible:
- Active. Less than 24 hours have passed since the application last connected to the integration server.
- Inactive. Over 24 hours have passed since the application last connected to the integration server.
- N/A. The connection status is unknown.
- Last connection to EPP is the date of the last connection of the Endpoint Agent component to the integration server.
Viewing device information
To view device information:
- Select the Assets section in the application web interface window.
- Go to the Devices tab.
- Select the device for which you want to view information.
This opens a window containing information about the device.
This window can contain the following information:
- Device information:
- Security status is the security status of the device, which is determined by the existence of events related to the device. A device can have one of the following security states:
- Critical. The device has associated events that have a 8.0–10.0 severity score.
- Warning. The device has associated events that have a 4.0–7.9 severity score.
- OК. The device has associated events that have a 0.0-3.9 severity score, or the device has no associated events.
- Importance is the importance of the device to the organization. Importance is assigned to the device in accordance with its category. A device can have one of the following importance ratings:
- High. Assigned to devices of the Server category.
- Medium. Assigned to devices of the following categories: Network device, Workstation, Gateway, Storage system, Firewall, Switch, Virtual switch, Router, Virtual router, Wi-Fi, Historian server.
- Low. Assigned to devices of the following categories: Mobile device, Laptop, Printer, UPS, Network camera, or Other.
- Status is the device status that determines whether the device is allowed to be active on the corporate LAN. A device can have one of the following statuses:
- Authorized. This status is assigned to a device that is allowed to be active on the network.
- Unauthorized. This status is assigned to a device that is not allowed to be active on the network.
- Archived. This status is assigned to a device if it is no longer in use or must not be used on the network, or if the device has not been active for a long time (30 days or more) and information about this device has not been updated.
- Category is the name of the category that characterizes the functional purpose of the device.
- Network name is the name that represents the device on the network.
- Group is the name of the group in which the device is placed in the device group tree (contains the name of the group itself and the names of all its parent groups).
- Security status is the security status of the device, which is determined by the existence of events related to the device. A device can have one of the following security states:
- The Main tab:
- Created is date and time when the device was added to the table of devices.
- Last modified is the date and time when the device information was last modified.
- Last seen is the date and time of the last recorded activity of the device.
- Address information lists MAC and/or IP addresses of the device. If a device has multiple network interfaces, each network interface can have a different MAC and/or IP address.
- Hardware contains information about the hardware characteristics of the device.
- Software contains information about the software of the device.
- Endpoint Agent contains information about the Endpoint Agent component. This section is displayed if the Endpoint Agent component is installed on the device.
- EPP application contains information about the application that is being used in the role of an Endpoint Agent component.
- Router is the attribute that marks the device as a routing device.
If the application cannot determine the routing device attribute automatically, you must set the attribute manually. This attribute allows the application to use additional algorithms for detecting devices that interact with each other through a router.
- Public key is a public key for authenticating the device before establishing an SSH connection and scanning the device as part of security audit tasks.
- Additional information contains additional information about the device specified by the user of the application (for example, description of the physical location of the device).
- Custom fields is a set of non-standard information about the device, specified by the user of the application (for example, categories and protection classes of the device). Up to 16 custom fields can be specified for a device.
- Dynamic fields is a set of extended device information that is detected in traffic using the Device Information Detection method. A field is displayed if the application has detected extended information.
- Addresses tab:
- DHCP server is the DHCP server attribute.
This field displays Yes if the device has the DHCP server attribute.
- DHCP relay is the DHCP relay attribute.
This field displays Yes if the device has the DHCP relay attribute.
- Network interface <number> contains information about the network interface of the device.
- DHCP server is the DHCP server attribute.
- The Topology settings tab contains information about the last active polling of the device, as well as information about the links of the device with other nodes.
- The Equipment tab contains information about BIOS programs and CPUs of the device, the amount of free RAM and free local disk space, and USB devices and optical drives being used. Information is displayed if it was obtained using the hardware monitoring functionality.
- The Configurations tab contains information about obtained device configurations. Information is displayed if it was obtained by configuration monitoring tasks.
Automatically adding and updating devices
The application can automatically add devices to the table and update device information. To enable automatic adding and updating of devices in Kaspersky Anti Targeted Attack Platform, you must enable and configure the Device Activity Detection (AM) technology. If the technology is enabled, the application adds and updates device information using data obtained from network traffic and the integration with the Endpoint Agent component.
When adding a device, the application sets a default device name using the following template: Device <internal device counter value>. This internal counter value in the device name may not match the device ID that is displayed in the Device ID column.
The application can automatically update vendor information of network equipment based on the MAC addresses of devices. To identify vendors by MAC addresses, the application looks up the MAC addresses of devices in the ranges of addresses registered in the open database of the Institute of Electrical and Electronics Engineers (IEEE). If the vendor of the network equipment is identified by its MAC address, the application keeps the name from the IEEE database.
After installing the application, a copy of the IEEE database is used, which contains information about MAC addresses and vendors at the time when the current version of the application was released. You can keep your local copy of the IEEE database up to date by installing updates.
Page top
Manually adding devices
This section provides instructions on manually adding devices. You can manually add a new device to the table of devices. You must specify the MAC and/or IP address of the device that you want to add.
The MAC and IP addresses of the added device must be unique within the address space to which these addresses belong. If extra address spaces are added to the application, you can add devices with the same address to different address spaces.
Only users with the Senior security officer role can manually add devices.
After adding a device, you can add process monitoring settings for the device.
Adding a device while managing the table of devices
To add a device while managing the table of devices:
- Select the Assets section in the application web interface window.
- In the table of devices on the Devices tab, select the device for which you want to view information.
This opens a window containing information about the device.
- Click Add device.
- On the Settings tab, in the details area, specify your values in the device information fields.
- On the Address information tab, in the details area:
- In the DHCP server drop-down list, select Yes if the device is a DHCP server.
- In the DHCP relay drop-down list, select Yes if the device is a DHCP relay.
In learning mode, for devices that are DHCP servers and DHCP relays, these attributes are assigned automatically. You can disable automatic update of attributes (see step 6 of these instructions).
In monitoring mode, only users with the Senior security officer role can edit attributes.
- In the Address space drop-down list, select the address space to which you want the device to belong.
- In the MAC address field, enter the MAC address of the device.
- In the IP address drop-down list select the IP address assignment type (static or dynamic), and enter the IP address of the device.
You can specify multiple IP addresses for the same network interface of a device. To create a list of IP addresses, do one of the following:
- If you want to add an IP address, click Add IP address.
- If you want to delete an IP address, click the
 icon to the right of the field with the IP address.
If the device has multiple network interfaces, create a list of the network interfaces:
- If you want to add a network interface, click Add interface below the settings of the last network interface.
- If you want to delete a network interface, click the
 icon to the right of the name of the network interface (if the device has two or more network interfaces).
 - If you want to enter a different name for the network interface, click the
 icon to the right of the current name, and enter the new name in the displayed field.
- On the Settings and Address information tabs, in the details area, enable or disable automatic modification of certain elements of device information. To do so, click the
 or
or  icons.
If you disable automatic updating of a device's IP address, automatic updating of the IP address type (static or dynamic) and address space information is also disabled.
- On the Custom fields tab in the details area, create a list of custom fields, if necessary.
- Click Save.
This button is unavailable if the device settings do not contain all the required information or if some of the specified settings are invalid. Tabs with settings that require a correct value is marked with the
 icon.
icon.
A new device appears in table of devices with the Authorized status.
Page top
Adding a device while managing the topology map
You can add a new device to the table of devices while managing the topology map.
To add a new device to the table of devices while managing the topology map:
- Select the Network map section in the application web interface window.
- Go to the Topology map tab.
- Click Add device.
- On the Settings tab, in the details area, specify your values in the device information fields.
- On the Address information tab, in the details area:
- In the DHCP server drop-down list, select Yes if the device is a DHCP server.
- In the DHCP relay drop-down list, select Yes if the device is a DHCP relay.
In learning mode, for devices that are DHCP servers and DHCP relays, these attributes are assigned automatically. You can disable automatic update of attributes (see step 6 of these instructions).
In monitoring mode, only users with the Senior security officer role can edit attributes.
- In the Address space drop-down list, select the address space to which you want the device to belong.
- In the MAC address field, enter the MAC address of the device.
- In the IP address drop-down list select the IP address assignment type (static or dynamic), and enter the IP address of the device.
You can specify multiple IP addresses for the same network interface of a device. To create a list of IP addresses, do one of the following:
- If you want to add an IP address, click Add IP address.
- If you want to delete an IP address, click the icon to the right of the field with the IP address.
If the device has multiple network interfaces, create a list of the network interfaces:
- If you want to add a network interface, click Add interface below the settings of the last network interface.
- If you want to delete a network interface, click the icon to the right of the name of the network interface (if the device has two or more network interfaces).
- If you want to enter a different name for the network interface, click the icon to the right of the current name, and enter the new name in the displayed field.
- On the Settings and Address information tabs, in the details area, enable or disable automatic modification of certain elements of device information. To do so, click the or icons.
If you disable automatic updating of a device's IP address, automatic updating of the IP address type (static or dynamic) and address space information is also disabled.
- On the Custom fields tab in the details area, create a list of custom fields, if necessary.
- Click Save.
This button is unavailable if the device settings do not contain all the required information or if some of the specified settings are invalid. Tabs with settings that require a correct value is marked with the
icon.
A new device appears in table of devices with the Authorized status.
Page top
Adding a device based on an unknown device node on the network interactions map
While managing the network interactions map, you can add a new device to the table of devices based on the node that represents the device that the application does not recognize.
To add an unrecognized device node to the table of devices:
- Select the Network map section in the application web interface window.
- On the Network interactions map tab, select the node representing the device that the application does not recognize.
The details area is displayed in the right part of the web interface window.
- Click Add to the devices table.
- On the Settings tab, in the details area, specify your values in the device information fields.
- On the Address information tab, in the details area:
- In the DHCP server drop-down list, select Yes if the device is a DHCP server.
- In the DHCP relay drop-down list, select Yes if the device is a DHCP relay.
In learning mode, for devices that are DHCP servers and DHCP relays, these attributes are assigned automatically. You can disable automatic update of attributes (see step 6 of these instructions).
In monitoring mode, only users with the Senior security officer role can edit attributes.
- In the Address space drop-down list, select the address space to which you want the device to belong.
- The IP address and MAC address fields are filled in automatically; we do not recommend changing these settings.
You can specify multiple IP addresses for the same network interface of a device. To create a list of IP addresses, do one of the following:
- If you want to add an IP address, click Add IP address.
- If you want to delete an IP address, click the icon to the right of the field with the IP address.
If the device has multiple network interfaces, create a list of the network interfaces:
- If you want to add a network interface, click Add interface below the settings of the last network interface.
- If you want to delete a network interface, click the icon to the right of the name of the network interface (if the device has two or more network interfaces).
- If you want to enter a different name for the network interface, click the icon to the right of the current name, and enter the new name in the displayed field.
- On the Settings and Address information tabs, in the details area, enable or disable automatic modification of certain elements of device information. To do so, click the or icons.
If you disable automatic updating of a device's IP address, automatic updating of the IP address type (static or dynamic) and address space information is also disabled.
- On the Custom fields tab in the details area, create a list of custom fields, if necessary.
- Click Save.
This button is unavailable if the device settings do not contain all the required information or if some of the specified settings are invalid. Tabs with settings that require a correct value is marked with the
icon.
A new device appears in table of devices with the Authorized status. A node on the network interactions map that previously represented a device that the application did not recognize now represents a device that is known to the application.
Page top
Adding a device based on an unmanaged switch on the topology map
While managing the topology map, you can add a new device to the table of devices based on the node that represents an unmanaged switch.
To add an unmanaged switch node to the table of devices:
- Select the Network map section in the application web interface window.
- On the Network interactions map tab, select the node representing the unmanaged switch.
The details area is displayed in the right part of the web interface window.
- Click Add to the devices table.
- On the Settings tab, in the details area, specify your values in the device information fields.
- On the Address information tab, in the details area:
- In the DHCP server drop-down list, select Yes if the device is a DHCP server.
- In the DHCP relay drop-down list, select Yes if the device is a DHCP relay.
In learning mode, for devices that are DHCP servers and DHCP relays, these attributes are assigned automatically. You can disable automatic update of attributes (see step 6 of these instructions).
In monitoring mode, only users with the Senior security officer role can edit attributes.
- In the Address space drop-down list, select the address space to which you want the device to belong.
- In the MAC address field, enter the MAC address of the device.
- In the IP address drop-down list select the IP address assignment type (static or dynamic), and enter the IP address of the device.
You can specify multiple IP addresses for the same network interface of a device. To create a list of IP addresses, do one of the following:
- If you want to add an IP address, click Add IP address.
- If you want to delete an IP address, click the icon to the right of the field with the IP address.
If the device has multiple network interfaces, create a list of the network interfaces:
- If you want to add a network interface, click Add interface below the settings of the last network interface.
- If you want to delete a network interface, click the icon to the right of the name of the network interface (if the device has two or more network interfaces).
- If you want to enter a different name for the network interface, click the icon to the right of the current name, and enter the new name in the displayed field.
- On the Settings and Address information tabs, in the details area, enable or disable automatic modification of certain elements of device information. To do so, click the or icons.
If you disable automatic updating of a device's IP address, automatic updating of the IP address type (static or dynamic) and address space information is also disabled.
- On the Custom fields tab in the details area, create a list of custom fields, if necessary.
- Click Save.
This button is unavailable if the device settings do not contain all the required information or if some of the specified settings are invalid. Tabs with settings that require a correct value is marked with the
icon.
A new device appears in the table of devices with the Authorized status. The node on the topology map that previously represented an unmanaged switch now represents a device that is known to the application.
Page top
Automatically assigning device status
When monitoring device activity, the application can automatically assign a status to discovered devices based on the obtained MAC and/or IP addresses of such devices. Status is assigned depending on the current asset management mode.
In learning mode, the application assigns the Authorized status to all devices (both new and previously added to the table), except for those devices that have had the Unauthorized status assigned previously.
In monitoring mode, the assigned status depends on whether the device that has exhibited activity is a device that the application knows or does not recognize. In this mode, status is assigned according to the following rules:
- If the device is new (it was absent from the device table at the time of discovery), this device is assigned the Unauthorized status.
- If the device is present in the table of devices with the Authorized or Unauthorized status, its status does not change.
- If a device is present in the table of devices with the Archived status, the device is assigned the Unauthorized status.
By default, if a device with the Authorized status has been inactive for more than 30 days and device information has not changed during this period, such a device is automatically assigned the Archived status. You can disable the automatic assignment of the Archived status when you change the device status manually (for example, to prevent the Authorized status from changing to Unauthorized for a device that rarely connects to the network).
When using connectors of the Cisco Switch type, network access of devices may be automatically restricted after these devices get the Unauthorized status. You need to take into account the specified settings of connectors of this type to prevent blocking necessary devices because of a status change.
Page top
Automatically grouping devices based on a criterion
This section contains instructions on how to automatically group devices based on a criterion. You can automatically group devices in the device group tree based on one of the following criteria:
- IP addresses belonging to subnets that are known to the application
- Device categories
- Device vendors
Only users with the Senior security officer role can automatically group devices.
Automatically grouping devices based on a criterion, starting from the root of the group tree
To automatically group devices based on a criterion, starting from the root of the group tree:
- Use the web interface to connect to the Central Node with the Senior security officer role.
- In the Network map section, on the Network interactions map tab, click one of the following buttons for selecting a grouping criterion in the toolbar in the left part of the network interactions map display area:
 to group devices by subnet.
 to group devices by category.
 to group devices by vendor.
This opens a prompt window in which you can select a grouping option.
- To group devices by category and vendor based on address spaces, in the prompt window, select the Take into account the address spaces check box.
- Click on one of the following buttons, depending on the what you want to do:
- To group devices by subnets, click Group.
- To group devices by category and vendor based on address spaces in all groups of the device group tree, click With child groups.
- To group devices by category and vendor based on address spaces only at the top level of the device group tree hierarchy, click Selected only.
The application identifies devices that match the selected grouping criterion, creates groups for these devices, and arranges the devices into these groups.
Page top
Automatically grouping devices in a selected device group
To automatically group devices in a selected device group:
- Use the web interface to connect to the Central Node with the Senior security officer role.
- In the Network map section, on the Network interactions map tab, select the group in which you want to automatically group devices.
- Right-click to open the context menu.
- In the context menu, select one of the following commands:
- Group by subnet.
- Group by category.
- Group by vendor.
This opens a prompt window in which you can select a grouping option.
- To group devices by category and vendor based on address spaces, in the prompt window, select the Take into account the address spaces check box.
- In the prompt window, click on one of the following buttons, depending on the what you want to do:
- To group devices by subnets, click Group.
- If you want to group devices by category or vendor in all child groups of the selected group, click With child groups.
- If you want to group devices by category or vendor only in the selected group, click Selected only.
The application identifies devices that match the selected grouping criterion, creates groups for these devices and arranges devices into these groups (devices in other groups are not affected).
Manually arranging devices into groups
This section contains instructions on how to manually manage the placement of devices in the group tree. Only users with the Senior security officer role can arrange devices in the group tree.
Adding a device to a group
To add an individual device to a group when managing the table:
- Use the web interface to connect to the Central Node with the Senior security officer role.
- Select the device in the Assets section on the Devices tab or in the Network map section.
In the Network map section, you can select the device to add to a group on the network interactions map as well as the topology map.
The details area is displayed in the right part of the web interface window.
- Click Edit.
- In the details area, go to the Settings tab.
- Click the
 icon in the right part of the Group field.
The Select group in tree window appears.
- In the device group tree, select the relevant group.
If the relevant group is not in the tree, you can add it in the currently displayed Select group in tree window.
- Click Select.
The path to the selected group appears in the Group field.
- Click Save in the details area.
This button is unavailable if the device settings do not contain all the required information or if some of the specified settings are invalid. Tabs with settings that require a correct value is marked with the
icon.
Adding multiple devices to a group
You can add multiple devices to a group while managing the table of devices.
Also, when managing the network interactions map, you can add to a group multiple known devices on the network interactions map. You can select component servers either individually or as part of collapsed groups that include the required devices. When you select a collapsed group, all devices in child groups at all nesting levels also end up in the selection.
To add multiple devices to a group when managing the table:
- Use the web interface to connect to the Central Node with the Senior security officer role.
- Select the Assets section.
- On the Devices tab, select the devices that you want to add to a group.
- Right-click to open the context menu.
- In the context menu, select Group management → Move to group.
The Select group in tree window appears.
- In the device group tree, select the relevant group.
If the relevant group is not in the tree, you can add it in the currently displayed Select group in tree window.
- Click Select.
The path to the selected group appears in the Group column.
To add multiple devices to a group when managing the network interactions map:
- Use the web interface to connect to the Central Node with the Security officer or Senior security officer role.
- In the Network map section, on the Network interactions map tab, select the relevant component servers and/or collapsed groups.
To select multiple component servers and/or groups, do one of the following:
- Press and hold the SHIFT key, then use the mouse to select a rectangular area with the objects that you want to select.
- Press and hold the CTRL key and click every object that you want to select.
- Right-click to open the context menu.
- In the context menu, select Move to group.
The Select group in tree window appears.
- In the device group tree, select the relevant group.
If the relevant group is not in the tree, you can add it in the currently displayed Select group in tree window.
- Click Select.
The selected component servers are displayed inside the selected group.
Removing a device from a group
To remove an individual device from a group when managing the table:
- Use the web interface to connect to the Central Node with the Senior security officer role.
- Select the device in the Assets section on the Devices tab or in the Network map section.
In the Network map section, you can select devices to remove from a group on the network interactions map as well as the topology map.
The details area is displayed in the right part of the web interface window.
- Click Edit.
- In the details area, go to the Settings tab.
- In the Group field, delete the path to the group by clicking the icon in the field (the icon is displayed if a group is defined).
- Click Save.
This button is unavailable if the device settings do not contain all the required information or if some of the specified settings are invalid. Tabs with settings that require a correct value is marked with the
icon.
After saving the changes for the device, its Group value is cleared and the device is assigned to the root level of the group tree.
Page top
Removing multiple devices from groups
You can remove multiple devices from groups while managing the table of devices. Devices selected for removal from groups can belong to the same group or to different groups.
Also, when managing the network interactions map, you can exclude from groups multiple known devices on the network interactions map. You can select component servers either individually or as part of collapsed groups that include the required devices. When you select a collapsed group, all devices in child groups at all nesting levels also end up in the selection.
To remove multiple devices from groups when managing the table:
- Use the web interface to connect to the Central Node with the Senior security officer role.
- Select the Assets section.
- On the Devices tab, select the devices that you want to remove from groups.
- Right-click to open the context menu.
- In the context menu, select Group management → Remove from groups.
This opens a confirmation prompt window.
- In the prompt window, confirm the removal of devices from groups.
For all selected devices, the Group value is cleared and these devices are assigned to the root level of the group tree.
To remove multiple devices from groups when managing the network interactions map:
- Use the web interface to connect to the Central Node with the Security officer or Senior security officer role.
- In the Network map section, on the Network interactions map tab, select the component servers in expanded groups and/or collapsed groups.
To select multiple component servers and/or groups, do one of the following:
- Press and hold the SHIFT key, then use the mouse to select a rectangular area with the objects that you want to select.
- Press and hold the CTRL key and click every object that you want to select.
- Right-click to open the context menu.
- In the context menu, select Remove from group.
This opens a confirmation prompt window.
- In the prompt window, confirm the removal of devices from groups.
For all selected devices, the Group value is cleared and these devices are displayed outside of groups.
Page top
Moving servers with components and groups to other groups on the network interactions map
You can rearrange component servers and groups in the device group tree by dragging and dropping objects on the network interactions map. The location of moved component servers and groups in the device group tree changes in the same way as when you add devices to a group or remove devices from groups.
Only users with the Senior security officer role can move component servers and groups to other groups.
To move component servers and/or groups to other groups:
- Use the web interface to connect to the Central Node with the Senior security officer role.
- In the Network map section, on the Network interactions map tab, select the relevant component servers and/or collapsed groups.
To select multiple component servers and/or groups, do one of the following:
- Press and hold the SHIFT key, then use the mouse to select a rectangular area with the objects that you want to select.
- Press and hold the CTRL key and click every object that you want to select.
- Point to one of the selected objects (a group or a component server).
- Press and hold the CTRL key and drag the selected objects to the group you want (or to any space outside the groups if you want to move the selected objects to the top hierarchy level of the group tree).
A window with a confirmation prompt opens.
- In the prompt window, confirm the movement of the selected objects.
Device group tree
The purpose of the device group tree is to arrange devices in accordance with their function, location, or any other arbitrary attribute. Devices can be arranged into groups manually or automatically (by their IP addresses belonging to subnets, by category, or by vendor).
If a device is not included in any of the groups, such a device belongs to the top level of the group tree. Devices automatically added to the table are not included in any group by default.
You can see which groups devices belong to when viewing the device table. Paths to groups are indicated in the Group column. Device groups are also displayed on the network interactions map, however, devices belonging to these groups may not be displayed if they do not satisfy the filtering criteria for objects on the network interactions map.
Page top
Manually editing the device group tree
You can edit the device group tree when managing the device table, the network interactions map, and the topology map. Tree creation functions are available in the Create group tree or Select group in tree window.
Only users with the Senior security officer role can create the device group tree.
To use the device tree group editing functionality:
- Use the web interface to connect to the Central Node with the Senior security officer role.
- In the Assets section on the Devices tab or in the Network map section, do one of the following:
- Open the Create group tree window by clicking Configure groups.
The Configure groups button in the Assets section is available in the Group management drop-down list in the toolbar.
The Configure groups button in the Network map section is only available on the Network interactions map tab.
- Open the Select group in tree window while adding devices to groups. You can also open this window when filtering the table of devices by the Group column.
- Open the Create group tree window by clicking Configure groups.
Any changes made to the device group tree in the Create group tree or Select group in tree window are applied immediately.
This section provides instructions on using the features for generating a device group tree.
Adding a group
To add a group to the device group tree:
- In the Create group tree or Select group in tree window, add a new group in one of the following ways:
- If the tree is empty and you want to add the first group, click Add or press either INSERT or ENTER.
- If you want to add a group at the same hierarchy level as an existing group, select that group and press ENTER.
- If you want to add a child group to an existing group, select this group and click Add or press INSERT.
- Enter a name for the group in the text box.
You can use letters, numbers, the space character, and the following special characters:
! @ # № $ % ^ & ( ) [ ] { } ' , . - _ /.The group name must satisfy the following requirements:
- Begins and ends with any character other than a space.
- Contains up to 255 characters.
- Is not the same as the name of another group name under the same parent group (case-insensitive).
- Click the
 icon to the right of the text box.
Renaming a group
To rename a group to the device group tree:
- In the Create group tree or Select group in tree window, select the group that you want to rename.
- Click Rename or press F2.
- Enter the new name for the group in the text box.
You can use letters, numbers, the space character, and the following special characters:
! @ # № $ % ^ & ( ) [ ] { } ' , . - _ /.The group name must satisfy the following requirements:
- Begins and ends with any character other than a space.
- Contains up to 255 characters.
- Is not the same as the name of another group name under the same parent group (case-insensitive).
- Click the icon to the right of the text box.
The new group name is displayed in device information for devices that are added to this group or to its child groups.
Page top
Deleting groups
Deleting a group does not delete devices added to the group. Devices from a deleted group are moved to the same hierarchy level in the device tree as the deleted group.
To delete a group from the device group tree:
- In the Create group tree or Select group in tree window, select the group that you want to delete.
- Click the icon.
This opens a prompt window in which you can select a deletion option.
- In the prompt window, click on one of the following buttons, depending on the what you want to do:
- If you want to delete only the selected group and keep its child groups, click Selected only.
- If you want to delete the selected group together with all of its child groups, click With child groups.
This opens a confirmation prompt window.
- In the prompt window, click OK.
Moving a group
To move a group in the device group tree:
- In the Create group tree or Select group in tree window, select the group that you want to move.
- Use the arrow icons or the corresponding shortcuts (ALT+↓, ALT+↑, ALT+←, ALT+→) to move the group relative to other elements of the tree. If an operation cannot be performed, the icon of that operation is not available.
Searching for groups
You can find relevant groups in the device group tree by using the Search groups field in the Create group tree or Select group in tree window. The device group tree displays groups that match the search conditions. For child groups, their parent groups are also displayed.
Page top
Updating the tree
The makeup of the device group tree may be modified on the Central Node while you are managing the tree (for example, by another user who has connected to the Central Node).
You can manually update the tree by clicking the  icon in the Create group tree or Select group in tree window.
Adding and removing device labels
This section provides instructions on how to add or remove device labels. The labels you add to devices can be arbitrary.
A device label contains a text description that allows you to quickly find or filter devices in the table. You can save any text descriptions that you find convenient as labels. A device can have up to 16 labels. Each device can have its own set of labels.
Lists of device labels are displayed in the devices table in the Labels column. Labels in a cell are sorted alphabetically.
Only users with the Senior security officer role can add or remove device labels.
Adding labels to an individual device
To add a label to one device:
- Use the web interface to connect to the Central Node with the Senior security officer role.
- Select the device in the Assets section on the Devices tab or in the Network map section.
In the Network map section, you can select a device for adding a label on the network interactions map as well as the topology map.
The details area is displayed in the right part of the web interface window.
- Click Edit.
In the details area, go to the Settings tab.
- In the Labels field, enter the text descriptions that you want to use as labels. To separate the labels, you can use newline by pressing ENTER or the semicolon character (
;).You can use uppercase and lowercase letters, numbers, the space character, and the following special characters:
! @ # № $ % ^ & ( ) [ ] { } ' , . - _.The label name must satisfy the following requirements:
- Begins and ends with any character other than a space.
- Is unique in the list of that device's labels (case-insensitive).
- Contains 1 to 255 characters.
- If necessary, click Copy labels to copy the list of labels. The link is displayed if the list of labels is not empty.
- Click Save.
This button is unavailable if the device settings do not contain all the required information or if some of the specified settings are invalid. Tabs with settings that require a correct value is marked with the
icon.
Adding labels to multiple devices
You can add labels to multiple devices while managing the table of devices.
Also when managing the network interactions map and the topology map, you can add labels to devices known to the application, represented by nodes on the maps. You can select nodes either individually or as part of collapsed groups that include the required devices. When you select a collapsed group, all devices in child groups at all nesting levels also end up in the selection.
To add labels to multiple devices while managing the table:
- Use the web interface to connect to the Central Node with the Senior security officer role.
- Select the Assets section.
- On the Devices tab, select the devices to which you want to add labels.
- Right-click one of the selected devices to open the context menu.
- In the context menu, select Add labels.
This opens the Add labels window.
- In the Labels field, enter the text descriptions that you want to use as labels. To separate the labels, you can use newline by pressing ENTER or the semicolon character (
;).You can use uppercase and lowercase letters, numbers, the space character, and the following special characters:
! @ # № $ % ^ & ( ) [ ] { } ' , . - _.The label name must satisfy the following requirements:
- Begins and ends with any character other than a space.
- Is unique in the list of that device's labels (case-insensitive).
- Contains 1 to 255 characters.
- If necessary, click Copy labels to copy the list of labels. The link is displayed if the list of labels is not empty.
- If you want to clear the current lists of labels for selected devices and provide only new labels for these devices, select the Delete existing check box.
If the Delete existing check box is cleared, the current list of labels will remain on each device. The new tags are appended to the lists of labels on all selected devices. For some of the selected devices, this may cause the total number of labels to exceed the limit (up to 16 labels for each device). The application checks the limit before adding new tags.
- Click OK.
The button is not available if the names of entered labels do not meet the requirements, or if the list of labels is empty while the Delete existing check box is cleared.
To add labels to multiple devices while managing the maps:
- Use the web interface to connect to the Central Node with the Senior security officer role.
- Select the Network map section.
- On the Network interactions map or Topology map tab, select the relevant nodes of known devices and/or collapsed groups.
To select multiple nodes and/or groups, do one of the following:
- Press and hold the SHIFT key, then use the mouse to select a rectangular area with the objects that you want to select.
- Press and hold the CTRL key and click every object that you want to select.
- Right-click one of the selected objects to open the context menu.
- In the context menu, select Add labels.
This opens the Add labels window.
- In the Labels field, enter the text descriptions that you want to use as labels. To separate the labels, you can use newline by pressing ENTER or the semicolon character (
;).You can use uppercase and lowercase letters, numbers, the space character, and the following special characters:
! @ # № $ % ^ & ( ) [ ] { } ' , . - _.The label name must satisfy the following requirements:
- Begins and ends with any character other than a space.
- Is unique in the list of that device's labels (case-insensitive).
- Contains 1 to 255 characters.
- If necessary, click Copy labels to copy the list of labels. The link is displayed if the list of labels is not empty.
- If you want to clear the current lists of labels for selected devices and provide only new labels for these devices, select the Delete existing check box.
If the Delete existing check box is cleared, the current list of labels will remain on each device. The new tags are appended to the lists of labels on all selected devices. For some of the selected devices, this may cause the total number of labels to exceed the limit (up to 16 labels for each device). The application checks the limit before adding new tags.
- Click OK.
The button is not available if the names of entered labels do not meet the requirements, or if the list of labels is empty while the Delete existing check box is cleared.
Removing labels from an individual device
To remove a label from one device:
- Use the web interface to connect to the Central Node with the Senior security officer role.
- Select the device in the Assets section on the Devices tab or in the Network map section.
In the Network map section, you can select a device for removing a label on the network interactions map as well as the topology map.
The details area is displayed in the right part of the web interface window.
- Click Edit.
In the details area, go to the Settings tab.
- In the Labels field, delete the labels that you no longer need:
- Click the icon next to the label names if you want to remove individual labels.
- If you want to delete all labels, use the icon on the right side of the Labels field.
- Click the
- Click Save.
This button is unavailable if the device settings do not contain all the required information or if some of the specified settings are invalid. Tabs with settings that require a correct value is marked with the
icon.
Clearing the lists of labels for multiple devices
You can clear the lists of labels for multiple devices while managing the table of devices.
Also when managing the network interactions map and the topology map, you can clear the lists of labels for devices known to the application, represented by nodes on the maps. You can select nodes either individually or as part of collapsed groups that include the required devices. When you select a collapsed group, all devices in child groups at all nesting levels also end up in the selection.
To clear the lists of labels for multiple devices while managing the table:
- Use the web interface to connect to the Central Node with the Senior security officer role.
- Select the Assets section.
- On the Devices tab, select the devices for which you want to clear the lists of labels.
- Right-click one of the selected devices to open the context menu.
- In the context menu, select Add labels.
This opens the Add labels window.
- Select the Delete existing check box.
- Click OK.
To clear the lists of labels for multiple devices while managing the maps:
- Use the web interface to connect to the Central Node with the Senior security officer role.
- Select the Network map section.
- On the Network interactions map or Topology map tab, select the relevant nodes of known devices and/or collapsed groups.
To select multiple nodes and/or groups, do one of the following:
- Press and hold the SHIFT key, then use the mouse to select a rectangular area with the objects that you want to select.
- Press and hold the CTRL key and click every object that you want to select.
- Right-click one of the selected objects to open the context menu.
- In the context menu, select Add labels.
This opens the Add labels window.
- Select the Delete existing check box.
- Click OK.
Group response
To create a task for a group of devices:
- Select the Assets section in the application web interface window.
- Go to the Devices tab.
- Select the devices for which you want to create a common task.
If too many devices are listed, you can apply filters to display devices that you need. For example, you can find devices with certain labels or devices that belong to certain groups.
- In the Response menu, select a task type.
This opens the task creation window.
- Specify task settings depending on its type:
- Click Save.
The task is created.
Monitoring users on devices
Kaspersky Anti Targeted Attack Platform can monitor user accounts on devices known to the application. When monitoring users, the application automatically gets information about user accounts registered in the operating systems of the devices. Based on this information, the application generates user tables.
When getting information about user accounts, the application uses this information to monitor all user accounts on devices with the exception of some local system users, which only operating system services can use. For example, the application does not monitor the LocalSystem and NetworkService accounts on Windows devices.
To use the user monitoring functionality, Asset Management methods must be enabled to detect device activity and device information. These methods must be enabled on all servers with application components from which information is received.
User monitoring is based of information received from the following types of sources:
- Telemetry (Endpoint Agent)
Information about devices and the processes running on these devices is received when the Endpoint Agent component is integrated with the NDR functionality.
- External source
Information is received from systems that use the Kaspersky Anti Targeted Attack Platform API NDR and send information about users to Kaspersky Anti Targeted Attack Platform.
Sources are listed in order of decreasing priority of information coming in from these sources. The application processes information about users in accordance with the priority of the received information. User information from a higher-priority source may override information from other sources. The application also automatically removes users from tables if information about such a user had been obtained from an External source, but the users are missing in new information received from these sources.
You can view information about users in the Assets section on the Users tab.
When viewing the table of users, you can configure, filter, search, and sort users, as well as navigate to related items. The table of all users can contain up to 200,000 users.
The application displays the following information about device users in the table and in the details area of the selected user:
- User ID is the user ID assigned in Kaspersky Anti Targeted Attack Platform.
- User name is the name of the user account without the domain name or host name of the device.
- Full name is the name of the user account with the domain name or host name of the device.
- Groups lists names of user groups of which the user is a member.
- Device is the name and address of the device.
- Origin is the source of information about the user.
- SID is the user's security ID.
- Account status is the status corresponding to the received value for enabling or disabling the account.
- Lock is the status corresponding to the received value of the account blocking setting.
- Change password at next logon is an attribute that reflects whether the user must change the password at next logon.
- Block password change by user is an attribute that reflects whether the user is prohibited from changing the user's own password.
- Password validity period is the status corresponding to the received value of the setting that enables or disables the validity period limit for the user's password.
- Data received is the date and time when the information about the user account was last received.
- Description is the description specified for the user account.
When monitoring users, the application registers events using the Asset Management technology. Events are registered with system event type code 4000005600. Events are registered when user accounts are automatically added, modified, or deleted on devices.
You can edit the available settings of event types.
Page top
Monitoring file execution on devices
Kaspersky Anti Targeted Attack Platform can monitor file execution on devices known to the application. File execution is monitored based on information received from EPP applications. Based on this information, the application generates a table of executable files.
To automatically get information about file execution from EPP applications, the following conditions must be satisfied:
- Endpoint Agent must be installed on the devices.
- Asset Management methods must be enabled to detect device activity and device information.
For the table of executable files, the following restrictions on the number of items and storage durations apply:
- The total number of executable files may not exceed 100,000.
If the maximum number of executable files is reached, the application automatically removes 10% of the oldest entries.
- The maximum storage duration of an executable file before information about its execution is received again is 90 days.
If new information about file execution is not received before the maximum storage duration expires, the application automatically removes the entry of this file.
If necessary, users with the Administrator role can delete executable files manually.
To view the table of executable files:
- Select the Assets section in the application web interface window.
- Go to the Executable files tab.
The table of executable files is displayed.
When viewing the table of executable files, you can configure, filter, search, and sort the files, as well as navigate to related items.
The table displays the following information:
- File ID is the file ID assigned in Kaspersky Anti Targeted Attack Platform.
- Device is the name and address of the device.
- Name is the name and version of the application, or the file name.
- Data received is the date and time when the information about the file was last received.
- Product is the name of the software product saved in the operating system of the device.
- Product version is the version of the software product saved in the operating system of the device.
- Vendor is the name of the vendor of the application.
- Path is the full path to the file.
- File size is the amount of disk space occupied by the file.
- MD5 hash is the checksum of the file calculated using the MD5 hashing algorithm.
- SHA256 hash is the checksum of the file calculated using the SHA256 hashing algorithm.
- Signature is the result of verifying the digital signature of the file: Valid (if the digital signature was verified successfully) or Invalid (for example, if the certificate has expired).
- Created is the date and time when the file was created.
- Changed is the date and time the file was last modified.
- Origin is the source of information about the file.
- Attributes is the list of file attributes.
- Description is the description set for the file.
Active device polling jobs
Using the active polling jobs, you can conduct a security audit of monitored devices in terms of receiving accurate and complete information about devices and their configurations directly from the devices themselves. Active polling is achieved using connectors. To actively poll devices, you need to add one or more Active poll connectors to the application.
Connectors provide different active polling methods. Active polling methods stipulate the protocols as well as commands and functions of these protocols. The built-in Active poll connector type contains a set of methods that support active polling over application-layer protocols as well as general-purpose protocols. Kaspersky Anti Targeted Attack Platform supports the following methods for active polling of devices:
- Polling via ARP (only for computers with the kernel version 4.3 or later)
- Polling via SMB
- Polling via SNMP
- Polling via SSH
- Polling via WinRM HTTP
- Polling via WinRM HTTPS
- Polling via WMI
The methods let you get different sets of device information. You can select the information that you need and the methods to be used when configuring active polling.
Some methods use secrets to connect to devices. Device connections are made using credentials from secrets added to the application.
Using appropriate methods, the application can automatically update the following device information based on active polling results:
- Name that represents the device in the application
- Name that represents the device on the network (network name)
- Vendor name of the device hardware
- Model name of the device
- Version number of the device hardware
- Vendor name of the device software
- Name of the device software
- Version number of the device software
- Address information for network interfaces of the device
- Name of the operating system installed on the device (only for devices running Windows and Linux operating systems)
For a list of operating systems supported by the application for actively polling devices, see the Appendix.
The application does not update data for which the automatic update function was disabled using the Autoupdate toggle button when the device was added or when device information was edited. The application also evaluates the accuracy of received device information and in some case may not update previously received information.
Some active polling methods support detecting risks and modifying the topology map with the obtained device information.
You can manually run security audit jobs or configure a schedule to automatically run each job. Only users with the Senior security officer role can run active polling jobs.
When using the active polling functionality, you must keep in mind the following special considerations and limitations:
- The functionality becomes available after adding a license key.
- Application modules of connectors that are used for actively polling of devices need network access to the devices to send requests to and receive data from the devices. If the application modules are running on the host with installed application components, to ensure network access to devices, this computer must have a network interface with a connection to the network of the devices to be polled. Network interfaces of monitoring points cannot be used for this purpose if these network interfaces receive mirrored corporate LAN traffic (for example, from SPAN ports of network switches).
- Unexpected problems may arise when active polling devices if these devices misinterpret the commands of the active poll. The problems may be caused by misconfiguration or highly specialized configuration of devices. Also, problems can arise due to hidden errors in the network configuration, which do not manifest during normal communication of devices. Therefore, the risks of the following potential consequences are involved in active polling of a device:
- The device powering off
- Connectivity being lost with the device
- Complete or partial device malfunction
- Slower-than-normal operation
- Other potential faults of the network and equipment
Adding active polling job
For devices known to the application, you can add active polling jobs.
Only users with the Senior security officer role can add active polling jobs. Adding active polling jobs is available after adding a license key.
The active polling job is configured using the Wizard. The wizard lets you configure the job step by step. After completing the configuration, you can wait until the scanning begins on schedule or start the job manually.
When adding an active polling job, you can invoke the Configuration Wizard in the following ways:
- Adding a job with blank settings. To do this:
- Select the Assets section.
- On the Active polling tab, click Add job.
The settings of the configuration wizard do not have default values.
- Adding a job for selected devices. To do this:
- Select the Assets section.
- On the Devices tab, select the devices for which you want to add an active polling job. You can select no more than 100 devices.
- In the toolbar above the devices table, open the Create job drop-down list and select Active polling.
By default, a list of devices made up of the selected devices is created in the settings of the configuration wizard.
To configure the job in the window of the configuration wizard:
- Read the active polling considerations in the warning window, and confirm that you accept the risks associated with using the active polling module.
- In the Select devices section of the Wizard, create a list of devices for which you want to perform active polling. Select up to 100 devices.
You can create a list of devices using the Add to job and Delete from job buttons. To add a device, the application opens a window with the device selection table. You can filter and sort the table to display the devices that you need.
- In the Select parameters section of the wizard, select the check boxes for the specific device information that you want to update using active polling. You can also enable risk detection (the Risks check box) and discovery of topology settings for devices (the Topology settings check box).
- In the Select methods section of the wizard, do the following:
- Select an active polling module.
- Select the check boxes for the specific methods that you want to use for getting device information, risk detection, and/or reading topology settings.
Methods that can be used are grouped by connectors that provide the ability of actively polling devices. The list contains only methods that support getting the selected information. If a connector cannot be used to actively poll the selected devices, the available methods are not displayed for this connector (for example, if the connector is disabled or an address space that does not contain the addresses of the selected devices is selected for the connector).
- Configure the methods for each connector as needed. For example, for Polling via SSH, specify a port and a credentials secret.
If a secret with the required credentials has not been added to the application, you can open a new tab in the browser without closing the Configuration Wizard window, connect to the Server and add the secret, and then use the button in the Configuration Wizard window to refresh the list of secrets.
We do not recommend using the same secret for active polling of devices on the network because this negatively affects the level of information security.
Methods that require configuring settings are highlighted in red. To update the settings, click the
 button to the right of the desired method.
- In the Job configuration section of the wizard, configure the rest of the job settings:
- Enter a name and description for the job.
You can use letters, numerals, spaces, and the following special characters:
! @ # № $ % ^ & ( ) [ ] { } / \ : ; , . - _. The name of the job must begin and end with any valid character other than a space.The job name must contain no more than 256 characters. The job description must contain no more than 4,096 characters.
- To run the job according to a schedule, enable the Run job according to schedule option and configure the schedule settings:
- In the Frequency drop-down list, select how often to run the job: Hourly, Daily, Weekly, or Monthly.
- Depending on the selected option, specify the values for the settings to define the precise job start time.
The application run the job according to the schedule, provided that the previous start of this job has been completed. If by the time a scheduled job is started its previous launch has the Running status, the application skips the run of the scheduled job.
- Enter a name and description for the job.
- Click Create job or Create and run to close the wizard.
The specified settings are displayed in the job details.
Page top
Editing an active polling job
Only users with the Senior security officer role can edit active polling jobs.
To edit an active polling job:
- Select the Assets section.
- On the Active polling tab, select the job for which you want to change the settings.
- Click Edit.
The Configuration Wizard starts. the settings of the selected job are specified as default values in the settings of the configuration wizard.
- In the Job configuration section of the wizard, configure the rest of the job settings:
- Enter a name and description for the job.
You can use letters, numerals, spaces, and the following special characters:
! @ # № $ % ^ & ( ) [ ] { } / \ : ; , . - _. The name of the job must begin and end with any valid character other than a space.The job name must contain no more than 256 characters. The job description must contain no more than 4,096 characters.
- To run the job according to a schedule, enable the Run job according to schedule option and configure the schedule settings:
- In the Frequency drop-down list, select how often to run the job: Hourly, Daily, Weekly, or Monthly.
- Depending on the selected option, specify the values for the settings to define the precise job start time.
The application run the job according to the schedule, provided that the previous start of this job has been completed. If by the time a scheduled job is started its previous launch has the Running status, the application skips the run of the scheduled job.
- Enter a name and description for the job.
- Click Edit job to close the wizard.
The specified settings are displayed in the job details.
Page top
Viewing the table of active polling jobs
The table of active polling jobs is displayed in the Assets section on the tab Active polling.
Job settings are displayed in the following columns of the table:
- Job ID.
Job ID assigned in Kaspersky Anti Targeted Attack Platform.
- Name.
Name that represents the job in the application.
- Description.
Job description
- Created.
Date and time when the job was added to the application.
- Changed.
Date and time of the last modification in the application.
- Devices selected.
Number of devices selected for the job.
- Schedule.
Information about the schedule that the application uses to run the job.
- Status of last run.
The resulting status of all device scans when the job was last run.
- Last run.
Date and time when the job was last run.
- Next run.
Date and time of the next scheduled run of the job.
When viewing the table of active polling jobs, you can use the configuration, filter, search, and sorting functions.
Starting and stopping active polling jobs
You can manually start and stop active polling jobs. When you start or stop a job, the application starts or stops all scans on the devices that are selected for that job.
You can stop or run the job depending on the status of the last job run. For example, a job cannot be started if the status of its last run is Running.
Only users with the Senior security officer role can manually start and stop active polling jobs.
To start an active polling job:
- Use the web interface to connect to the Central Node with the Senior security officer role.
- Select the Assets section.
- On the Active polling tab, select the job you want to start.
The details area is displayed in the right part of the web interface window.
- Click Start. The button is disabled if the job cannot be started.
Kaspersky Anti Targeted Attack Platform starts the job. You can view information about the device scans in progress on the Runs tab in the job details.
To stop an active polling job:
- Use the web interface to connect to the Central Node with the Senior security officer role.
- Select the Assets section.
- On the Active polling tab, select the job you want to stop.
The details area is displayed in the right part of the web interface window.
- Click Stop. The button is disabled if the job cannot be stopped.
Viewing general information about the active polling job runs
You can view general information on the runs of active polling jobs in the jobs table. The table displays information about the most recent runs not including the information about device scans. To view general information on all job runs, including information about the device scans, select the job and in the details area, open the Runs tab.
General information about active polling job runs includes the following:
- The status of the job or device scan.
The following statuses are possible:
- Pending – a command to start the scan has not been sent yet.
- In progress – the job is starting, or the scan is in progress.
- Canceling – the start of the job or scanning is being stopped.
- Canceled – the start of the job or scanning is stopped.
- Completed – the scan completed successfully or all scans within the job run completed successfully.
- Error – an error occurred during a scan or errors occurred in all scans within the job run.
- Partially successful – the job completed with a partially successful result: some scans have the Completed status while some scans have a status of Canceled or Error.
- Start date and time.
- End date and time.
- Run time
Viewing a report on the active polling job execution
You can view reports containing the device scan results when viewing the details of an active polling job run. The application generates reports for the jobs completed with the following statuses: Completed, Partially successful, Canceled, and Error.
In the report, the following details are displayed:
- Name of the device that was scanned.
- Device settings update status.
- List of device settings grouped by their update status.
- List of methods grouped by their execution status. If an error occurs when a method is being employed, the application displays its reason.
To view a report on the active polling job execution:
- Use the web interface to connect to the Central Node with the Senior security officer role.
- Select the Assets section.
- On the Active polling tab, select the job for which you want to view the run report.
The details area is displayed in the right part of the web interface window.
- In the details area, go to the Runs tab and select the desired job run.
The details area is displayed in the right part of the web interface window. The details area displays detailed information about the selected job run.
Deleting active polling jobs
You can delete active polling jobs. However, you cannot delete the jobs with a last run status of Running or Pending.
Only users with the Senior security officer role can delete active polling jobs.
To delete active polling jobs:
- Use the web interface to connect to the Central Node with the Senior security officer role.
- Select the Assets section.
- On the Active polling tab, select the jobs you want to delete.
- Click Delete.
This opens a confirmation prompt window.
- In the prompt window, confirm deletion of the jobs.
You can delete only the jobs whose last run status is not Running or Pending. If there are jobs with a status of Running or Pending among the selected jobs, the corresponding message is displayed. To delete such jobs, you must first stop the jobs.
Configuring address spaces
Kaspersky Anti Targeted Attack Platform monitors devices and their interactions, taking into account address spaces (hereinafter also referred to as "AS"). Address spaces are used to classify device addresses into sets by some attribute (for example, by the network segments that the devices belong to).
To describe address spaces, the application uses lists of rules and subnets.
An address space rule is a set of parameters that determine whether an address belongs to the address space. To be associated with an address space, a MAC or IP address must match at least one address space rule. If an address matches multiple rules, the application picks the address space whose rule defines the conditions of association in the least general way (for example, if the address is explicitly specified in the rule).
Address space subnets are used to check IP addresses discovered by the application. Depending on the type of subnet the discovered IP address belongs to, the application may perform different Asset Monitoring actions and Interaction Control actions.
You can configure address spaces in the Assets section of the Address spaces tab. Each address space is represented by a section with information about the address space. The section comprises a title and subsections with tables of rules and subnets. When viewing information about address spaces, you can expand and collapse the sections.
Default address space
By default, the application has one address space configured, the Default address space. This address space contains a single rule that associates all MAC and IP addresses with this address space. By default, the list of subnets of the Default address space contains the standard set of subnets most frequently used in enterprise networking.
You cannot edit the rule of the Default address space or add other rules to this address space. However, users with the Senior security officer role can edit the list of subnets in this address space to configure a set of subnets that take into account the way IP addressing of devices is set up in your corporate network. If Kaspersky Anti Targeted Attack Platform receives data from EPP applications, the application can use this data to automatically add subnets to the list of subnets.
Additional address spaces
If necessary, you can configure multiple address spaces in the application in addition to the Default address space. You can create arbitrary rules and sets of subnets for the added address spaces. Addresses matching the conditions of the added address spaces become associated with these address spaces. The rest of the addresses remain associated with the Default address space.
You may need to add address spaces, for example, if you are using devices with the same address in different network segments. In this case, after address spaces are added and configured, the application can disambiguate address information by additional attributes that the application adds to addresses, that is, by address space names.
For address space usage examples, see the Appendix.
Relations of addresses and address spaces
When using multiple address spaces, the application adds address space name attributes to all addresses that are specified in objects of the application: devices, risks, rules, events, and other objects. Address space name attributes are no longer displayed for addresses if you remove all non-default address spaces (address space attributes remain only for addresses in events and in some device-related risks).
Address space name attributes indicate the relations between addresses and address spaces. Relations with address spaces make addresses dependent on these address spaces.
Relations between addresses and address spaces lead to the following special consideration when deleting an address space: the application automatically deletes all addresses associated with the deleted address space. Such addresses are deleted from all application objects except for events. When an address is removed from an object, the application checks if other addresses remain in that object, and if no other addresses remain, the application also deletes the object itself (for example, a device).
About address space rules
The rules of address spaces are displayed in the Rules blocks within address space descriptions. Information about rules is displayed in the title bar of the address space and in the table of rules.
Address space rule settings are displayed in the following columns of the table:
- Source.
The type of the source of data about address information and the list of selected data sources. The following data source types are possible:
- Monitoring points – monitoring points selected for the rule.
- Integration servers – integration servers selected for the rule (the data on address information received from the selected integration servers will satisfy the address space rule).
- Active polling modules – active polling module connectors selected for the rule (the data on address information received from the selected active polling modules will satisfy the address space rule).
The data sources must be specified in the address space rules after adding the objects to be used as sources to the application. For example, connectors for the Active poll modules data source must be specified after adding connectors of the Active poll type.
- OSI model layers
Selected layers of the OSI (Open Systems Interconnection) network protocol stack for the address space rule. You can configure the rule for addresses of the following layers of the OSI model:
- Data Link (L2) – MAC addresses.
- Network (L3) – IP addresses.
- Data Link and Network (L2 and L3) – MAC addresses and IP addresses.
- VLAN ID.
VLAN IDs used for the VLAN technology in accordance with the IEEE 802.1q standard. When used for an address space rule, the VLAN ID may take the following values:
- Any – VLAN technology is used for network interactions between devices, and any VLAN IDs can be used.
- Unallowed – VLAN technology is not used for network interactions between devices.
- Any or not used – VLAN technology is either not used for network interactions between devices, or it is used with any VLAN IDs.
- Fixed values with a list of VLAN IDs – VLAN technology is used for network interactions between devices, and an address space can include only address information that has one of the listed VLAN IDs.
- IP addresses
IP addresses included in the address space. You can specify addresses individually, as ranges, or as a CIDR subnet address.
When viewing the rule table, you can use the configuration functionality (by clicking the  icon) as well as the search functionality.
About address space subnets
The subnets of address spaces are displayed in the Subnets blocks within address space descriptions.
The application matches the discovered IP addresses against the lists of subnets of address spaces and, depending on whether the IP addresses are found to belong to certain types of subnets, can perform the following actions:
- Add a device with the discovered IP address to the table of devices and monitor the activity of this device.
- Display a device with its detected IP address on the network interactions map and the topology map as its corresponding type of node (known device, unknown device, or WAN node).
- Display the connection on a network interactions map, in which one of the interaction parties is the device with the discovered IP address.
- Scan the interactions of the device with the discovered IP address according to the configured rules (Interaction Control rules, Intrusion Detection rules, and correlation rules).
- Ignore the activity of the device with the discovered IP address.
Subnet settings of the address space are displayed in the following columns of the table:
- Subnet.
Subnet address in Classless Inter-Domain Routing (CIDR) format:
<base address of the subnet>/<number of bits in the mask>. Subnet addresses are displayed as a tree that represents the subnet nesting hierarchy. - Type.
Type of the subnet that stipulates its purpose. The following types are possible:
- Private, IT – subnet for devices that serve as information technology (IT) resources, such as file servers.
- Private, DMZ – subnet for devices that reside within a network segment of a demilitarized zone (DMZ), such as servers that handle requests from external networks.
- Public – subnet that is considered to be an external (global) network for devices in other types of subnets. IP addresses from this subnet are represented on the network interactions map by the WAN node.
- Link-local – subnet for network interactions within one segment of the local area network (not routed).
- Range
The range of IP addresses included in the subnet.
- Automatically add subnets
Indicates whether the automatic adding of nested subnets based on information received from EPP applications is enabled or disabled. If this mode is enabled, the application adds nested subnets based on information received from EPP applications.
When viewing the table of subnets, you can use the configuration functionality (by clicking the icon) as well as the filtering, search, and sorting functionality.
Adding an address space
You can add address spaces to the application if you need to classify device addresses into sets according to some criterion (for example, based on devices belonging to network segments).
The maximum number of address spaces in the application is 100.
Only users with the Senior security officer role can add address spaces.
To add an address space:
- Use the web interface to connect to the Central Node with the Senior security officer role.
- Select the Assets section.
- On the Address spaces tab, open the details area by clicking Add AS.
- Enter the name of the address space.
You can use letters, numbers, the space character, and the following special characters:
! @ # № $ % ^ & ( ) [ ] { } ' , . - _.The address space name must satisfy the following requirements:
- Begins and ends with any character other than a space.
- Contains up to 255 characters.
- Does not reuse the name of another address space (case-insensitive).
We recommend using address spaces 6–8 characters long or less. If the name is too long, the address information may not fit in the cells of some data tables (for example, in the table of devices).
- If necessary, enter a text description of the address space.
- Configure the settings of the first address space rule.
- If necessary, add and configure additional address space rules by clicking Add rule.
The total number of rules in an address space cannot exceed 10.
- Click Save.
This button is unavailable if not all required settings are specified, or if some settings are invalid.
The lower part of the Address spaces tab will show a separate block containing information about the added address space.
Page top
Creating a subnet list for Asset Management
This section contains information about the features available for generating a list of subnets for asset management.
For address spaces, you can create lists of subnets that take into account the way device addressing works in your corporate network. This section provides instructions on using the features for generating a list of subnets.
If Kaspersky Anti Targeted Attack Platform receives data from EPP applications, the application can use this data to automatically add subnets in the corresponding address spaces. The application automatically adds discovered subnets if they are nested inside subnets for which the automatic subnet addition mode is enabled.
Only users with the Senior security officer role can manage the list of subnets.
Adding a subnet
To add a subnet:
- Use the web interface to connect to the Central Node with the Senior security officer role.
- Select the Assets section.
- On the Address spaces tab, expand the block containing information about the address space in which you want to add a subnet.
- In the header of the Subnets block, click the
 icon.
icon.The details area is displayed in the right part of the web interface window.
- In the Subnet field, enter the subnet address in CIDR format:
<base address of subnet>/<number of bits in mask>. - In the Type drop-down list, select the type of subnet according to its purpose.
- Enable or disable the Automatically add subnets toggle switch, to enable or disable automatic addition of nested subnets according to data received from EPP applications.
If this mode is enabled, the application adds nested subnets under this subnet based on information received from EPP applications. For these nested subnets, the default type is the type selected for the current subnet.
- Click Save.
A subnet is added to the list of subnets at the corresponding level of the tree.
Page top
Editing subnet settings
To edit subnet settings:
- Use the web interface to connect to the Central Node with the Senior security officer role.
- Select the Assets section.
- On the Address spaces tab, expand the block containing information about the address space in which you want to edit the subnet settings.
- Expand the Subnets block and select the relevant subnet.
The details area is displayed in the right part of the web interface window.
- Click Edit.
- Depending on what you want, do the following:
- In the Subnet field, enter the subnet address in CIDR format:
<base address of subnet>/<number of bits in mask>.The address of the root subnet is not editable.
- In the Type drop-down list, select the type of subnet according to its purpose.
When changing the type of a subnet, keep in mind that the new subnet type may affect the actions that the application performs with IP addresses from the subnet. For example, if you select the Public type, the network interactions map will no longer display links to devices that were assigned IP addresses from this subnet.
- Enable or disable the Automatically add subnets toggle switch, to enable or disable automatic addition of nested subnets according to data received from EPP applications.
If this mode is enabled, the application adds nested subnets under this subnet based on information received from EPP applications. For these nested subnets, the default type is the type selected for the current subnet.
- In the Subnet field, enter the subnet address in CIDR format:
- Click Save.
If the Subnet value is changed, the tree hierarchy level may be changed for a subnet.
Page top
Deleting subnets
In the list of subnets of the address space, you can delete any subnet except the root subnet in the tree (subnet 0.0.0.0/0).
To delete subnets:
- Use the web interface to connect to the Central Node with the Senior security officer role.
- Select the Assets section.
- On the Address spaces tab, expand the block containing information about the address space from which you want to delete subnets.
- Expand the Subnets block and select the subnets to delete.
The details area is displayed in the right part of the web interface window.
- Click Delete.
This opens a confirmation prompt window.
- In the prompt window, confirm deletion of the subnets.
The deleted subnets are removed from the list of subnets. If the deleted subnet contained nested subnets, these subnets remain in the list (however, the level of these subnets in the hierarchy tree is changed).
Page top
Viewing information about devices with IP addresses from the selected subnets
You can view information about devices that have IP addresses from selected subnets in the address space. Device information is displayed in the table of devices. The table of devices is automatically filtered by subnet addresses.
To view information about devices in the table of devices:
- Select the Assets section.
- On the Address spaces tab, expand the block containing information about the address space containing the relevant subnets.
- Expand the Subnets block and select the subnets for which you want to view information about devices.
The details area is displayed in the right part of the web interface window.
- Click Show devices.
This opens the Devices tab in the Assets section. The table of devices is filtered by IP addresses in the address information of devices.
Page top
Changing an address space
For the added address spaces, you can edit the names, text descriptions, and rule settings. You cannot edit any of these for the Default address space, however.
You can also create lists of subnets for any address spaces (including the list of subnets of the Default address space).
When managing the rule settings of an address space, you must take into account the relations this address space has with addresses that are specified in application objects: devices, risks, rules, events, and other objects. If editing rule settings of an address space severs the relations of this address space with addresses, the application automatically deletes such addresses. This can lead to the deletion of the objects themselves (for example, devices) if these objects do not have any other addresses.
Only users with the Senior security officer role can edit the names, text descriptions, and rule settings of address spaces.
To edit the name, text description, or rule settings of an address space:
- Use the web interface to connect to the Central Node with the Senior security officer role.
- Select the Assets section.
- On the Address spaces tab, click the icon in the block containing information about the relevant address space.
The details area is displayed in the right part of the web interface window.
- Depending on what you want, do the following:
- Enter the name of the address space.
You can use letters, numbers, the space character, and the following special characters:
! @ # № $ % ^ & ( ) [ ] { } ' , . - _.The address space name must satisfy the following requirements:
- Begins and ends with any character other than a space.
- Contains up to 255 characters.
- Does not reuse the name of another address space (case-insensitive).
We recommend using address spaces 6–8 characters long or less. If the name is too long, the address information may not fit in the cells of some data tables (for example, in the table of devices).
- Enter a description for the address space.
- Manage the settings of address space rules.
- If necessary, add and configure additional address space rules by clicking Add rule or delete any unnecessary rules by using the icons.
The total number of rules in an address space cannot exceed 10.
- Enter the name of the address space.
- Click Save.
This button is unavailable if not all required settings are specified, or if some settings are invalid.
- In the prompt window, confirm the changes of address space settings.
Deleting an address space
You can delete added address spaces. The Default address space cannot be deleted.
When deleting an address space, you must take into account the relations this address space has with addresses that are specified in application objects: devices, risks, rules, events, and other objects. If deleting an address space severs the relations of this address space with addresses, the application automatically deletes such addresses. This can lead to the deletion of the objects themselves (for example, devices) if these objects do not have any other addresses.
Only users with the Senior security officer role can delete address spaces.
To delete an address space:
- Use the web interface to connect to the Central Node with the Senior security officer role.
- Select the Assets section.
- On the Address spaces tab, click the icon in the block containing information about the address space that you want to delete.
This opens a confirmation prompt window.
- In the prompt window, confirm the deletion of the address space.
Working with the network interactions map
The network interactions map is a visual display of discovered interactions between devices. You can use the network interactions map to view information about device interactions at various time periods.
To view the network interactions map:
- Select the Network map section in the application web interface window.
- Go to the Network interactions map tab.
The network interactions map is displayed.
The following objects can be displayed:
- Nodes. These objects represent the senders and recipients of network packets.
- Device groups. These objects correspond to groups in the device group tree. Groups contain nodes representing devices included in these groups as well as child groups.
- Links. These objects represent interactions between nodes.
Nodes and links appear on the network interactions map based on the data obtained from traffic or from Endpoint Agent over a certain period of time. Device groups are displayed continuously.
You can filter nodes and links. By default, the network interactions map displays objects in real time with a defined filtering period of one hour.
Objects with issues are highlighted on the network interactions map. The application considers the following objects to have issues:
- A node if it has unprocessed events with a score of 4.0 or higher, or if it represents a device with the Unauthorized status.
- A link if it has to do with events with a score of 4.0 or higher. Only events registered during the given object filtering period are taken into account. The current status of events is not taken into account.
- A group, if it contains devices with issues, or if nodes in this group have links with issues. Objects taken into account can belong to the group itself or to any of its child groups at any nesting level.
Nodes on the network interactions map
Nodes on the network interactions map can have the following types:
- A device known to the application. A node of this type represents a device that is listed in table of devices.
- A device unknown to the application. A node of this type represents a device with a unique IP or MAC address that is not listed in the device table. Such a node may appear on the network interactions map, for example, if you use the
pingcommand to send network packets to a non-existent device. Nodes of devices that the application does not recognize are displayed individually if their total number (in accordance with the current filtering settings on the network interactions map) does not exceed 100. If more such devices exist, unknown devices are jointly represented by a single node.
Information displayed on nodes that represent devices known to the application
For nodes that represent devices known to the application, the following information is displayed on the network interactions map at maximum zoom:
- The specified device name.
- The icon of the device category.
- The IP address of the device (if it has no IP address, the MAC address is displayed).
- Various icons depending on the following conditions:
- Whether the Router attribute is set for the device
- Whether the Endpoint Agent is installed on the device (the color of the icon depends on its connection status)
- Whether the device has the Archived status
- A thick line on the left border of the node in one of the following colors, depending on the security state of the device:
- Green for the OK security state
- Yellow for the Warning security state
- Red for the Critical security state
If the device has the Unauthorized status or the security state of the device is not OK, the node has a red background.
Information displayed on nodes that represent devices unknown to the application
For nodes that represent devices unknown to the application, the following information is displayed on the network interactions map at maximum zoom:
- If the node represents a single unknown device, the IP or MAC address of the device is displayed. If the node represents multiple unknown devices (a node that includes more than 100 devices unknown to the application), Unknown devices is displayed.
- Icon for an unknown device and its status
 .
.
Nodes representing devices unknown to the application have a gray background.
Page top
Device groups on the network interactions map
Groups from the device group tree can be collapsed or expanded on the network interactions map. Collapsed groups are displayed as icons similar to nodes. Expanded groups are displayed as boxes with nodes and other groups included in them.
Information displayed on collapsed groups
If a group is collapsed, the following is displayed at maximum zoom:
- The name of the group.
- Number of devices that match the current filtering criteria on the network interaction map. Devices in this group and in all its child groups at all nesting levels are taken into account.
- Number of child groups at all nesting levels.
If a group contains devices or links with issues (including child groups at any nesting level), the border of the group is colored red. Information displayed on expanded groups
The expanded group's box contains a title bar with the name of the group and an area for displaying objects. The group box displays devices included in this group, as well as child groups at the nesting level immediately below it. Among the devices included in the group, only those devices are displayed that satisfy the filtering criteria current configured the network interactions map.
If a group contains devices or links with issues (including child groups at any nesting level), the box has a red background.
Collapsing and expanding groups
You can expand a collapsed group by double-clicking the group icon. You can collapse an expanded group by double-clicking the title bar of that group's box or by clicking  in the title bar.
To expand multiple collapsed groups at the same time:
- On the network interactions map, select multiple collapsed groups by doing one of the following:
- Press and hold the SHIFT key, then use the mouse to select a rectangular area with the groups that you want to select.
- Press and hold the CTRL key and click every collapsed group that you want to select.
- Click
 in the toolbar located in the left part of the network interactions map display area (the button is available if at least one collapsed group is selected).
To collapse all expanded groups at the same time:
Click in the toolbar located in the left part of the network interactions map display area (the button is available if at least one group is expanded).
Links on the network interactions map
Links on the network interactions map are discovered by analyzing network packets in which addresses of senders and recipients can be matched with addresses of nodes.
Each links represents two sides of an interaction. One of the following objects on the network interactions map can be a party of an interaction:
- Node of one of the following types:
- A device known to the application.
- A device unknown to the application.
- The common node of unknown devices (if the link shows interaction with one or more unknown devices inside this node).
- A collapsed group if the link shows interaction with one or more devices in this group.
Depending on the scores of events registered while detecting interactions, the link can be displayed a colored line:
- Gray for an interaction that caused no events to be registered or only events with scores of 0.0–3.9.
- Red for an interaction has caused events to be registered with a score of 4.0–10.0.
Only events registered during the given object filtering period are taken into account for links. The current status of the events is not taken into account.
The application stores link information in a database at . The total amount of stored records cannot exceed the configured limit. If the amount exceeds the limit, the application automatically deletes 10% of the oldest records. You can set the maximum network interactions map size when configuring the storage settings.
Page top
Viewing object details
Detailed information about objects represented on the network interactions map is displayed in the details area. To display detailed information, you can select an object with the mouse (if you want to view the details of a group, you must first collapse the group).
For nodes, the following information is displayed:
- If the node represents a device known to the application, the details area displays the same information that appears in the device table.
- If the node represents a single device unknown to the application, the details area displays the MAC and/or IP addresses of the device (with the names of address spaces if extra address spaces have been added to the application).
- If the common node of unknown devices is selected, the following information is displayed:
- The number of nodes that this node contains, taking into account the current filtering settings.
- IP addresses displays the number of IP addresses of unknown devices and the first 100 IP addresses (with the address space names, if extra address spaces have been added to the application). This section is displayed if some unknown device nodes have IP addresses.
- MAC addresses displays the number of MAC addresses of unknown devices and the first 100 MAC addresses (with the address space names, if extra address spaces have been added to the application). This section is displayed if some unknown device nodes have MAC addresses.
For groups, the following information is displayed:
- Parent group displays the path to the group in the device group tree. If the group is at the top level of the hierarchy, N/A (this is a top-level group) is displayed.
- The number of devices in this group and in all its child groups at all nesting levels.
- Information about the number of objects with issues in the selected group and in its child groups at all nesting levels. If there no such objects exist, the security state is displayed as OK.
For links, the following information is displayed:
- Severity is the icon corresponding to the maximum severity level of the events associated with the link. If no events are associated with the link, No events is displayed. Only events registered during the given object filtering period are taken into account. The current status of events is not taken into account.
- Sections with basic information about the first and second parties of the interaction:
- If an unknown device node is a party of the interaction, this section displays the name or address of the device, category, and address information (whereas for a device known to the application, the address information is displayed only for those network interfaces that were involved in the interaction). For a known device, the device status is also displayed.
- If a collapsed group is a party of the interaction, this section displays the name of the group and the number of devices and child groups it contains.
- If the common node of unknown devices is a party of the interaction, this section displays the name of the node, Unknown devices, and the number of nodes represented by this node.
- Protocols is a section with a list of protocols involved in the interaction. For each protocol, the amount of transmitted data is indicated, calculated from the detected network packets. The section is not displayed if one of the parties to the interaction is the common node of unknown devices.
Zooming the network interactions map
The network interactions map can be zoomed from 1 to 100%. The current scale is displayed in the toolbar located in the left part of the network interactions map display area.
To zoom the network interactions map:
Use the mouse wheel or the + and - buttons in the toolbar next to the current zoom value.
Zooming out the network interactions map hides some information displayed in nodes and collapsed groups.
At zoom levels below 25%, icons and text information are hidden in nodes and collapsed groups. The display of nodes and collapsed groups changes as follows:
- On a node representing a device known to the application, the device status is displayed in the upper right corner as a colored triangle:
- Green means the device has the Authorized status.
- Red means the device has the Unauthorized status.
- Gray means the device has the Archived status.
- On a collapsed group, a triangle in the upper right corner indicates the presence of objects with issues. This triangle is filled with one of the following colors:
- Green if the group does not contain objects requiring attention.
- Red if the group contains objects with issues.
Positioning the network map
If necessary, you can change the positioning of the network interactions map manually or automatically. Automatic positioning pans and zooms the network interactions map to fit all nodes satisfying filtering criteria and all expanded groups.
To position the network interactions map manually:
- Point to any space on the network interactions map that is not occupied by objects.
- Click and hold to drag the network interactions map.
To position the network interactions map automatically:
Click  in the toolbar in the left part of the network interactions map display area.
The map is panned and zoom to fit all nodes and expanded groups.
Page top
Pinning and unpinning nodes and groups
By default, nodes and collapsed groups are not pinned to the network map. Unpinned nodes and collapsed groups can be automatically moved around to optimize the display of other objects.
Nodes and groups are pinned when their location is changed manually or in the process of automatic distribution. You can also pin displayed objects without moving them.
To pin or unpin objects without moving them, you can use the following controls:
- Buttons in the toolbar in the left part of the network interactions map display area. You can click
 or
or  to pin or unpin all nodes and groups displayed on the network interactions map (including nodes in expanded groups).
 - Buttons in the title bar of the expanded group box. You can click or to pin or unpin nodes and groups in the expanded group box only (but not in boxes of nested groups).
The buttons are available if the network interactions map contains objects to which the corresponding actions can be applied.
After the node or collapsed group is pinned, the icon is displayed in the upper-right corner of the node or group (if the zoom level is at least 25%). You can also use this icon to unpin the object.
The pinned node or group stays in place. If a pinned node is no longer displayed on the network interactions map (for example, after applying a filter), the next time it appears in the same place.
Page top
Manually rearranging nodes and groups
You can manually arrange nodes and groups on the network interactions map as you see fit.
Nodes and groups that have been moved become pinned to their new location. You can unpin them if necessary.
Objects included in a group can be moved only within the confines of that group's box.
To rearrange nodes and/or collapsed groups:
- On the network interactions map, select one or more nodes and/or collapsed groups.
To select multiple nodes and/or collapsed groups, do one of the following:
- Press and hold the SHIFT key, then use the mouse to select a rectangular area with the objects that you want to select.
- Press and hold the CTRL key and click every object that you want to select.
- Drag the selected objects to where you want to place them.
Nodes and collapsed groups remain pinned after moving. The icon is added to these objects.
To reposition an expanded group:
Click and drag the expanded group box by its title bar to a new location.
Page top
Automatically arranging nodes and groups
To optimally arrange objects on the map of network interactions, you can use algorithms that automatically rearrange nodes and groups. The following algorithms are provided:
- Radial arrangement
- Alignment to grid
You can apply automatic arrangement algorithms to the following objects:
- All displayed nodes and groups at the top level of the hierarchy in the group tree. Automatic arrangement is performed using the
 (radial arrangement) button and the
  (grid-aligned arrangement) button in the toolbar located in the left part of the network interactions map display area.
 - All displayed nodes and groups within the expanded group. To perform automatic arrangement, you can click the (to arrange radially) and (to align to grid) buttons in the title bar of the expanded group's box.
- Only selected nodes and collapsed groups. Before automatic arrangement, you must select at least three nodes and/or collapsed groups within an expanded group or at the top level of the hierarchy. To select multiple objects, you can press and hold the SHIFT key and draw a selection box around the necessary objects, or you can select multiple objects by CTRL+clicking them. Automatic arrangement is performed using the
 (radial arrangement) button and the
  (grid-aligned arrangement) button in the toolbar located in the left part of the network interactions map display area.
Nodes and groups that have been automatically arranged become pinned to their new location. The icon is added to these objects. You can unpin them if necessary.
Searching for nodes on the network interactions map
You can search for nodes on the network interactions map based on the details of these nodes. All nodes that satisfy the current filtering conditions, including nodes inside collapsed groups and nodes beyond the displayed region of the network interaction map.
For nodes that represent devices known to the application, the search is performed by all columns of the table of devices except Status, Security state, Last seen, Last modified, and Created. The search is also performed by the values of custom fields for devices.
If nodes matching the search query are found, the outlines of these nodes are highlighted in yellow. The outlines of collapsed groups in which the nodes are found are highlighted in the same way. At the same time, the following elements appear in the right part of the Search nodes field:
- The ordinal number of the currently selected object (a found node or a collapsed group with found nodes) among the search results.
- The total number of found objects (nodes and/or collapsed groups with found nodes).
The total number of found objects does not take into account the number of nodes in collapsed groups. If you want nodes in groups to be counted towards the total in search results, expand the collapsed groups.
- Arrows for moving between found objects. You move between found objects in alphabetical order of their names. When moving to the next object, the network interactions map is automatically positioned to display this object.
To find nodes on the network interactions map:
Filtering objects on the network interactions map
This section provides instructions on filtering objects on the network interactions map to limit the number of nodes and links displayed.
Comprehensive filtering of nodes and links
This section contains instructions on comprehensive filtering of nodes and links.
Filtering using a period on the timeline
To filter nodes and links, you can select a time period on the timeline. The timeline is displayed in the lower part of the network interactions map window.
The timeline contains the following elements:
- The starting date and time of the timeline.
- Periods when events with scores of 4.0 and higher were recorded. These periods are displayed as red bars in the lower part of the scale. Periods are not displayed if the configured length of the timeline is more than seven days.
- Filtering period. This period is displayed as a yellow bar with dragging handles at both ends.
- Graph of traffic volume processed by the application. The graph is not displayed if the configured length of the timeline is more than seven days.
- The end of the timeline. Depending on the filtering period, the end of the timeline is displayed as a date and time (if a date and time is specified) or as a Now link.
The following types of filtering periods are possible:
- Period with reference to the current moment. The right end of such a period coincides with the right end of the timeline corresponding to the current moment.
- Period without reference to the current moment. A period of this type can be placed anywhere in the timeline.
To configure filtering of objects by period with reference to the current moment:
- Click the Now button to the right of the timeline. This button is not displayed if the period is already defined with reference to the current moment.
- If you want to specify a different length of the period, do one of the following:
- Drag the left end of the yellow period bar to the required position (the maximum length of period is 7 days).
- Open the settings window by clicking the button above the yellow period bar, select the Anchor to boundary check box, then select a duration (Hour, Day, 7 days) and click OK.
The network interactions map displays only those nodes and connections for which interactions were detected from the beginning of the specified period to the current moment.
To configure filtering by period without reference to the current moment:
- If the period you want to set is out of bounds of the timeline, change the start and/or end date and time of the timeline:
- To change the start date and time of the timeline, click the link in the left part of the timeline to open a window and in that window, select one of the following options:
- Day.
- 7 days.
- 30 days.
- Set the date. For this option, specify a date and time in the displayed field.
- To change the end date and time of the timeline, click the link in the right part of the timeline to open a window and in that window, select one of the following options:
- Now.
- Specify a date. For this option, specify a date and time in the displayed field.
- To change the start date and time of the timeline, click the link in the left part of the timeline to open a window and in that window, select one of the following options:
- Set the period you want. To do so, do one of the following:
- Drag the period on the timeline to where you want it to be.
- Move one or both edges of the yellow period bar on the timeline to where you want the period to be (the maximum length of a period is 7 days).
- Open the settings window by clicking the button above the yellow period bar, then select a duration (Hour, Day, 7 days) and click OK.
- If the period is automatically anchored to the current moment (when you move the period to the extreme right position, the Now button to the right of the timeline is no longer displayed) and you don't want this, disable the automatic anchoring. To do so, open the settings window by clicking the button above the yellow period bar, clear the Anchor to boundary check box and click OK.
Filtering by registered events
On the network interactions map, you can display nodes and links whose information is stored in events associated with the selected nodes.
You can use the filtering functionality if no more than 200 nodes are selected on the network interactions map. You can select nodes either individually or as part of collapsed groups that include the required devices. When you select a collapsed group, all devices in child groups at all nesting levels also end up in the selection.
You can use the following ways of filtering by events:
- Initial filtering by events. Use this method to filter objects by events associated only with the selected nodes.
- Additional filtering by events. Use this method when the initial filtering by events already has been performed (for example, when going to the network interactions map from the table of events) and you need to supplement the filter with events associated with additional selected nodes from among the network interactions displayed on the network interactions map.
To display nodes and links based on initial event filtering:
- On the network interactions map, select one or more nodes and/or collapsed groups.
To select multiple nodes and/or groups, do one of the following:
- Press and hold the SHIFT key, then use the mouse to select a rectangular area with the objects that you want to select.
- Press and hold the CTRL key and click every object that you want to select.
- In the toolbar above the network interactions map, open the Event filter drop-down list.
- In the drop-down list, select Filter.
The network interaction map displays only nodes and links whose information is contained in events associated with the selected nodes. In the toolbar above the network interactions map, a list is displayed with event IDs (the IDs are listed in the chronological order of detection of the associated events).
To add nodes and links to the displayed objects using additional filtering by events:
- Make sure the initial filtering by events already has been performed. To do so, look for the list of event IDs in the toolbar above the network interactions map.
- From among the displayed nodes on the network interactions map, select nodes whose associated events you want to add to the filter.
The details area is displayed in the right part of the web interface window.
- In the toolbar above the network interactions map, open the Event filter drop-down list.
- In the drop-down list, select Add to filter.
The network interaction map additionally displays nodes and links whose information is contained in the events associated with the selected nodes. IDs of detected events are added to the list of IDs in the toolbar.
Page top
Filtering nodes by device status
To filter nodes by device status:
- In the toolbar above the network interactions map, open the Device statuses drop-down list.
A list is displayed with status names for devices known to the application (Unauthorized, Authorized, Archived), as well as the Unknown device status for devices that application does not recognize.
- In the drop-down list, select check boxes for statuses that you want to use as a filtering condition for nodes displayed on the network interactions map.
- Click OK.
The network interactions map displays only those nodes that represent devices with selected statuses.
Page top
Filtering nodes by device security state
To filter nodes by device security state:
- In the toolbar above the network interactions map, open the Device states drop-down list.
A list is displayed containing the security state names of the devices (OK, Warning, Critical).
- In the drop-down list, select check boxes for security states that you want to use as a filtering condition for nodes displayed on the network interactions map.
- Click OK.
The network interactions map displays only those nodes that represent devices with selected security states.
Page top
Filtering nodes by device category
To filter nodes by device category:
- In the toolbar above the network interactions map, open the Device categories drop-down list.
A list is displayed containing the names of categories of devices known to the application as well as special categories for unknown devices.
- In the drop-down list, select check boxes for categories that you want to use as a filtering condition for nodes displayed on the network interactions map.
- Click OK.
The network interactions map displays only those nodes that represent devices of the selected categories.
Page top
Showing and hiding nodes linked to filtered nodes
After filtering the nodes, the network interactions map displays only those nodes that satisfy the specified filtering conditions. However, for a node to be displayed on the network interactions map, this node must have a link to another displayed node. If, given the specified filtering conditions, not all nodes are displayed with which the node has interactions, such a node is also not displayed on the network interactions map. Filtering is applied in the same way to nodes rolled up into the common node of unknown devices: if not all nodes that have interactions with an unknown devices node, this node is excluded from the list of nodes of the common node of unknown devices.
If necessary, you can show the network interactions of all nodes associated with the filtered nodes. All nodes that have been interacted with will be displayed together with the filtered nodes (regardless of the current filtering conditions).
To show or hide nodes associated with filtered nodes:
Use the Linked devices toggle switch in the toolbar above the network interactions map.
Page top
Filtering links by criticality score
To filter links on the network interactions map by their severity scores:
- In the toolbar above the network interactions map, open the Scores of links drop-down list.
A list of event severity levels and ranges is displayed: Low (0.0–3.9), Medium (4.0–7.9), High (8.0–10.0); as well as the No events item, which lets you filter links that have no registered events.
- In the drop-down list, select the check boxes for the severity levels by which you want to filter.
- Click OK.
The network interaction map displays only links that have associated events with selected severity levels.
Page top
Filtering links by communication protocol
To filter links on the network interactions map by protocol:
- In the toolbar above the network interactions map, open the Protocols drop-down list.
This opens a window with a table of protocols displayed as a protocol stack tree. You can control the display of tree nodes using the + and - buttons next to the names of protocols that encompass protocols of the next tiers.
The table columns contain the following information:
- Protocol is the name of the protocol in the protocol stack tree.
- EtherType is the number of the next-layer protocol encapsulated by the Ethernet protocol (if the protocol has a specified number). Displayed in decimal format.
- IP number is the number of the next-layer protocol encapsulated by the IP protocol (if the protocol has a specified number). Specified only for protocols that are part of the IP protocol structure. Displayed in decimal format.
- If necessary, use the search bar above the table to find the protocols that you need.
- In the list of protocols, select check boxes for protocols that you want to use in search conditions.
If you select or clear the check box for a protocol that contains nested protocols, check boxes are also automatically selected or cleared for all nested protocols.
- Click OK.
Only links that used the selected protocols are displayed on the network interactions map.
Page top
Filtering links by OSI model layer
You can filter links by interaction layers that correspond to the layers of the Open Systems Interconnection (OSI) network protocol stack.
To filter link on the network interactions map by OSI model layers:
- In the toolbar above the network interactions map, open the OSI model layers drop-down list.
A list of OSI model layer names is displayed:
- Data Link. This layer includes connections that used MAC addresses to communicate with devices.
- Network. This layer includes connections that used IP addresses to communicate with devices.
- In the drop-down list, select check boxes for OSI model layers that you want to use as a filtering condition for links displayed on the network interactions map.
- Click OK.
Only links that belong to the selected OSI model layer are displayed on the network interactions map.
Page top
Resetting filtering criteria
You can reset specified node and link filtering criteria to their default condition.
To reset specified filtering criteria on the network interactions map:
In the toolbar above the network interactions map, click Default filter (the button is displayed if non-default filtering criteria are specified).
The network interactions map displays all nodes and links for which interactions were detected during the specified period.
Page top
Saving and loading the display settings of the network interactions map
This section describes the network interactions map display customization features.
The application allows you to save the current display settings of the network interactions map. A set of display settings that can be saved is called a view. You can use views to apply settings saved in them to the network interactions map (for example, to quickly restore display settings after any changes or to manage the network interactions map on another computer).
When you save a view, the following display settings of the network interactions map are saved:
- Zoom level
- Positioning the network interactions map
- Position of pinned nodes and groups
- Filtering of nodes and links
You can save and use up to 10 views.
Only users with the Administrator role can manage the list of views (including saving the current display settings as a view). However, all users with the Administrator, Security auditor, Senior security officer, and Security officer roles can see the list of views and apply views to the network interactions map.
Adding a new view and saving the current display settings of the network interactions map
To add a new view and save the current display settings of the network interactions map
- Log in to the Kaspersky Anti Targeted Attack Platform web interface with the Administrator credentials.
- Select the Network map section in the application web interface window.
- Go to the Network interactions map tab.
- Open the Configure network map views window by clicking the Manage views button.
- Click Add.
- Enter a name for the view in the text box.
You can use letters, numbers, the space character, and the following special characters:
! @ # № $ % ^ & ( ) [ ] { } ' , . - _.The view name must satisfy the following requirements:
- Begins and ends with any character other than a space.
- Contains up to 100 characters.
- Does not reuse the name of another view (case-insensitive).
- Click the icon to the right of the text box.
Refreshing a view and saving the current display settings of the network interactions map
To update a view and save the current display settings of the network interactions map
- Log in to the Kaspersky Anti Targeted Attack Platform web interface with the Administrator credentials.
- Select the Network map section in the application web interface window.
Go to the Network interactions map tab.
- Open the Configure network map views window by clicking the Manage views button.
- Select the view in which you want to save the current display settings of the network interactions map.
- Click Overwrite.
This opens a confirmation prompt window.
- In the prompt window, confirm the saving of the current settings in the selected view.
Renaming a network interactions map view
To rename a view:
- Log in to the Kaspersky Anti Targeted Attack Platform web interface with the Administrator credentials.
- Select the Network map section in the application web interface window.
- Go to the Network interactions map tab.
- Open the Configure network map views window by clicking the Manage views button.
- Select the view you want to rename.
- Click the
 icon to the right of the current view name.
 - Enter the new name for the view in the text box.
You can use letters, numbers, the space character, and the following special characters:
! @ # № $ % ^ & ( ) [ ] { } ' , . - _.The view name must satisfy the following requirements:
- Begins and ends with any character other than a space.
- Contains up to 100 characters.
- Does not reuse the name of another view (case-insensitive).
- Click the icon to the right of the text box.
Deleting a network interactions map view
To delete a view:
- Log in to the Kaspersky Anti Targeted Attack Platform web interface with the Administrator credentials.
- Select the Network map section in the application web interface window.
- Go to the Network interactions map tab.
- Open the Configure network map views window by clicking the Manage views button.
- Select the view you want to delete.
- Click Delete.
This opens a confirmation prompt window.
- In the prompt window, confirm the deletion of the selected view.
Applying settings saved in the view to the network interactions map
To apply settings saved in a view to the network interactions map:
- Log in to the Kaspersky Anti Targeted Attack Platform web interface with the Administrator credentials.
- Select the Network map section in the application web interface window.
- Go to the Network interactions map tab.
- Open the Configure network map views window by clicking the Manage views button.
- In the list, select the view that you want to apply.
- Click Apply.
This opens a confirmation prompt window.
- In the prompt window, confirm to apply the selected view.
Monitoring network sessions
Kaspersky Anti Targeted Attack Platform can scan traffic to detect network sessions that devices create to connect to other devices. The application registers detected network sessions and saves information that can help you analyze network activity of devices and download data about transmitted network packets from traffic dump files. Unlike links on the network interactions map, registered network sessions allow you to obtain more fine-grained information about device interactions, due in part to independent registration of sessions for different ports and protocols that are used for the interactions.
The application detects network sessions if the Network Session Detection method is enabled for the Asset Management technology. Network Session Detection can be performed when analyzing traffic arriving at monitoring points, as well as when receiving information from the Endpoint Agent component.
Each registered network session contains information about the connection between two devices that are parties to the interaction. A network session is characterized by the address information of the parties to the interaction (MAC and/or IP addresses), port numbers, and the application protocol that is used for the connection. The first device in a network session is usually the device that initiated the sending of network packets to the other device.
You can view the full list of protocols detected by Kaspersky Anti Targeted Attack Platform by downloading the file from the link below.
![]() Protocols detected by Kaspersky Anti Targeted Attack Platform
Protocols detected by Kaspersky Anti Targeted Attack Platform
A network session is considered closed if no network packets have been sent for one minute or if the Network Session Detection technology becomes disabled on the relevant node or monitoring point.
When an exceedingly large number of network sessions is detected, the application applies the following session registration restrictions:
- The number of registered sessions between two interacting parties using the same application protocol may not exceed 1000 per minute.
- The total number of registered sessions between the two parties may not exceed 5000 per minute.
The application stores information about network sessions in a database on the Central Node server. The total amount of stored records cannot exceed the configured limit. If the amount exceeds the limit, the application automatically deletes 10% of the oldest records.
In distributed solution and multitenancy mode, information about network sessions of SCN servers is not displayed on the PCN.
Network sessions table
To view the list of network sessions:
- Select the Network map section in the application web interface window.
- Go to the Network sessions tab.
The network sessions table is displayed.
The table contains the following information:
- Status is the status of the network session. A registered network session can have one of the following statuses:
- Active. This status is assigned when a network session is registered and is retained as long as the devices keep sending network packets within this session.
- Closed. This status is assigned to a network session if no network packets have been sent for one minute or if the Network Session Detection technology becomes disabled on the relevant node or monitoring point.
- Side 1 is the MAC and/or IP addresses of one of the sides of the network interaction. The display of MAC and IP addresses can be turned on and off.
- Side 1 port is the port number of the first side of the interaction.
- Side 2 is the MAC and/or IP addresses of the other side of the network interaction. The display of MAC and IP addresses can be turned on and off.
- Side 2 port is the port number of the second side of the interaction.
- Device 1 is the name of the device known to the application, which corresponds to the address information of the first side of the interaction.
- Device 2 is the name of the device known to the application, which corresponds to the address information of the second side of the interaction.
- Transfer protocol is the name of the transport protocol used in the network session.
- Application protocol is the name of the application layer protocol used in the network session.
- Current speed is the current data transfer rate for the network session.
- Average speed is the average data transfer rate for the network session.
- Total transmitted is the number of bytes transmitted during the network session.
- Monitoring points lists the names of monitoring points that have received traffic for the network session.
- Start is the date and time of the first network packet in the network session or the date and time of the beginning of the time period defined by data from an EPP application.
- Last interaction is the date and time of the last network packet in the network session or the date and time of the end of the time period defined by data from an EPP application (if only one packet was received in the network session, this value is the same as the Start).
- Number of packets is the number of network packets transmitted during the network session.
When viewing the table of network sessions, you can configure, filter, and sort the network sessions, as well as navigate to related items and export data.
Page top
Viewing network session details
Detailed information about a network session includes information from the Network sessions table, as well as the name of the application that was active when the network session was initiated (if Kaspersky Anti Targeted Attack Platform was able to determine the name of the application).
To view the details of a network session:
- Select the Network map section in the application web interface window.
- Go to the Network sessions tab.
- Click the line with the relevant session.
This opens a window with information about the network session.
Page top
Downloading network session traffic
When viewing the table of network sessions, you can download traffic related to the selected network sessions. Traffic is downloaded as a PCAP file. To download only the data you need, you can configure network packet filtering.
The application downloads traffic of network sessions from traffic dump file storages. Traffic can be downloaded from the internal storage that was automatically created as part of the Sensor installation process, as well as an external storage if one is connected.
When downloading network session traffic, consider the following:
- Traffic can be downloaded only for those network sessions that were registered when analyzing traffic that arrived at the monitoring points. If a network session was registered based on information received from the Endpoint Agent component, you cannot download the traffic of such a session.
- Traffic dump files are stored in storages temporarily and are automatically deleted as new traffic arrives (the rotation period depends on the amount of traffic and the application storage configuration). You cannot downloading traffic for a network session if the corresponding traffic dump files have already been deleted from storages.
To download network session traffic:
- Select the Network map section in the application web interface window.
- Go to the Network sessions tab.
- Select check boxes next to network sessions whose traffic you want to download.
You can select a maximum of 100 network sessions.
- Click Download traffic.
The details area is displayed in the right part of the web interface window.
- Do the following:
- If you want to download traffic for a certain period of time, set the bounds using the Period of traffic to download setting.
By default, the maximum possible period is chosen, starting from the date and time when the earliest network session was established and ending with the date and time when the latest session in the selection ended. If necessary, you can move the bounds within this period or set an empty value for one of the bounds (for example, for the right bound to download new traffic of sessions that have not ended yet).
- Under Download volume limit, set the maximum amount of traffic to download.
If the amount of downloaded traffic exceeds the specified limit, the newest traffic is dropped.
- If necessary, enable filtering under Filtering by monitoring points and specify the monitoring points that got the traffic that you need.
By default, the monitoring points that got the traffic of selected network sessions are specified.
- If necessary, enable filtering in the Filtering by address spaces section and specify the address spaces to which the addresses in the network packets of the selected network sessions belong (this section is displayed if additional address spaces are added to the application).
By default, all address spaces created in the application are specified.
- If necessary, enable filtering under Filtering using BPF and enter an expression for filtering using the BPF (Berkley Packet Filter) technology by address parameters in network packets of the selected network sessions.
Example of a filter expression:
tcp port 102 or tcp port 502 - If necessary, enable filtering under Filtering using regular expressions and enter a regular expression for filtering by the payload data of network packets of the selected network sessions.
Example of a filtering expression:
^test.+xABxCD
- If you want to download traffic for a certain period of time, set the bounds using the Period of traffic to download setting.
- Click Download.
- If file generation takes a long time (more than 15 seconds), the file generation operation becomes a background operation. In that case, follow these steps to download the file:
- Click the button in the application web interface menu.
This opens the list of background operations.
- Wait for the file generation operation to complete.
- Click the Download file button.
- Click the
Your browser saves the downloaded file. Depending on your browser's settings, a window may be displayed on your screen in which you can specify the path and name of the downloaded file.
Page top
Searching network packets
You can find and view the traffic related to the selected network packets. If necessary, you can download dumps of the found traffic.
To find traffic related to the selected network packets:
- Select the Network map section in the application web interface window.
- Go to the Network sessions tab.
- Click Search in packets.
This opens the window with network packet search settings.
- Do the following:
- In the Period of traffic to download field, set the bounds within which you want to search network packets.
- If necessary, enable filtering under Filtering using BPF and enter an expression for filtering using the BPF (Berkley Packet Filter) technology by address parameters in network packets of the selected network sessions. The BPF filtering expression is written in the libpcap format. For more details about the syntax, please refer to the pcap-filter manual page.
Example of a filter expression:
tcp port 102 or tcp port 502 - If necessary, enable filtering in the Filtering using regular expressions section and enter an expression for filtering based on payload data in network packets.
Example of a filtering expression:
^test.+xABxCD - If necessary, enable filtering under Filtering by monitoring points and specify the monitoring points from which you want to get traffic.
- If necessary, enable filtering under Filtering by address spaces and specify the address spaces to which the addresses in network packets belong.
- Click Search.
The table displays data that match the filtering criteria.
- If you want to download the dumps of the found network packets, click Download.
Raw network traffic dumps are downloaded in PCAP format.
Page top
Preconfigured network packet search rules
You can search in traffic using preconfigured rules that use BPF and regular expressions.
To search network packets using a preconfigured rule:
- Select the Network map section in the application web interface window.
- Go to the Network sessions tab.
- Click Search in packets.
This opens the window with network packet search settings.
- In the Period of traffic to download field, set the bounds within which you want to search network packets.
- In the table below, copy a filtering expression from the Filtering using BPF or Filtering using regular expressions column and paste it into the corresponding section of the web interface for searching in network packets.
- Click Search.
The table displays data that match the filtering criteria.
The preconfigured rules are listed in the table below.
Preconfigured network packet search rules
Purpose of the rule |
Filtering using BPF |
Filtering using regular expressions |
Explanation |
Example |
|---|---|---|---|---|
Searching traffic by IP address |
|
|
|
|
Searching traffic between two hosts |
|
|
|
|
Searching for traffic of an individual TCP session |
|
|
|
|
Searching for traffic by multiple IP addresses |
|
|
|
|
Finding all DNS queries from a group of hosts |
|
|
|
|
Searching for HTTP traffic |
|
|
The filter must be used without quotes |
|
Searching for DNS traffic |
|
|
Standard DNS only |
|
Searching for HTTP traffic with a GET request to a certain domain |
|
|
|
|
Searching for ICMP traffic of a specific host |
|
|
|
|
Searching for authentication data transmitted as plain text |
|
|
The filter must be used without quotes |
|
Searching for TCP sessions in which the host acts as a client |
|
|
|
|
Searching for HTTP traffic in a given subnet |
|
|
|
|
Searching for local interaction traffic |
|
|
|
|
Searching for traffic of interaction with objects on the internet |
|
|
|
|
Searching for traffic by the UserAgent field in HTTP traffic |
|
|
|
|
Monitoring risks
Kaspersky Anti Targeted Attack Platform can detect risks to which the information system resources are exposed. The application identifies the risks based on traffic analysis results and the received device information.
Detected risks can belong to the following categories:
- Vulnerability. Detected device vulnerabilities belong to this category.
- Configuration problems. This category includes security risks caused by incorrect configuration and risks of compromising data when writing and reading device configurations.
- Insecure network architecture. This category includes risks associated with detected insecure network interactions, devices, protocols, and software; risks due to authorized devices becoming inactive; and risks due to the EPP applications being absent from devices or not fully functional.
Each risk is scored from 0.0 to 10.0. When calculating the risk score, the application takes into account the available information about the device with which the detected risk is associated. When calculating the score, the application takes into account the importance level of the device, as well as other risks associated with that device. The base score is used as the initial value for the calculation. The base scores of risks in the Vulnerability category follow the Common Vulnerability Scoring System (CVSS). For the rest of the risk categories, the base scores are taken from the table of risk types.
Risk information is uploaded to the database of detected risks on the Central Node. The total amount of stored records in the database cannot exceed the specified limit. If the amount exceeds the limit, the application automatically deletes 10% of the oldest records. You can set the maximum size of detected risk information when configuring the storage settings.
The contents of the detected risk database is displayed in the Risks section of the application web interface. You can also view an overview of device risks in the Assets section on the Devices tab.
About risks of the Vulnerability category
Vulnerability risks are registered when the application detects vulnerabilities in monitored devices on the corporate LAN. A vulnerability is a flaw in the software or hardware of a device, which an attacker can exploit to compromise the information system or gain unauthorized access to information.
The application detects vulnerabilities by analyzing the available device information. Information that can help identify a known vulnerability for a device is compared against certain fields in the database of known vulnerabilities. The database of known vulnerabilities is built into the application. This database, maintained by Kaspersky experts, contains information about the most relevant or the most frequently encountered device vulnerabilities.
The database of known vulnerabilities contains descriptions of vulnerabilities and of devices that are affected by these vulnerabilities. In addition, the database contains recommendations for protecting the system in the form of texts or links to public resources. The database of known vulnerabilities contains descriptions and recommendations from various sources, which may include vendors of devices and software, as well as various security organizations. The descriptions and recommendations in the database are in English.
After the application is installed, the original database of known vulnerabilities is used. You can keep your database up to date by installing updates.
Kaspersky Anti Targeted Attack Platform compares the available information about devices with fields in the database of known vulnerabilities that describe the devices that are affected by the vulnerabilities. The application uses the following device information to detect vulnerabilities:
- Hardware vendor.
- Hardware model.
- Hardware version.
- Software vendor. If no software vendor information can be found in the device information, Kaspersky Anti Targeted Attack Platform reuses the Hardware vendor value.
- Software name. If the software name cannot be found in the device information, Kaspersky Anti Targeted Attack Platform reuses the Hardware model value.
- Software version.
In the database of known vulnerabilities, device descriptions are stored in the CPE (Common Platform Enumeration) format. The application compares the available device information with these descriptions, automatically converting the information to the CPE format. For each vulnerability, the content of the matching descriptions is listed in the risk details area in the Matched CPE section.
The main parameter that identifies a vulnerability is its ID in the Common Vulnerabilities and Exposures (CVE) list. This identification number is called the CVE ID. If a vulnerability does not yet have a CVE ID, an ID obtained from other public resources with descriptions of vulnerabilities is specified.
The Kaspersky Anti Targeted Attack Platform supports getting IDs and links to descriptions of vulnerabilities provided by the Federal Service for Technical and Export Control (FSTEC) of Russia in the Information Security Threats Databank (hereinafter also referred to as the "BDU"). If the downloaded vulnerability information contains such information from FSTEC's BDU, the application displays this information in the form of corresponding IDs in the "BDU:<year>-<number>" format.
Page top
Implementation scenario for a continuous risk management process
The risk detection functionality allows implementing continuous (cyclical) risk management in your information system. To help you manage risks, Kaspersky Anti Targeted Attack Platform provides information about detected risks, which you can use to take the necessary remediation or mitigation measures.
The implementation scenario for the continuous risk management process involves the following steps:
- Taking a device inventory
This step is performed using the Device Activity Detection and Device Information Detection methods (the methods must be enabled). At this step, the application automatically detects new devices and updates the device information. If some devices on the network were not detected automatically, you need to add them manually or import them from external projects.
You must enable automatic update in the device settings for all information that determines the classification and operational characteristics of devices (for example, model and software version). If automatic update of such information is for some reason impossible, this information must be kept up to date manually.
- Risk detection while scanning passively or actively
The application passively scans devices for risks using the available information about the devices. The application also analyzes network interactions in corporate LAN traffic to detect risks. Risk detection is implemented by the Risk Detection method (the method must be enabled).
You can also actively poll devices to quickly get their information. When performing active polling of devices, you also can detect specific types of risks if the corresponding risk analysis methods are selected. To actively poll devices, you need to add one or more Active poll connectors to the application.
Risks of the Vulnerability category are automatically detected after updating the database of known vulnerabilities in the application or after adding or updating the device information that is used for matching (for example, after saving software model and version information).
- Scoring and classifying detected risks
For each detected risk, the application calculates a score. The score reflects the severity of the risk. Depending on the score, the severity of the risk can be Low (score 0.0–3.9), Medium (score 4.0–7.9), or High (score 8.0–10.0).
Based on the severity levels and scores, and factoring in the special ways in which devices are used in your information system, you can classify detected risks in accordance with their importance. If you assess the risk as insignificant, you can manually change its status from the Active status (assigned by default after detection) to the Accepted status, for example, if the prerequisites for exploiting the vulnerability cannot be reproduced. When changing the status of a risk, we recommend adding or editing a comment.
All risks that need something to be done about them should be left with the Active status.
- Remediation
At this step, you must undertake remediation or mitigation of the detected risks. To do this, check all Active detected risks, starting with the risks with the highest scores. Do what is necessary in your information system (for example, to remedy the vulnerability of a device, install the software update that fixes it, and if this is not possible, isolate this device from external networks). For some risks (for example, vulnerabilities), information on recommended actions is provided.
Kaspersky Anti Targeted Attack Platform is not involved in the remediation of detected risks.
- Verifying remediation
This step is similar to risk detection while scanning. As a result of this step, no Active risks should remain in the risk table.
For most risks that the application detects during passive scanning (for example, vulnerabilities), the application automatically assigns the Remediated status if the conditions for detecting these risks are no longer satisfied. For example, after the software version is changed for a device, the application assigns the Remediated status to the Vulnerability risk that was registered because of a vulnerable software version that had been specified previously. The Remediated status is also assigned to risks that no longer have a description in the database of known vulnerabilities (if the description is removed from the database after downloading updates).
When devices are removed, the application also removes the risks associated with these devices.
If, after remediation, the conditions for detecting the risk have not changed (for example, the vulnerable device is isolated from external networks, but the information about this device has not changed), you can manually assign the Accepted status to this risk. When changing the status of a risk, we recommend adding or editing a comment.
Some risks cannot be automatically assigned a status of Remediated (for example, Remediated cannot be automatically assigned to risks that are detected during active polling of devices). For such risks, you must also manually assign the Accepted status after the risk remediation is complete.
If a risk is associated with an event, you can assign the Accepted status to this risk at the same time when you change the event status to Resolved.
Viewing the risk table
The risk table is displayed in the Risks and anomalies section of the application web interface window.
Risk settings are displayed in the following columns of the table:
- Category.
The name of the risk category.
- Name.
Risk name. For a risk of the Vulnerability category, the CVE ID of the detected vulnerability is used (if there is no CVE ID, an ID obtained from other public resources with vulnerability descriptions is displayed).
- CVE.
For risks of the Vulnerability category: CVE ID of the detected vulnerability.
- BDU.
For risks of the Vulnerability category: ID of the vulnerability in the BDU database. If multiple vulnerabilities with different BDU IDs correspond to one vulnerability with a CVE ID, the column lists all such IDs.
- Risk ID.
Unique ID of the risk.
- Score.
The calculated risk score. This numerical value determines the severity level of the risk. Depending on the severity level, the score can be displayed in one of the following colors:
- Red for a High severity risk.
- Yellow for a Medium severity risk.
- Blue for a Low severity risk.
For Active risks, the color of the score is bright. For Remediated or Accepted risks, the color of the score is faint.
In the details area, this setting is called Base score.
- Side 1.
Address information of one of the sides of the network interaction (indicated for some types of risks). The display of MAC and IP addresses can be turned on and off separately. If extra address spaces are added in the application, when configuring the risk table, you can enable or disable the display of address space names using the Show address spaces setting.
- Side 2.
Address information of the other side of the network interaction (indicated for some types of risks). The display of address information can be configured the same way as the Side 1 column.
- Device group.
Name of the group in which the device with the detected risk is placed (contains the name of the group itself and the names of all its parent groups).
- Device.
Name and address of the device.
- Source.
For risks of the Vulnerability category: the name of the source from which the information was uploaded into the database of known vulnerabilities. In the details area, this setting is called Source of vulnerability.
- Status.
Current risk status. The following statuses are possible:
- The Active status is assigned by default when the risk is first detected (as well as upon repeated detection if the risk had been assigned the Remediated status). You can also manually assign the Active status to a risk if its current status is Accepted.
- The Remediated status is automatically assigned if the conditions for detecting the risk are no longer satisfied.
- The Accepted status is assigned to a risk manually if the risk is assessed as insignificant or if the undertaken remediation actions did not result in the automatic assignment of the Remediated status.
- Detected at.
Date and time when the risk was detected.
- Last status change.
Date and time of the last risk status change.
- Matched CPE.
For risks of the Vulnerability category: device descriptions stored in the database of known vulnerabilities. Descriptions that match the device information from the table of devices are listed here.
When viewing the risk table, you can configure, filter, search, and sort the files, as well as navigate to related items.
Page top
Viewing risk information
Risk information includes information from the risk table and the following fields:
- Risk type is the code of the risk type.
- Description is the description specified for the risk type or for the vulnerability.
- Base score is the initial value for calculating the risk score.
For risks of the Vulnerability category, additional information is displayed in the following fields and field groups:
- CVSS vector is a record of metrics for calculating the CVSS vulnerability score.
- Attack conditions is a description of the conditions that must be satisfied for the vulnerability to be exploited.
- Impact is a description of the possible consequences of exploiting the vulnerability.
- Mitigations lists recommendations for the remediation of the vulnerability (for example, information about which software version is recommended to be installed on the device).
- Links lists links to public resources that can provide additional information about the vulnerability.
- CVE history lists dates when the vulnerability was identified, confirmed, and published in public sources.
To view risk information:
- Select the Assets section in the application web interface window.
- Go to the Devices tab.
- Click the name of the vulnerability (as a CVE ID or other vulnerability ID) in the Risks column.
This opens a window containing information about the vulnerability.
Page top
Manually changing risk status
When managing the Risks and anomalies section, you can manually change the statuses of any risks from Active to Accepted and vice versa. When managing the Assets section, you can only change the status of Vulnerability category risks, and only from Active to Accepted.
You can also assign the Accepted status to a risk when assigning the Resolved status to events that are associated with this risk.
To manually change the risk status:
- Open the risk details area or the risk details window.
- Open the Change status drop-down list.
- Depending on the status you want to assign to the risk, select one of the following from the drop-down list:
- Accepted if you want to change the status of the risk from Active to Accepted.
- Active if you want to reassign the Active status to the risk.
This opens a confirmation prompt window.
- If the selected risk has related events and you want to assign the Resolved status to all these events at the same time, select the Assign the Resolved status to all related events check box.
Risks may become associated with events when registering certain types of events using the Asset Management technology.
- In the prompt window, click OK.
Viewing risk information while managing the table of devices
When managing the table of devices, you can view information for risks that have been detected on devices. For each device that has risks of the Vulnerability category, the names of the detected vulnerabilities are displayed (as CVE IDs or other vulnerability IDs). If risks of other categories are detected on the device, names of those risk categories are displayed for that device. Vulnerability names and risk categories are displayed in the Risks column and in the details area when a device is selected.
By default, the table of devices displays information only about Active risks. If necessary, you can enable the display of information for all risks by selecting the Show remediated and accepted risks check box when configuring the device table.
To indicate the severity levels of risks, the names of vulnerabilities and categories are colored as follows:
- Red for High severity risks.
- Yellow for Medium severity risks.
- Blue for Low severity risks.
For Active risks, the color of the names is bright. For Remediated or Accepted risks, the color of the names is faint.
If a device has risks of the same category, the name of this category is displayed in the highest-severity color of all these risks.
If you want to view risk details, you can click the vulnerability and category names. Clicking a vulnerability name (as a CVE ID or other vulnerability ID) opens the vulnerability details window. Clicking a risk category name takes you to the risk table filtered to display the risks of the selected category for the device.
When viewing th table of devices, you can filter devices by their risks. You can also search for devices by vulnerability names (as CVE IDs or other vulnerability IDs).
Page top
Configuring NDR event types
Event types determine the parameters used when registering events: titles, descriptions, base scores, and registration settings. In Kaspersky Anti Targeted Attack Platform, you can view the settings of event types, edit some settings of event types, and configure automatic saving of traffic and forwarding of registered events through connectors.
Viewing the table of event types
The event types provided in the application are displayed in the Settings section, Event types subsection of the application web interface.
The table of event types contains system event types. These event types are created by the application during installation and cannot be removed from the list. Event registration technologies implemented in the application use different sets of system event types.
On the basis of some system event types, you can configure user-defined event settings to be used when registering events in certain cases. User-defined settings can be defined for the event type of the External systems technology, code 4000005400, to be used for registering events using the Kaspersky Anti Targeted Attack Platform API NDR.
User-defined settings take precedence when registering events. In absence of user-defined settings, settings configured in the system event types are used.
The following settings are provided for event types:
- Code – unique number (identifier) of the event type. In the table of event types, the number is displayed together with the event title in the Code and title column. In the table of registered events, the event type ID is displayed in the Event type column.
- Title – contents of the event title presented as text and/or variables. System event types can use variables specific only to these types of events, or general variables, which can also be used in user-defined settings. In the table of event types, the content of the title is displayed together with the event type number in the Code and title column. In the table of registered events, the text of the title and/or received values of variables are displayed in the Title column.
- Base score – initial value for calculating the score of the registered event. If an event type can have different base scores, the maximum value is displayed. This setting is displayed in the table of event types.
- Technology – technology used for event registration. This setting is displayed in the table of event types.
- Description – additional text that describes the event type. Similarly to the title, can contain variables. This setting is not displayed in the table of event types. You can view the description in the details area of the selected event type. In the table of registered events, the text of the description and/or the resulting values of variables are displayed in the Description column.
- <Recipient connector name> – name of the connector that the application uses to send events to the third-party system. The application sends to third-party systems only events of types that are configured for sending through the connector. Each connector, through which forwarding of events to third-party systems is configured, is displayed in a separate column of the table of risk types. This setting is not displayed in the details area of the selected event type.
- Event regeneration period – maximum time after which an event can be registered again. If the conditions for event enrollment are repeated before the specified time period elapses, a new event is not registered but the counter for the number of repeats of the previously registered event is increased and the date and time of the last occurrence of the event is updated. After the end of this period, when the conditions for registering an event recur, the application register a new event of this type. The regeneration period starts counting from the moment of the last registration of an event of this type. For example, if the regeneration period is set to 8 hours, and conditions for registering this event recur two hours after the previous event, a new event is not registered. A new event is registered if the conditions are detected after 8 hours or later. This setting is not displayed in the table of event types. You can view and configure this setting in the details area of the selected event type.
For registered events, the regeneration period may expire earlier than configured. Repeated registration of an event is allowed earlier than the configured time if the Resolved status is assigned to the event, or if the Central Node computer performing is restarted.
- Save traffic – this setting enables or disables automatic saving of traffic when an event is registered. This setting is not displayed in the table of event types. You can view and configure this setting in the details area of the selected event type.
If automatic saving of traffic is disabled, you can manually download traffic for some time after an event of this type is registered. When the application gets a request to download traffic, it searches for network packets in its temporarily generated traffic dump files. If the necessary network packets are found in the traffic dump files, these packets are downloaded (after being saved in the database first).
When viewing the table of event types, you can use the configuration, filtering, searching, and sorting functionality.
Page top
Editing the settings of a system event type
To edit the settings of a system event type:
- In the window of the application web interface, select the Settings section, Event types subsection.
- In the table of event types, select the type of event that you want to edit.
The details area is displayed in the right part of the web interface window.
- Click Edit.
- Edit the editable settings: the regeneration period and traffic saving settings.
- Click Save.
Configuring automatic saving of traffic for system event types
When editing event types, you can enable or disable automatic saving of traffic for events when they are registered. If traffic saving is enabled, the database stores the network packet that caused the registration of the event, as well as the packets before and after the registration of the event that were detected within the network session in which the event was registered. Traffic saving settings determine how many network packets are saved and time limits.
If automatic traffic saving is disabled for an event type, and user-defined settings enabling traffic saving have been configured for this event type, you can download traffic only within a certain time frame after the registration of an event of this type. In this case, the application uses traffic dump files for downloading traffic. These files are stored temporarily and automatically deleted as new traffic arrives. When traffic is downloaded from these files, as many network packets are saved in the database as configured by default when you enable traffic saving for event types.
The application saves traffic in the database only when an event is registered. If the conditions for registering this event recur during the regeneration period, the traffic for that moment is not saved in the database.
You can enable and configure traffic saving for any event types.
If traffic saving is enabled for aggregate events (that is, for system event type 8000000001), the application saves traffic for all nested events when registering an aggregate event. The settings specified for the aggregate event are applied when saving the traffic of nested events. However, traffic saving settings specified directly for the types of events nested in the aggregate event override the settings specified for the aggregate event. That is, traffic for nested events is saved in accordance with the settings specified for the types of these events, and if such settings are not specified, the settings of the aggregating event are used.
To enable and configure traffic saving for an event type:
- In the window of the application web interface, select the Settings section, Event types subsection.
- In the table of event types, select the type of event that you want to edit.
The details area appears in the right part of the web interface window.
- Click Edit.
- Set the Save traffic toggle switch to Enabled.
- Configure the saving of traffic from before the event was registered. To do so, specify relevant values in Total packets before event and/or Time to event, ms. Zero means the setting is not applied. If values are specified in both of these fields, the application saves the minimum number of packets that match one of the specified values.
- Configure the saving of traffic from after the event was registered. To do so, specify the relevant values in Total packets after event and/or Time after event, ms. Zero means the setting is not applied. If values are specified in both of these fields, the application saves the minimum number of packets that match one of the specified values.
For some technologies (in particular, Deep Packet Inspection), fewer packets from after registration may be saved in events than configured in traffic saving settings. This is due to the peculiarities of the traffic monitoring technology.
- Click Save.
Configuring the forwarding of events through connectors
When configuring system event types, you can specify the connectors through which you want Kaspersky Anti Targeted Attack Platform to forward registered events to third-party systems. Kaspersky Anti Targeted Attack Platform can send event information through multiple connectors simultaneously.
To configure the forwarding of events through connectors to third-party systems:
- In the window of the application web interface, select the Settings section, Event types subsection.
- Make sure that the table of event types displays the columns with the connectors that you need.
If the column of the relevant connector is missing, check the column display settings. If the connector has not been added to the list of connectors, add it.
- In the table of event types, select the types of events for which you want to enable or disable forwarding through connectors.
If you select an individual event type, the details area is displayed in the right part of the web interface window.
- Do one of the following:
- If you select one event type, click Select connectors in the details area.
- If you select multiple event types, click Select connectors in the upper part of the window.
This opens the Event recipient connectors window.
- Select the check boxes next to the connectors through which you want to forward events to third-party systems.
- Click OK.
Common substitution variables in Kaspersky Anti Targeted Attack Platform
You can use common variables to substitute current values in Kaspersky Anti Targeted Attack Platform. You can use common variables in the following settings:
- Headers and descriptions of events in user-defined settings for event registration
- Settings of event forwarding, application messages, or audit records using the email connector
To insert a common variable into an input field:
Start typing the name of the variable with the leading $ character and select the common variable from the displayed list.
Common variables can be used for interpolation in different settings, depending on the purpose of the variable (see the table below).
Common variables for value substitution
Variable |
Description |
Usage |
|
Network interaction description strings (one string per network interaction), specifying the protocol and sender and recipient addresses of the network packet |
|
|
Network packet recipient address (depending on the information provided by the protocol, this can be an IP address, port number, MAC address and/or other address information) |
|
|
Extra variable added using the |
|
|
Name of the monitoring point whose traffic caused the event to be registered |
|
|
Date and time of registration |
|
|
Name of the application layer protocol for which the event was logged |
|
|
Network packet sender address (depending on the information provided by the protocol, this can be an IP address, port number, MAC address and/or other address information) |
|
|
Name of the rule in the event. |
|
|
Name of the top-level protocol. |
|
|
Code of the event type, application message, or audit entry. |
|
|
Date and time when a status of Resolved was assigned or the date and time of the event regeneration period (for events that are not aggregate events), or the date and time of registration of the last event included in the incident (for aggregate events). |
|
|
How many times a nested or aggregate event was triggered |
|
|
Description |
|
|
Unique ID of the registered event, application message, or audit entry. |
|
|
Category of transmitted data (event, application message, or audit record). |
|
|
Number of transmitted events, application messages or audit records. |
|
|
Template that consists of a block containing a list of data. |
|
|
Email notification string template |
|
|
Node with the installed application component that sent the data. |
|
|
Operation result in the audit entry. |
|
|
Event score value. |
|
|
Event severity level. |
|
|
Application message status |
|
|
Application process that caused the message to be registered |
|
|
Technology associated with the event. |
|
|
Event title, message text, or registered action. |
|
|
Name of the user that performed the registered action. |
|
NDR event registration technologies
Kaspersky Anti Targeted Attack Platform registers NDR events using one of the following technologies:
- Intrusion Detection (IDS)
This technology registers NDR events related to the detection of anomalies in traffic that are indicators of attacks (for example, an NDR event can be registered indicators of ARP spoofing are detected).
- External (EXT)
This technology registers aggregate and nested NDR events that are received by the Kaspersky Anti Targeted Attack Platform from third-party systems using the methods of the Kaspersky Anti Targeted Attack Platform API.
- Asset Management (AM)
This technology registers NDR events involving the detection of information about devices in traffic or in data received from EPP applications (for example, an NDR event can be registered when a device is found to have a new IP address).
- Endpoint Protection Platform (EPP)
This technology registers NDR events for threats detected by Kaspersky applications that protect workstations and servers (for example, a malware detection event).
System event types in Kaspersky Anti Targeted Attack Platform
To register events, Kaspersky Anti Targeted Attack Platform uses system event types that are automatically created during application installation.
Each event type belongs to a certain event registration technology.
System event types of the Intrusion Detection technology
This article describes the system event types of the Intrusion Detection technology (see the table below).
Intrusion Detection (IDS) system event types
Code |
Event type title |
Conditions for registration |
|---|---|---|
4000003000 |
Rule from the $fileName set (system rule set) was triggered |
An intrusion detection rule from the system rule set is triggered. The following variables are used in the title and description of the event type:
|
4000003001 |
Rule from the $fileName set (user-defined rule set) was triggered |
An intrusion detection rule from the user-defined rule set is triggered. The following variables are used in the title and description of the event type:
|
4000003002 |
Signs of a brute-force attack or scan were detected |
A rule for detecting brute-force or scanning attack is triggered. In the description of the event type, the $ruleName variable is used for the rule name. |
4000004001 |
Symptoms of ARP spoofing detected in ARP replies |
Indicators of address spoofing in ARP packets detected: multiple ARP responses that are not associated with ARP requests. The following variables are used in the description of the event type:
|
4000004002 |
Symptoms of ARP spoofing detected in ARP requests |
Indicators of address spoofing in ARP packets detected: multiple ARP requests from the same MAC address to different destinations. The following variables are used in the description of the event type:
|
4000005100 |
IP protocol anomaly detected: data conflict when assembling IP packet |
IP protocol anomaly detected: data mismatch in overlapping IP packet fragments. |
4000005101 |
IP protocol anomaly detected: fragmented IP packet size exceeded |
IP protocol anomaly detected: actual total size of fragmented IP packet after reassembly exceeds the allowed limit. |
4000005102 |
IP protocol anomaly detected: the size of the initial fragment of the IP packet is less than expected |
IP protocol anomaly detected: the size of the initial fragment of the IP packet is less than the minimum allowed value. |
4000005103 |
IP protocol anomaly detected: mis-associated fragments |
IP protocol anomaly detected: fragments of the IP packet being assembled contain different information about the length of the fragmented packet. |
4000002701 |
TCP protocol anomaly detected: content substitution in overlapping TCP segments |
TCP protocol anomaly detected: packets contain overlapping TCP segments with different content. |
4000000003 |
Test event (IDS) |
Test network packet detected (with rule-based intrusion detection enabled). |
System event types of the Asset Management technology
This article describes the system event types of the Asset Management technology (see the table below).
System event types of the Asset Management (AM) technology
Code |
Event type title |
Conditions for registration |
|---|---|---|
4000005003 |
Detected new device with the address $owner_ip_or_mac |
With Asset Monitoring in monitoring mode, a new device was automatically added by the detected IP or MAC address, which is not specified for other devices in the table. When registering the event, the application may simultaneously register an Unauthorized device risk for this device. In this case, a relation is established the risk and the event. The following variables are used in the title and description of the event type:
|
4000005004 |
Received new information about device with the address $owner_ip_or_mac |
With Asset Monitoring in monitoring mode, device information was automatically updated based on information received from traffic. The following variables are used in the title and description of the event type:
|
4000005005 |
IP address conflict detected $owner_ip |
With Asset Monitoring in monitoring mode, an IP address was detected that was not being used by the device for which the IP address was specified. The following variables are used in the title and description of the event type:
|
4000005006 |
Detected traffic from address $owner_ip_or_mac, which is assigned to device with the Archived status |
With Asset Management in monitoring mode, or based on data received from an EPP application, activity was detected from a device that has the Archived status. When registering the event, the application may simultaneously register an Unauthorized device risk for this device. In this case, a relation is established the risk and the event. The following variables are used in the title and description of the event type:
|
4000005007 |
Detected new IP address $new_ip_addr for device with the MAC address $owner_mac |
With Asset Monitoring in monitoring mode, a new IP address used by a device was detected. The following variables are used in the title and description of the event type:
|
4000005008 |
New MAC address ($owner_mac) was added to device with IP address $owner_ip |
In Asset Management monitoring mode, a MAC address was automatically added for a network interface that had only an IP address specified (the device had the Unauthorized or Archived status). The following variables are used in the title and description of the event type:
|
4000005009 |
New IP address ($owner_ip) was added to device with the MAC address $owner_mac |
In Asset Management monitoring mode, an IP address was automatically added for a network interface that had only a MAC address specified (the device had the Unauthorized or Archived status). The following variables are used in the title and description of the event type:
|
4000005010 |
Detected new MAC address $new_mac_addr for device with the IP address $owner_ip |
With Asset Monitoring in monitoring mode, a new MAC address used by a device was detected (with automatic update of address information disabled for this device). The following variables are used in the title and description of the event type:
|
4000005011 |
Detected change of MAC address $owner_mac to $challenger_mac in device data received from EPP application |
Based on information received from an EPP application, the MAC address of the device has been updated. The following variables are used in the title and description of the event type:
|
4000005012 |
New address information for device $asset_name found in data received from EPP application |
New address information of a device was found in data received from an EPP application. An event of this type is registered if the change of the address information of the device has not been processed by the application as event 4000005009 or 4000005010. The following variables are used in the title and description of the event type:
|
4000005013 |
Conflict detected in addresses of devices $conflicted_epp_assets after data was received from EPP application |
Based on the information received from the EPP application, a conflict with the addresses of multiple devices in Kaspersky Anti Targeted Attack Platform was detected. According to the information from the EPP application, the addresses belong to the same device. The following variables are used in the title and description of the event type:
|
4000005014 |
Subnet $subnet_mask was added from EPP application data |
After getting information from an EPP application, a new subnet was automatically added to the list of known subnets. The subnet is added to the address space in which the data source can be the integration server getting information from the EPP application. If multiple such address spaces exist, an address space is selected that contains the most suitable subnet for automatically adding a new nested subnet. The following variables are used in the title and description of the event type:
|
4000005016 |
Unauthorized DHCP server detected with IP address $owner_ip |
The $asset_name device (ID: $asset_id) with the address $owner_ip_or_mac was identified as an unauthorized DHCP server. The following variables are used in the title and description of the event type:
|
4000005017 |
Unauthorized DHCP relay detected with IP address $owner_ip |
The $asset_name device (ID: $asset_id) with the address $owner_ip_or_mac was identified as an unauthorized DHCP relay. The following variables are used in the title and description of the event type:
|
4000005600 |
Changes detected in the list of users on the device with the address $owner_ip_or_mac |
Changes to user information were detected while controlling users on devices. The following variables are used in the title and description of the event type:
|
4000005601 |
Changes detected in the list of applications on the device with the address $owner_ip_or_mac |
Modified information about applications on the device detected while monitoring applications and patches on devices. The following variables are used in the title and description of the event type:
|
4000005602 |
Changes detected in the list of patches on the device with the address $owner_ip_or_mac |
Modified device patch information detected while monitoring applications and patches on devices. The following variables are used in the title and description of the event type:
|
4000005603 |
Changes detected in the configuration component $inventory_loc_key on the device |
While monitoring device configurations, changes in the configuration component were detected as compared to the previous configuration according to device scan results (for jobs that run in the Update only and/or Archive versions configuration processing modes). The following variables are used in the title and description of the event type:
|
4000005604 |
Discrepancies detected compared with the reference configuration component $inventory_loc_key on the device |
When monitoring device configurations, discrepancies were found compared to the reference configuration component according to device scan results (for jobs that run in the Compare with benchmark configuration processing mode). The following variables are used in the title and description of the event type:
|
4000005700 |
Public key mismatch detected while connecting to the device remotely |
When connecting to the device remotely, a mismatch was detected between the received public key of the device and the value stored in the application. Device scan canceled. The following variables are used in the description of the event type:
|
4000005701 |
Public key mismatch detected during device active polling |
While actively polling a device, a mismatch was detected between the received public key of the device and the value stored in the application. Active polling canceled for the device. The following variables are used in the description of the event type:
|
4000000004 |
Test event (AM) |
Test network packet detected (with device activity detection method enabled). |
System event types of the External systems technology
This article describes the system event types of the External systems technology (see the table below).
System event types of the External systems (EXT) technology
Code |
Event type title |
Conditions for registration |
|---|---|---|
8000000001 |
Aggregate event |
A sequence of events was detected that satisfied the conditions of a correlation rule. When registering an aggregate event, the title and description from the correlation rule are used as the title and description of the event. |
4000005400 |
Event from external system |
Event received from an external system using the Kaspersky Anti Targeted Attack Platform API NDR. When the event is registered, the title and description are determined by the external system. |
System event types of the Endpoint Protection Platform technology
This article describes the system event types of the Endpoint Protection Platform (see the table below).
System event type using the Endpoint Protection Platform (EPP) technology
Code |
Event type title |
Conditions for registration |
|---|---|---|
4000005500 |
Activity specific for network attacks |
The integration server received information about the triggering of the Network Threat Protection component of an EPP application. In the description of the event type, the $epp_event_description variable is used for the information from the EPP application. |
4000005501 |
Connection of an untrusted external device |
The integration server received information about the triggering of the Device Control component of an EPP application. In the description of the event type, the $epp_event_description variable is used for the information from the EPP application. |
4000005502 |
Attempt to run an unauthorized or untrusted application |
The integration server received information about the triggering of the Device Control component of an EPP application. In the description of the event type, the $epp_event_description variable is used for the information from the EPP application. |
4000005503 |
Prohibited file operation in the specified monitoring scope |
The integration server received information about the triggering of the File Integrity Monitor component of an EPP application. In the description of the event type, the $epp_event_description variable is used for the information from the EPP application. |
4000005504 |
Files in the specified monitoring scope are modified |
The integration server received information about the triggering of the Baseline File Integrity Monitor component of an EPP application. In the description of the event type, the $epp_event_description variable is used for the information from the EPP application. |
4000005505 |
Network connection not allowed by firewall rules |
The integration server received information about the triggering of the Firewall Management component of an EPP application. In the description of the event type, the $epp_event_description variable is used for the information from the EPP application. |
4000005506 |
System registry modifications in the specified monitoring scope |
The integration server received information about the triggering of the Registry Access Monitor component of an EPP application. In the description of the event type, the $epp_event_description variable is used for the information from the EPP application. |
4000005507 |
Log analysis rule was triggered |
The integration server received information about the triggering of the Log Inspection component of an EPP application. In the description of the event type, the $epp_event_description variable is used for the information from the EPP application. |
4000005508 |
Attempt to exploit a vulnerability in a protected process |
The integration server received information about the triggering of the Exploit Protection component of an EPP application. In the description of the event type, the $epp_event_description variable is used for the information from the EPP application. |
4000005509 |
Attempt to maliciously encrypt network file resources |
The integration server received information about the triggering of the Anti-Cryptor component of an EPP application. In the description of the event type, the $epp_event_description variable is used for the information from the EPP application. |
4000005510 |
Attempt to connect to a Wi-Fi network |
The integration server received information about the triggering of the Wi-Fi Control component of an EPP application. In the description of the event type, the $epp_event_description variable is used for the information from the EPP application. |
4000005512 |
Infected or probably infected object was detected |
The integration server received information about the triggering of the Real-Time File Protection component of an EPP application. In the description of the event type, the $epp_event_description variable is used for the information from the EPP application. |
4000005513 |
Sigma rule $sigmaAlertTitle triggered |
The integration server received data about an Endpoint Agent component Sigma rule being triggered. The following variables are used in the title and description of the event type:
|
Configuring risk types
Risk types define the settings that are used when registering risks in Kaspersky Anti Targeted Attack Platform: names, categories, and base scores for risks. You can view the settings of risk types and, if necessary, change the base scores for some risk types.
After the installation, the application uses the original list of risk types. You can update and add supported risk types by installing updates.
Viewing the table of risk types
The table of risk types is displayed in the Settings section, [Risk types]] subsection of the application web interface.
Risk type settings are displayed in the following columns of the table:
- Code.
Unique number of the risk type. In the table of registered risks, the number of the risk type is displayed in the details area of the selected risk.
- Name.
Name of the risk type displayed in the table of risk types. When registering a risk, its name may not completely match the name of the risk type used. The names of some risk types may be completely replaced with other names for registered risks. For instance, risk types with such names include risks of the Risk from external system types. If a risk of this type is registered, the application keeps the name of the risk specified in the source of information about the risk (for example, in an external system that uses the Kaspersky Anti Targeted Attack Platform API NDR).
- Category.
The name of the risk category.
- Base score
Baseline for calculating the score of the registered risk. The configured base scores are applied when registering all risks, except for risks from external systems. Risk types named Risk from external system have base scores of zero. Base scores for such risks must be specified in external systems that register risks using the Kaspersky Anti Targeted Attack Platform API NDR.
When viewing the table of risk types, you can use the configuration, filtering, searching, and sorting functionality.
Changing the base score for a risk type
Base scores cannot be changed for risk types named Risk from external system. If a risk of this type is registered, the base score of this risk must be provided by the source of information about the risk (for example, an external system that uses the Kaspersky Anti Targeted Attack Platform API NDR).
To change the base score for a risk type:
- In the window of the application web interface, select the Settings section, Risk types subsection.
- In the table of risk types, select the risk type for which you want to change the base score.
The details area is displayed in the right part of the web interface window.
- Click Edit.
- Enter the new base score.
- Click Save.
Managing the settings for storing risks
You can change the maximum total size limit for stored risks.
To change the risk storage settings:
- Log in to the web interface with the application administrator account.
- Select the Sensor servers section.
- Select the card of the Central Node server.
The details area is displayed in the right part of the web interface window.
- Click Edit.
In the details area, tabs are displayed, on which you can manage the settings of the server.
- On the General tab, go to Risks tab and use the Max volume setting to set the size limit for storing risks.
You can select the unit of measure for the size limit: MB or GB.
When editing the value, you also need to take into account that the sum total of all size limits may not exceed the specified maximum storage capacity for the node.
- If necessary, use the Storage time (days) setting to enable a minimum storage time for risks, and specify the minimum number of days.
- Click Save.
System event types in Kaspersky Anti Targeted Attack Platform
To register events, Kaspersky Anti Targeted Attack Platform uses system event types that are automatically created during application installation.
Each event type belongs to a certain event registration technology.
System event types of the Intrusion Detection technology
This article describes the system event types of the Intrusion Detection technology (see the table below).
Intrusion Detection (IDS) system event types
Code |
Event type title |
Conditions for registration |
|---|---|---|
4000003000 |
Rule from the $fileName set (system rule set) was triggered |
An intrusion detection rule from the system rule set is triggered. The following variables are used in the title and description of the event type:
|
4000003001 |
Rule from the $fileName set (user-defined rule set) was triggered |
An intrusion detection rule from the user-defined rule set is triggered. The following variables are used in the title and description of the event type:
|
4000003002 |
Signs of a brute-force attack or scan were detected |
A rule for detecting brute-force or scanning attack is triggered. In the description of the event type, the $ruleName variable is used for the rule name. |
4000004001 |
Symptoms of ARP spoofing detected in ARP replies |
Indicators of address spoofing in ARP packets detected: multiple ARP responses that are not associated with ARP requests. The following variables are used in the description of the event type:
|
4000004002 |
Symptoms of ARP spoofing detected in ARP requests |
Indicators of address spoofing in ARP packets detected: multiple ARP requests from the same MAC address to different destinations. The following variables are used in the description of the event type:
|
4000005100 |
IP protocol anomaly detected: data conflict when assembling IP packet |
IP protocol anomaly detected: data mismatch in overlapping IP packet fragments. |
4000005101 |
IP protocol anomaly detected: fragmented IP packet size exceeded |
IP protocol anomaly detected: actual total size of fragmented IP packet after reassembly exceeds the allowed limit. |
4000005102 |
IP protocol anomaly detected: the size of the initial fragment of the IP packet is less than expected |
IP protocol anomaly detected: the size of the initial fragment of the IP packet is less than the minimum allowed value. |
4000005103 |
IP protocol anomaly detected: mis-associated fragments |
IP protocol anomaly detected: fragments of the IP packet being assembled contain different information about the length of the fragmented packet. |
4000002701 |
TCP protocol anomaly detected: content substitution in overlapping TCP segments |
TCP protocol anomaly detected: packets contain overlapping TCP segments with different content. |
4000000003 |
Test event (IDS) |
Test network packet detected (with rule-based intrusion detection enabled). |
System event types of the Asset Management technology
This article describes the system event types of the Asset Management technology (see the table below).
System event types of the Asset Management (AM) technology
Code |
Event type title |
Conditions for registration |
|---|---|---|
4000005003 |
Detected new device with the address $owner_ip_or_mac |
With Asset Monitoring in monitoring mode, a new device was automatically added by the detected IP or MAC address, which is not specified for other devices in the table. When registering the event, the application may simultaneously register an Unauthorized device risk for this device. In this case, a relation is established the risk and the event. The following variables are used in the title and description of the event type:
|
4000005004 |
Received new information about device with the address $owner_ip_or_mac |
With Asset Monitoring in monitoring mode, device information was automatically updated based on information received from traffic. The following variables are used in the title and description of the event type:
|
4000005005 |
IP address conflict detected $owner_ip |
With Asset Monitoring in monitoring mode, an IP address was detected that was not being used by the device for which the IP address was specified. The following variables are used in the title and description of the event type:
|
4000005006 |
Detected traffic from address $owner_ip_or_mac, which is assigned to device with the Archived status |
With Asset Management in monitoring mode, or based on data received from an EPP application, activity was detected from a device that has the Archived status. When registering the event, the application may simultaneously register an Unauthorized device risk for this device. In this case, a relation is established the risk and the event. The following variables are used in the title and description of the event type:
|
4000005007 |
Detected new IP address $new_ip_addr for device with the MAC address $owner_mac |
With Asset Monitoring in monitoring mode, a new IP address used by a device was detected. The following variables are used in the title and description of the event type:
|
4000005008 |
New MAC address ($owner_mac) was added to device with IP address $owner_ip |
In Asset Management monitoring mode, a MAC address was automatically added for a network interface that had only an IP address specified (the device had the Unauthorized or Archived status). The following variables are used in the title and description of the event type:
|
4000005009 |
New IP address ($owner_ip) was added to device with the MAC address $owner_mac |
In Asset Management monitoring mode, an IP address was automatically added for a network interface that had only a MAC address specified (the device had the Unauthorized or Archived status). The following variables are used in the title and description of the event type:
|
4000005010 |
Detected new MAC address $new_mac_addr for device with the IP address $owner_ip |
With Asset Monitoring in monitoring mode, a new MAC address used by a device was detected (with automatic update of address information disabled for this device). The following variables are used in the title and description of the event type:
|
4000005011 |
Detected change of MAC address $owner_mac to $challenger_mac in device data received from EPP application |
Based on information received from an EPP application, the MAC address of the device has been updated. The following variables are used in the title and description of the event type:
|
4000005012 |
New address information for device $asset_name found in data received from EPP application |
New address information of a device was found in data received from an EPP application. An event of this type is registered if the change of the address information of the device has not been processed by the application as event 4000005009 or 4000005010. The following variables are used in the title and description of the event type:
|
4000005013 |
Conflict detected in addresses of devices $conflicted_epp_assets after data was received from EPP application |
Based on the information received from the EPP application, a conflict with the addresses of multiple devices in Kaspersky Anti Targeted Attack Platform was detected. According to the information from the EPP application, the addresses belong to the same device. The following variables are used in the title and description of the event type:
|
4000005014 |
Subnet $subnet_mask was added from EPP application data |
After getting information from an EPP application, a new subnet was automatically added to the list of known subnets. The subnet is added to the address space in which the data source can be the integration server getting information from the EPP application. If multiple such address spaces exist, an address space is selected that contains the most suitable subnet for automatically adding a new nested subnet. The following variables are used in the title and description of the event type:
|
4000005016 |
Unauthorized DHCP server detected with IP address $owner_ip |
The $asset_name device (ID: $asset_id) with the address $owner_ip_or_mac was identified as an unauthorized DHCP server. The following variables are used in the title and description of the event type:
|
4000005017 |
Unauthorized DHCP relay detected with IP address $owner_ip |
The $asset_name device (ID: $asset_id) with the address $owner_ip_or_mac was identified as an unauthorized DHCP relay. The following variables are used in the title and description of the event type:
|
4000005600 |
Changes detected in the list of users on the device with the address $owner_ip_or_mac |
Changes to user information were detected while controlling users on devices. The following variables are used in the title and description of the event type:
|
4000005601 |
Changes detected in the list of applications on the device with the address $owner_ip_or_mac |
Modified information about applications on the device detected while monitoring applications and patches on devices. The following variables are used in the title and description of the event type:
|
4000005602 |
Changes detected in the list of patches on the device with the address $owner_ip_or_mac |
Modified device patch information detected while monitoring applications and patches on devices. The following variables are used in the title and description of the event type:
|
4000005603 |
Changes detected in the configuration component $inventory_loc_key on the device |
While monitoring device configurations, changes in the configuration component were detected as compared to the previous configuration according to device scan results (for jobs that run in the Update only and/or Archive versions configuration processing modes). The following variables are used in the title and description of the event type:
|
4000005604 |
Discrepancies detected compared with the reference configuration component $inventory_loc_key on the device |
When monitoring device configurations, discrepancies were found compared to the reference configuration component according to device scan results (for jobs that run in the Compare with benchmark configuration processing mode). The following variables are used in the title and description of the event type:
|
4000005700 |
Public key mismatch detected while connecting to the device remotely |
When connecting to the device remotely, a mismatch was detected between the received public key of the device and the value stored in the application. Device scan canceled. The following variables are used in the description of the event type:
|
4000005701 |
Public key mismatch detected during device active polling |
While actively polling a device, a mismatch was detected between the received public key of the device and the value stored in the application. Active polling canceled for the device. The following variables are used in the description of the event type:
|
4000000004 |
Test event (AM) |
Test network packet detected (with device activity detection method enabled). |
System event types of the External systems technology
This article describes the system event types of the External systems technology (see the table below).
System event types of the External systems (EXT) technology
Code |
Event type title |
Conditions for registration |
|---|---|---|
8000000001 |
Aggregate event |
A sequence of events was detected that satisfied the conditions of a correlation rule. When registering an aggregate event, the title and description from the correlation rule are used as the title and description of the event. |
4000005400 |
Event from external system |
Event received from an external system using the Kaspersky Anti Targeted Attack Platform API NDR. When the event is registered, the title and description are determined by the external system. |
System event types of the Endpoint Protection Platform technology
This article describes the system event types of the Endpoint Protection Platform (see the table below).
System event type using the Endpoint Protection Platform (EPP) technology
Code |
Event type title |
Conditions for registration |
|---|---|---|
4000005500 |
Activity specific for network attacks |
The integration server received information about the triggering of the Network Threat Protection component of an EPP application. In the description of the event type, the $epp_event_description variable is used for the information from the EPP application. |
4000005501 |
Connection of an untrusted external device |
The integration server received information about the triggering of the Device Control component of an EPP application. In the description of the event type, the $epp_event_description variable is used for the information from the EPP application. |
4000005502 |
Attempt to run an unauthorized or untrusted application |
The integration server received information about the triggering of the Device Control component of an EPP application. In the description of the event type, the $epp_event_description variable is used for the information from the EPP application. |
4000005503 |
Prohibited file operation in the specified monitoring scope |
The integration server received information about the triggering of the File Integrity Monitor component of an EPP application. In the description of the event type, the $epp_event_description variable is used for the information from the EPP application. |
4000005504 |
Files in the specified monitoring scope are modified |
The integration server received information about the triggering of the Baseline File Integrity Monitor component of an EPP application. In the description of the event type, the $epp_event_description variable is used for the information from the EPP application. |
4000005505 |
Network connection not allowed by firewall rules |
The integration server received information about the triggering of the Firewall Management component of an EPP application. In the description of the event type, the $epp_event_description variable is used for the information from the EPP application. |
4000005506 |
System registry modifications in the specified monitoring scope |
The integration server received information about the triggering of the Registry Access Monitor component of an EPP application. In the description of the event type, the $epp_event_description variable is used for the information from the EPP application. |
4000005507 |
Log analysis rule was triggered |
The integration server received information about the triggering of the Log Inspection component of an EPP application. In the description of the event type, the $epp_event_description variable is used for the information from the EPP application. |
4000005508 |
Attempt to exploit a vulnerability in a protected process |
The integration server received information about the triggering of the Exploit Protection component of an EPP application. In the description of the event type, the $epp_event_description variable is used for the information from the EPP application. |
4000005509 |
Attempt to maliciously encrypt network file resources |
The integration server received information about the triggering of the Anti-Cryptor component of an EPP application. In the description of the event type, the $epp_event_description variable is used for the information from the EPP application. |
4000005510 |
Attempt to connect to a Wi-Fi network |
The integration server received information about the triggering of the Wi-Fi Control component of an EPP application. In the description of the event type, the $epp_event_description variable is used for the information from the EPP application. |
4000005512 |
Infected or probably infected object was detected |
The integration server received information about the triggering of the Real-Time File Protection component of an EPP application. In the description of the event type, the $epp_event_description variable is used for the information from the EPP application. |
4000005513 |
Sigma rule $sigmaAlertTitle triggered |
The integration server received data about an Endpoint Agent component Sigma rule being triggered. The following variables are used in the title and description of the event type:
|
Managing Endpoint Agent host information
The application that is used as the Endpoint Agent component is installed on individual computers (hereinafter also referred to as "hosts") in the IT infrastructure of the organization. The application continuously monitors processes running on those hosts, active network connections, and files that are being modified.
Users with the Senior security officer, Security officer, Security auditor, and Administrator roles can assess how regularly data is received from hosts with the Endpoint Agent component on the Endpoint Agents tab of the web interface window of the Central Node server for tenants to whose data the user has access. If you are using the distributed solution and multitenancy mode, the web interface of the PCN server displays the list of hosts with the Endpoint Agent component for the PCN and all connected SCNs.
Users with the Administrator role can configure the display of how regularly data is received from hosts with Endpoint Agent for tenants to whose data they have access.
If suspicious network activity is detected, users with the Senior security officer role can isolate from the network any host with Kaspersky Endpoint Agent, for tenants to whose data the user has access. In this case, the connection between the server with the Central Node component and a host with the Endpoint Agent component will not be interrupted.
In order to provide support in case of problems with the Endpoint Agent component, Technical Support staff may ask you to perform the following actions for debugging purposes (including in Technical Support Mode):
- Activate collection of extended diagnostic information.
- Modify the settings of individual application components.
- Modify the settings for storing and sending the obtained diagnostic information.
- Configure network traffic to be intercepted and saved to a file.
Technical Support staff will provide all the information needed to perform these operations (description of the sequence of steps, settings to be modified, configuration files, scripts, additional command line functionality, debugging modules, special-purpose utilities, and other resources) and inform you about the scope of data obtained for debugging purposes. The retrieved diagnostic information is saved on the user's computer. The retrieved data is not automatically sent to Kaspersky.
The operations listed above should be performed only when instructed by and under the supervision of Technical Support experts. Unsupervised changes to application settings performed in ways other than those described in this manual or according to the instructions of Technical Support experts can slow down or crash the operating system, reduce computer security, or compromise the availability and integrity of data being processed.
Viewing the table of hosts with the Endpoint Agent component
To view the table of hosts with the Endpoint Agent component:
- Select the Assets section in the application web interface window.
- Go to the Endpoint Agents tab.
The table of hosts with the Endpoint Agent component is displayed.
If you are using the distributed solution and multitenancy mode, the table contains information about hosts with the Endpoint Agent component connected to the PCN and all SCN servers.
The table can display the following data:
- Number of hosts and activity indicators of the Endpoint Agent component:
- Critical inactivity is the number of hosts from which latest data was received a very long time ago.
- Warning is the number hosts from which latest data was received a long time ago.
- Normal activity is the number of hosts from which latest data was recently received.
- Host—Name of the host with the Endpoint Agent component.
- Servers is the name of the server to which the host with the Endpoint Agent component is connected.
This field is displayed if you are using the distributed solution and multitenancy mode.
- IP is the IP address of the host where the Endpoint Agent component is installed.
- OS is the version of the operating system that is installed on the host with the Endpoint Agent component.
- Version—Version of the Endpoint Agent component installed.
- Activity—Activity indicator of the Endpoint Agent component.
- Normal activity for hosts from which latest data was recently received.
- Warning for hosts from which latest data was received a long time ago.
- Critical inactivity for hosts from which latest data was received an extremely long time ago.
- Last connection for the date and time of the last connection of the Endpoint Agent component to the Central Node server.
Clicking the link with the host name opens a list in which you can select one of the following actions:
- Filter by this value.
- Exclude from filter.
- Run the following tasks:
- Kill process.
- Delete file.
- Kill by unique PID.
- Get file.
- Get forensics.
- Quarantine file.
- Run application.
- New prevention rule.
- Isolate from network.
- Find events.
- Find alerts.
- Copy value to clipboard.
The list of available actions depends on the type of Endpoint Agent component: for Windows, Linux, or Mac (for details, see the Operating principle of the application section).
Clicking the link with the IP opens a list in which you can select one of the following actions:
- Filter by this value.
- Exclude from filter.
- Find alerts.
- Copy value to clipboard.
If you are using only KATA functionality (the KATA key), the following actions are available in the list that is displayed by clicking the host name link:
- Find alerts (displayed for users with the Senior security officer role).
- Filter by this value.
- Exclude from filter.
- Copy value to clipboard.
Clicking a link in any other column of the table opens a list in which you can select one of the following actions:
- Filter by this value.
- Exclude from filter.
- Copy value to clipboard.
Configuring the display of the table of hosts with the Endpoint Agent component
You can show or hide columns and change the order of columns in the table of hosts with the Endpoint Agent component.
To configure the display of the table of hosts with the Endpoint Agent component:
- Select the Assets section in the application web interface window.
- Go to the Endpoint Agents tab.
- In the heading part of the table, click .
- This opens the Customize table window.
- If you want to show a column in the table, select the check box next to the name of the parameter that you want displayed in the table.
If you want to hide a parameter in the table, clear the check box.
At least one check box must be selected.
- If you want to change the order of columns in the table, move the mouse cursor to the row with the relevant parameter, click and move the row to its new place.
- If you want to restore default table display settings, click Default.
- Click Apply.
The display of the table of hosts with the Endpoint Agent component is configured.
Page top
Viewing information about a host
To view information about a host with the Endpoint Agent component:
- Select the Assets section in the application web interface window.
- Go to the Endpoint Agents tab.
- Select the host for which you want to view information.
This opens a window containing information about the host.
The window contains the following information:
- Recommendations group:
- Clicking the Alerts link opens the Alerts section with the search condition containing the selected host.
- Clicking the Events link opens the Threat Hunting section with the search condition containing the selected host.
- Clicking the Events affected by prevention rules link opens the Threat Hunting section with the search condition containing the selected host and the Blocked application (prevention rule) event type.
If you only use the KATA functionality (the KATA key), only the Alerts link is displayed in the recommendations section.
- On the Details tab, the Host section displays the following information:
- Name is the name of the host with the Endpoint Agent component.
- IP is the IP address of the host where the Endpoint Agent component is installed.
- OS—Version of the operating system on the host with the Endpoint Agent component installed.
- On the Details tab, the Endpoint Agent section displays the following information:
- Version—Version of the Endpoint Agent component installed.
- Activity is the activity indicator of the Endpoint Agent component. Possible values:
- Normal activity for hosts from which latest data was recently received.
- Warning for hosts from which latest data was received a long time ago.
- Critical inactivity for hosts from which latest data was received an extremely long time ago.
- Server—Name of the SCN or PCN server. Only displayed in distributed solution and multitenancy mode.
- Connected to server—Name of the Central Node server.
- Last connection—time of the last connection to the Central Node, SCN, or PCN server.
- License key status—For example, "OK".
- On the Prevention rules tab, you can see MD5 or SHA256 hashes for files that were prevented from running or opening on the host. The following information is displayed:
- Name—Name of the file.
- State—State of the prevention rule.
- Hash—Hashing algorithm.
If you are using only KATA functionality (the KATA key), the Prevention rules tab is not displayed.
- On the Tasks tab, you can see which tasks were run on the host. The following information is displayed:
- Time created—Task creation date and time.
- Name—Task name.
- Details—Full path to the file or data stream for which the task was created.
- State—Task completion status.
If you are using only KATA functionality (the KATA key), the Tasks tab is not displayed.
Clicking the link with the host name opens a list in which you can select one of the following actions:
- Run the following tasks:
- Kill process.
- Delete file.
- Get file.
- Get forensics.
- Quarantine file.
- Run application.
- New prevention rule.
- Isolate from network.
- Find events.
- Find alerts.
- Filter by this value.
- Exclude from filter.
- Copy value to clipboard.
The list of available actions depends on the type of Endpoint Agent component: for Windows, Linux, or Mac (for details, see the Operating principle of the application section).
Clicking the link with the IP opens a list in which you can select one of the following actions:
- Find events.
- Find alerts.
- Copy value to clipboard.
If you are using only KATA functionality (the KATA key), the following actions are available in the list that is displayed by clicking the host name and IP address links:
- Find alerts.
- Copy value to clipboard.
Filtering and searching hosts with the Endpoint Agent component by host name
To filter or search for hosts with the Endpoint Agent component by host name:
- Select the Assets section in the application web interface window.
- Go to the Endpoint Agents tab.
This opens the table of hosts.
- Click the Host link to open the filter configuration window.
- If you want to display only isolated hosts, select the Show isolated Endpoint Agents only check box.
- In the drop-down list, select one of the following filtering operators:
- Contain
- Not contain
- In the entry field, specify one or several characters of the host name.
- To add a filter condition using a different criterion, click and specify the filter condition.
- If you want to delete the filter condition, click the button to the right of the field.
- Click Apply.
The filter configuration window closes.
The table displays only those hosts that match the filter criteria you have set.
You can use multiple filters at the same time.
Filtering and searching hosts with the Endpoint Agent component that have been isolated from the network
To filter or search for hosts with the Endpoint Agent component that are isolated from the network:
- Select the Assets section in the application web interface window.
- Go to the Endpoint Agents tab.
This opens the table of hosts.
- Click the Host link to open the filter configuration window.
- Select the Show isolated Endpoint Agents only check box.
- Click Apply.
The filter configuration window closes.
The table displays only those hosts that match the filter criteria you have set.
You can use multiple filters at the same time.
Filtering and searching hosts with the Endpoint Agent component by PCN and SCN server names
If you are using the distributed solution and multitenancy mode, you can filter or find hosts with the Kaspersky Endpoint Agent component based on the names of PCN and SCN servers to which those hosts are connected.
To filter or search for hosts with the Endpoint Agent component by the names of PCN and SCN servers:
- Select the Assets section in the application web interface window.
- Go to the Endpoint Agents tab.
This opens the table of hosts.
- Click the Servers link to open the filter configuration window.
- Select check boxes next to names of servers by which you want to filter or search for hosts with the Endpoint Agent component.
- Click Apply.
The filter configuration window closes.
The table displays only those hosts that match the filter criteria you have set.
You can use multiple filters at the same time.
Filtering and searching hosts with the Endpoint Agent component by computer IP address
To filter or search for hosts with the Endpoint Agent component by IP address of the computer on which the application is installed:
- Select the Assets section in the application web interface window.
- Go to the Endpoint Agents tab.
This opens the table of hosts.
- Click the IP link to open the filter configuration window.
- In the drop-down list, select one of the following filtering operators:
- Contain
- Not contain
- In the entry field, specify one or several characters of the computer IP address. You can enter the IP address or subnet mask in IPv4 format (for example,
192.0.0.1or192.0.0.0/16). - To add a filter condition using a different criterion, click and specify the filter condition.
- If you want to delete the filter condition, click the button to the right of the field.
- Click Apply.
The filter configuration window closes.
The table displays only those hosts that match the filter criteria you have set.
You can use multiple filters at the same time.
Filtering and searching hosts with the Endpoint Agent component by operating system version on the computer
To filter or search for hosts with the Endpoint Agent component by version of the operating system installed on the computer:
- Select the Assets section in the application web interface window.
- Go to the Endpoint Agents tab.
This opens the table of hosts.
- Click the OS link to open the filter settings window.
- In the drop-down list, select one of the following filtering operators:
- Contain
- Not contain
- In the entry field, specify one or several characters of the operating system version.
- To add a filter condition using a different criterion, click and specify the filter condition.
- If you want to delete the filter condition, click the button to the right of the field.
- Click Apply.
The filter configuration window closes.
The table displays only those hosts that match the filter criteria you have set.
You can use multiple filters at the same time.
Filtering and searching hosts with the Endpoint Agent component by component version
You can filter hosts by version of the application that is used in the role of the Endpoint Agent component.
To filter or search for hosts with the Endpoint Agent component by component version:
- Select the Assets section in the application web interface window.
- Go to the Endpoint Agents tab.
This opens the table of hosts.
- Click the Version link to open the filter settings window.
- In the drop-down list, select one of the following filtering operators:
- Contain
- Not contain
- In the entry field, specify one or more characters of the version of the application that is used as the Endpoint Agent component.
- To add a filter condition using a different criterion, click and specify the filter condition.
- If you want to delete the filter condition, click the button to the right of the field.
- Click Apply.
The filter configuration window closes.
The table displays only those hosts that match the filter criteria you have set.
You can use multiple filters at the same time.
Filtering and searching hosts with the Endpoint Agent component by their activity
To filter or search for hosts with the Endpoint Agent component by their activity:
- Select the Assets section in the application web interface window.
- Go to the Endpoint Agents tab.
This opens the table of hosts.
- Click the Activity link to open the filter configuration window.
Select check boxes next to one or multiple activity indicators:
- Normal activity, if you want to find hosts from which the last data was recently received.
- Warning, if you want to find hosts from which the last data was received a long time ago.
- Critical inactivity, if you want to find hosts from which the last data was received an extremely long time ago.
- Click Apply.
The filter configuration window closes.
The table displays only those hosts that match the filter criteria you have set.
You can use multiple filters at the same time.
Quickly creating a filter for hosts with the Endpoint Agent component
To quickly create a filter for hosts with the Endpoint Agent component:
- Select the Assets section in the application web interface window.
- Go to the Endpoint Agents tab.
This opens the table of hosts.
- Do the following to quickly add filter conditions to the filter being created:
- Position the mouse cursor on the link containing the table column value that you want to add as a filter condition.
- Left-click it.
This opens a list of actions to perform on the value.
- In the list that opens, select one of the following actions:
- Filter by this value, if you want to include this value in the filter condition.
- Exclude from filter, if you want to exclude the value from the filter condition.
- If you want to add several filter conditions to the filter being created, perform the actions to quickly add each filter condition to the filter being created.
The table displays only those hosts that match the filter criteria you have set.
Resetting the filter for hosts with the Endpoint Agent component
To clear the Endpoint Agent host filter for one or more filtering criteria:
- Select the Assets section in the application web interface window.
- Go to the Endpoint Agents tab.
- Click to the right of the header of the table column for which you want to clear the filter conditions.
If you want to clear several filter conditions, perform the necessary actions to clear each filter condition.
The selected filters are cleared.
The table displays only those hosts that match the filter criteria you have set.
Removing hosts with the Endpoint Agent component
To remove one or more hosts from the Endpoint Agents table:
- Select the Assets section in the application web interface window.
- Go to the Endpoint Agents tab.
- Select check boxes next to one or more hosts that you want to remove. You can select all hosts by selecting the check box in the row containing the headers of columns.
A control panel appears in the lower part of the window.
- Click Delete.
- This opens the action confirmation window; in that window, click Yes.
The selected hosts are removed from the Endpoint Agents table.
When hosts are removed the following changes are made in the web interface of Kaspersky Anti Targeted Attack Platform:
- You cannot create a task, prevention rule, or network isolation rule for a removed host.
- If a prevention rule was previously created for a host, its name in the rule window (the Prevent on field) is hidden when the host is removed. The rule continues to apply.
If this host reconnects to the Central Node server, the host name is restored in the Prevent on field and the prevention rule is applied to it again.
- If a network isolation rule was previously created for a host, it continues to apply until the time specified in the rule expires.
When this host reconnects to the Central Node, the rule is reapplied to this host.
- The metadata of objects quarantined on the remote host are deleted from Kaspersky Anti Targeted Attack Platform quarantine.
When this host reconnects to the Central Node server, the metadata of objects in Kaspersky Anti Targeted Attack Platform quarantine are not restored. You can avoid quarantine filling up on a host by clearing it on command line or in Kaspersky Security Center. For details, see the Help of the application that you are using in the role of the Endpoint Agent component.
- If an object was quarantined by the Quarantine file task on one host only and that host was removed, the Restore all button in the task window is inactive because the file cannot be restored on a removed host.
Event search by the name of the removed host remains available.
Configuring activity indicators of the Endpoint Agent component
Users with the Administrator role can define what durations of inactivity of the application that is used as the Endpoint Agent component are to be considered normal, low, or very low activity, and can configure the activity indicators for the application. Users with the Security auditor role can only view the settings of application activity indicators. Users with the Senior security officer or Security officer role can see activity indicators that you configured for the Endpoint Agent component in the Activity field of the Endpoint Agent host table in the Endpoint Agents section of the application web interface.
To configure activity indicators for the Endpoint Agent component:
- Log in to the application web interface under an Administrator or Senior security officer user account.
- In the window of the application web interface, select the Settings section, Endpoint Agents subsection.
- In the fields under the section name, enter the number of days of inactivity of hosts with the Endpoint Agent component that you want to display as Warning and Critical inactivity.
- Click Apply.
Activity indicators of the Endpoint Agent component are configured.
Supported interpreters and processes
Kaspersky Endpoint Agent application monitors the execution of scripts by the following interpreters:
- cmd.exe
- reg.exe
- regedit.exe
- regedt32.exe
- cscript.exe
- wscript.exe
- mmc.exe
- msiexec.exe
- mshta.exe
- rundll32.exe
- runlegacycplelevated.exe
- control.exe
- explorer.exe
- regsvr32.exe
- wwahost.exe
- powershell.exe
- java.exe and javaw.exe (only if started with the –jar option)
- InstallUtil.exe
- msdt.exe
- python.exe
- ruby.exe
- rubyw.exe
Information about the processes monitored by Kaspersky Endpoint Agent application is presented in the table below.
Processes and the file extensions that they open
Process |
File extensions |
|---|---|
winword.exe |
rtf doc dot docm docx dotx dotm docb |
excel.exe |
xls xlt xlm xlsx xlsm xltx xltm xlsb xla xlam xll xlw |
powerpnt.exe |
ppt pot pps pptx pptm potx potm ppam ppsx ppsm sldx sldm |
acrord32.exe |
|
wordpad.exe |
docx |
chrome.exe |
|
MicrosoftEdge.exe |
Network isolation of hosts with the Endpoint Agent component
When responding to threats, users with the Senior security officer role can isolate hosts with detected objects with issues during the incident investigation.
Network isolation is not a Threat Response action by itself. The security officer should take steps to investigate the incident on his own while the network isolation is active for the host. You can configure the duration of host network isolation when you create the network isolation rule.
If you are using Kaspersky Endpoint Agent for Windows as the Endpoint Agent component, network isolation is available for hosts with the Kaspersky Endpoint Agent application version 3.8 and later.
To ensure correct operation of an isolated host, it is recommended to meet the following conditions:
- Create a local administrator account on the host or save the domain account data to the cache before enabling the network isolation rule.
- Do not change the certificate and IP address of the server with the Central Node component while the network isolation rule is enabled.
Isolated hosts can access the following resources over the network:
- Server with the Central Node component.
- Source of application database updates (Kaspersky update server or custom source).
- Servers of the KSN service.
- Hosts added to network isolation rule exclusions.
In cases when the Endpoint Agent component is turned off on the host, and also for a certain period of time after turning on th component or restarting the computer with the component, network isolation of the host may be inactive.
Consider some limitations when applying network isolation.
Creating a network isolation rule
To create a network isolation rule:
- Select the Assets section in the application web interface window.
- Go to the Endpoint Agents tab.
This opens the table of hosts.
- Select the host for which you want to enable or disable the network isolation rule.
This opens a window containing information about the host.
- Click Isolate.
- In the Disable isolation after field, enter the time in hours (1 to 9999) during which network isolation of the host will be active.
- In the Exclusions for the host isolation rule settings group, in the Traffic direction list, select the direction of network traffic that must not be blocked:
- Incoming/Outgoing.
- Incoming.
- Outgoing.
- In the IP field, enter the IP address whose network traffic must not be blocked.
If you are using Kaspersky Endpoint Agent in the role of the Endpoint Agent component, you can use a proxy server for the connection of Kaspersky Endpoint Agent for Windows with Kaspersky Anti Targeted Attack Platform. When you add this proxy server to exclusions, network resources that can be accessed through the proxy server are also added to exclusions. If network resources that are accessed through the proxy server are added to exclusions, but the proxy server itself is not, such exclusions do not work.
- If you selected Incoming or Outgoing, in the Ports field enter the connection ports.
- If you want to add more than one exclusion, click Add and repeat the steps to fill in the Traffic direction, IP and Ports fields.
- Click Save.
The host will be isolated from the network.
You can also create a network isolation rule by clicking the Isolate <host name> link in the event information and in the alert information.
Users with the Security auditor and Security officer roles cannot create network isolation rules.
The network isolation feature is not available for hosts where Kaspersky Endpoint Security 11.4 for Linux is used as the Endpoint Agent component.
Adding an exclusion from a network isolation rule
To add an exclusion to a previously created network isolation rule:
- Select the Assets section in the application web interface window.
- Go to the Endpoint Agents tab.
This opens the table of hosts.
- Select the isolated host for which you want to create an exclusion from the network isolation rule.
This opens a window containing information about the host.
- Click the Add to exclusions link to expand the Exclusions for the host isolation rule settings group.
- Select the direction of network traffic that must not be blocked:
- Incoming/Outgoing.
- Incoming.
- Outgoing.
- In the IP field, enter the IP address whose network traffic must not be blocked.
- If you selected Incoming or Outgoing, in the Ports field enter the connection ports.
- If you want to add more than one exclusion, click Add and repeat the steps to fill in the Traffic direction, IP and Ports fields. Click Save.
The network isolation rule exclusion will be added.
If you are using Kaspersky Endpoint Agent for Windows in the role of the Endpoint Agent component, you can use a proxy server for the connection of Kaspersky Endpoint Agent with Kaspersky Anti Targeted Attack Platform. When you add this proxy server to exclusions, network resources that can be accessed through the proxy server are also added to exclusions. If network resources that are accessed through the proxy server are added to exclusions, but the proxy server itself is not, such exclusions do not work.
Users with the Security auditor and Security officer roles cannot create exclusions from a network isolation rule.
Page top
Deleting a network isolation rule
To delete a network isolation rule:
- Select the Assets section in the application web interface window.
- Go to the Endpoint Agents tab.
This opens the table of hosts.
- Click the name of the host for which you want to delete a network isolation rule to open the action menu for the host.
- Select the Delete host isolation rule action.
This opens the action confirmation window.
- Click Yes.
The network isolation rule for the host is deleted.
Users with the Security auditor and Security officer roles cannot remove network isolation rules.
Limitations that are relevant to network isolation
Some limitations apply when network isolation is used:
- When a network isolation rule is enabled on a host, all current connections are disconnected and a VPN connection becomes unavailable.
- If the application administrator replaces the certificate of the server with the Central Node component while a network isolation rule is enabled, you cannot disable the rule.
- The application blocks the connection of isolated hosts with an Active Directory server. If the operating system settings require a connection to Active Directory services for authorization, the user of an isolated host will not be able to log in to the system.
Automatically sending files from Kaspersky Endpoint Agent hosts to be scanned by the Sandbox component in accordance with Kaspersky TAA (IOA) rules
If this functionality is enabled, the application can automatically send files from hosts with the Endpoint Agent component for scanning with the Sandbox component in accordance with Kaspersky TAA (IOA) rules. Files are sent in accordance with the following principle:
- Kaspersky Anti Targeted Attack Platform checks the event database and marks events that match TAA (IOA) rules.
- If relevant conditions are found in TAA (IOA) rules, Kaspersky Anti Targeted Attack Platform sends files for scanning by the Sandbox component.
Requests for scanning files by the Sandbox component are not displayed in the Kaspersky Anti Targeted Attack Platform web interface.
- Based on the results of the scan, the application may create an alert.
You can view alerts created in this way by filtering alerts by the Details – Autosend to Sandbox attribute.
If automatic sending of files to be scanned by the Sandbox component is enabled, the volume of traffic processed by the component can become very large. If the Sandbox component server cannot support the increased load, some of the objects from the processing request queue are replaced with requests for processing files that are automatically sent for scanning.
To avoid dropping objects from the processing request queue, you can:
- Deploy additional Sandbox servers.
- Disable automatically sending files to be scanned by the Sandbox component.
- Add to exclusions those TAA (IOA) rules that most frequently cause Kaspersky Anti Targeted Attack Platform to send files for scanning by the Sandbox component.
Information about rules that are most frequently used by Kaspersky Anti Targeted Attack Platform to send files for scanning by the Sandbox component is displayed in the Sent to Sandbox by TAA rules widget. You can add this widget to your current layout.
When you add a file to exclusions, event marking and creation of alerts in accordance with this rule is also stopped.
Files that can be automatically sent for scanning by the Sandbox component are listed in the following table.
List of files that can be automatically sent for scanning by the Sandbox component
Event type |
File type |
|---|---|
Process started |
File of the started process and file of its parent process. |
Module loaded |
File of the loaded module and file of its parent process. |
Connection to remote host |
File of the parent process. |
Blocked application (prevention rule) |
File of the application that was blocked from running, and file of its parent process. |
Document blocked |
File of the document that was blocked from running, and file of its parent process. |
File changed |
Created, deleted, or modified file and file of the parent process. |
System event log |
File of the process (only for Linux). |
Registry modified |
File of the parent process. |
Port listened |
File of the parent process. |
Driver loaded |
File of the loaded driver. |
Detection |
Detected file and file of its parent process (if any). |
Detection processing result |
Detected file and file of its parent process (if any). |
AMSI scan |
Process file. |
Process: interpreted file run |
File that was started and file of its parent process. |
Process: console interactive input |
File of the parent process. |
Information about files sent for scanning by the Sandbox component is not displayed in the Kaspersky Anti Targeted Attack Platform web interface.
Enabling and disabling the automatic sending of files from hosts with the Endpoint Agent component to be scanned by the Sandbox component
To enable or disable automatically sending files to be scanned by the Sandbox component in accordance with Kaspersky TAA (IOA) rules:
- In the window of the application web interface, select the Settings section, Endpoint Agents subsection.
- Under Send files to Sandbox automatically:
- Set the Send files toggle switch to Enabled if you want to enable the automatic sending of files.
This functionality is enabled by default.
- Set the Send files toggle switch to Disabled if you want to disable the automatic sending of files.
Disabling this functionality does not affect the functioning of TAA (IOA) rules; only automatic sending of files is disabled.
- Set the Send files toggle switch to Enabled if you want to enable the automatic sending of files.
- Click Apply.
Automatically sending files to be scanned by the Sandbox component in accordance with Kaspersky TAA (IOA) rules is enabled or disabled.
In distributed solution and multitenancy mode, settings for automatically sending files for scanning by the Sandbox component in accordance with Kaspersky TAA (IOA) rules configured on the PCN server are also applied on SCN servers connected to that PCN server. If necessary, you can enable or disable the automatic sending of files on each selected SCN server individually.
Page top
Selecting operating systems to use when scanning objects in Sandbox
Users with the Senior security officer role can select a set of operating systems used as the basis for creating tasks for scanning objects by the Sandbox component. The Sandbox server must have virtual machines installed that match the selected set.
You can view a list of Sandbox servers and virtual machines deployed on a server.
Users with the Security auditor role can view the list of Sandbox servers and settings for a set of operating systems. Users with the Security officer role cannot view this section.
Page top
Viewing the table of servers with the Sandbox component
Users with the Security officer role cannot view the table of servers with the Sandbox component.
Users with the Senior security officer role can view the table of servers with the Sandbox component.
To view the table of servers with the Sandbox component:
- In the main window of the application web interface, select the Settings section, Sandbox servers subsection.
- Select the Servers tab.
A table is displayed with a list of Sandbox servers.
The table contains the following information:
- IP and name—IP address or fully qualified domain name of the server with the Sandbox component.
- Authorization—Status of the request to connect to the Sandbox component.
- Status—Status of the connection to the Sandbox component.
- Certificate fingerprint—Certificate fingerprint of the server with the Sandbox component.
- Virtual machines—List of virtual machines created on the server.
Selecting operating systems to use when scanning objects in Sandbox
To select the set of operating systems:
- In the main window of the application web interface, select the Settings section, Sandbox servers subsection.
- Go to the Settings tab.
- Under OS set, select one of the following options:
- Windows 7, Windows 10.
- CentOS 7.8, Windows 7, Windows 10.
- Astra Linux 1.7, Windows 7, Windows 10.
- Custom.
- If you selected Custom, under Set composition, select the check boxes next to the operating systems that you want to include in the set.
Custom operating systems are displayed in the list if virtual machines with these operating systems are installed on the Sandbox server. Preset operating systems are always displayed in the list, but if virtual machines running these operating systems are not deployed, the Unknown status is displayed next to the name of the operating system.
Kaspersky Anti Targeted Attack Platform will create tasks for scanning objects in Sandbox in accordance with the selected set.
If the set of operating systems installed on the Sandbox server does not match the set selected on the Central Node server, objects are not sent to be scanned by that Sandbox server. If multiple Sandbox servers are connected to the Central Node server, the application sends objects to those Sandbox servers whose installed operating systems match the set selected on Central Node.
You can change the set of operating systems in the course of using the application. In this case, you need to make sure that the configuration of the Sandbox server satisfies hardware requirements.
In distributed solution and multitenancy mode, the settings of the operating system set configured on the PCN server are not applied to SCN servers connected to that PCN server. You can select the set of operating systems for each PCN and SCN server individually.
Page top
Managing tasks
Users with the Senior security officer role creating tasks on a server have unlimited (root) access rights for all hosts with the Endpoint Agent component that are connected to that server.
In the web interface of the application, users with the Senior security officer role can manage files and applications on hosts by creating and removing tasks.
In distributed solution and multitenancy mode, Kill process, Get forensics, Get registry key, Start YARA scan, Manage services, Run application, Delete file, Restore file from quarantine, Quarantine file tasks can have one of the following types:
- Global—Created on the PCN server. These tasks apply to hosts that are connected to this PCN server and to all SCN servers that are connected to this PCN server. Tasks belong to the tenant for which the user is managing the program using the web interface.
- Local—Created on the SCN server. These tasks apply only to hosts that are connected to this SCN server. Tasks belong to the tenant for which the user is managing the program using the web interface.
Get file, Get process memory dump, Get NTFS metafiles, Get disk image, Get memory dump tasks run only on the specified host, regardless of the application operating mode.
The maximum task execution time is 24 hours. If the task did not complete in this time, execution is paused.
Users with the Senior security officer role can manage all tasks for tenants to whose data they have access.
Users with the Security officer role do not have access to tasks.
Users with the Security auditor role can view the task table and information about the selected task.
Viewing the task table
The tasks table contains a list of created tasks and is in the Tasks section of the application web interface window. You can view all tasks or only tasks created by you (current user).
You can show or hide tasks created by you using the Only mine toggle switch in the upper right corner of the window. The display of tasks created by the current user is enabled by default.
The tasks table contains the following information:
- Time—Task creation date and time.
- Type is the type of the task depending on the operating mode of the application and the server on which the task was created.
Tasks may be one of the following types:
- Global—Created on the PCN server. These tasks apply to hosts that are connected to this PCN server and to all SCN servers that are connected to this PCN server. Tasks belong to the tenant for which the user is managing the program using the web interface.
- Local—Created on the SCN server. These tasks apply only to hosts that are connected to this SCN server. Tasks belong to the tenant for which the user is managing the program using the web interface.
- Name—Task name.
Clicking the link with the name of the task type opens a list in which you can select one of the following actions:
- Filter by this value.
- Exclude from filter.
- Copy value to clipboard.
- Details—full path to the file or data stream for which the task was created, or the path to a shared network resource.
Clicking the link containing information about the path to the file or data stream opens a list in which you can select one of the following actions:
- Filter by this value.
- Exclude from filter.
- Copy value to clipboard.
- Servers—Name of the server with the PCN or SCN role on which the task is being run.
This field is displayed if you are using the distributed solution and multitenancy mode.
- Hosts—Name of the host on which the task is run.
This field is displayed only if you are using a standalone Central Node server.
- Created by—Name of the user who created the task.
If only tasks created by the current user are displayed, this column is not displayed.
- State—Task completion status.
A task can have one of the following statuses:
- Pending.
- In process.
- Completed.
Viewing information about a task
To view task details:
- Select the Tasks section in the application web interface window.
This opens the task table.
- Select the task for which you want to view information.
This opens a window containing information about the task.
The window can contain the following information depending on the task type:
- State—Task completion status.
- Description is the task description.
- File path—Path to the file or data stream.
- Information type—Type of the collected data.
- Registry key—Path to the registry key that you want to get.
- Process ID—Process identifier.
- Mask—Mask of files that are included in the data list.
- Metafiles—NTFS metafiles that you want to get.
- Volume—name of the drive from which you want to receive metafiles, disk image, or memory dump.
- Share path—path to a shared network resource.
- Stored file—link to the file received as a result of the task execution.
- Maximum nesting level—Maximum nesting level of folders which the application searches for files.
- Exclusions—Folders in which searching and scanning files is prohibited.
- Scan scope—Folders which are scanned by YARA rules.
- Action—Action that was performed for the service.
The application supports the following operations with services:
- Start.
- Stop.
- Pause.
- Resume.
- Delete.
- Modify startup type.
- Maximum scan duration—Maximum task execution time, after which the scan is stopped.
- SHA256—SHA256 hash of the file that you want to receive.
- Run as—Option to run the application using the name of the local system.
- Created by—Name of the user who created the task.
- Tenant—Name of the tenant. Displayed only when you are using the distributed solution and multitenancy mode.
- Time created—Time when the task was created.
- Time completed—Task completion time.
- Report—Task result on selected hosts.
Creating a get file task
You can retrieve a file from selected hosts with the Endpoint Agent component. To do so, you must create a get file task.
The file to be downloaded must not exceed 100 MB. If the file exceeds 100 MB, the task finishes with an error.
To create a get file task:
- Select the Tasks section in the application web interface window.
This opens the task table.
- Click the Add button and select File in the Get data drop-down list.
This opens the task creation window.
- Configure the following settings:
- File path—Path to the file that you want to receive.
If the requested file is linked to other NTFS data streams, running the task yields all files of NTFS data streams that the requested file is linked to.
You can also specify the path to an alternate data stream of this file. In this case, you receive only the files of the specified stream.
When creating a task, the application does not check if the specified path to the file that you want to receive is valid.
- MD5/SHA256—MD5- or SHA256 hash of the file that you want to receive. This field is optional.
- If you do not want to scan the file, clear the Send for scanning check box.
The check box is selected by default.
- Description is the task description. This field is optional.
- Host is the name or IP address of the host.
You can specify only one host.
- File path—Path to the file that you want to receive.
- Click Add.
The get file task will be created. The task runs automatically after it is created.
A file received through this task will be placed in Storage. If the get file task completed successfully, you can download the received file to your local computer.
If you are using the distributed solution and multitenancy mode, the archive is placed in Storage of the Central Node server to which the host specified in the Host field is connected.
You can also download the file from the task report window.
To download the file from the task report window:
- Select the Tasks section in the application web interface window.
This opens the task table.
- Open the get file task that you want to download.
- In the Report section, click the name or IP address of the host.
This opens a window containing information about the file.
- Click Download.
The file will be saved to your local computer in the browser's downloads folder.
Users with the Security auditor role cannot create get file tasks.
Users with the Security officer role do not have access to tasks.
Creating a forensic collection task
You can get lists of files, processes, and autorun points from selected Endpoint Agent hosts. To do so, you must create a forensic collection task.
To create a forensic collection task:
- Select the Tasks section in the application web interface window.
This opens the task table.
- Click the Add button and select Forensics in the Get data drop-down list.
This opens the task creation window.
- Configure the following settings:
- Information type is the type of collected data. Select the check box next to one, multiple, or all settings:
- Process list if you want to get a list of processes running on the host at the time of the task execution.
- Autorun point list if you want to get a list of autorun points.
The autorun points list includes information about applications added to the startup folder or registered in the Run keys of the registry, as well as applications that are automatically run at startup of a host with the Endpoint Agent component and when a user logs in to the operating system on the specified hosts.
- File list if you want to get a list of files stored in the selected folder or in all host folders at the time of the task execution.
- If you have selected the File list check box, in the Source type group of settings, select one of the following options:
- All local disks if you want the list of files to include files stored in all folders on local disks at the time of the task execution.
- Directory if you want the file list to include files stored in the specified folder and its subfolders at the time when the task is run.
- If you selected Directory, in the Start directory field, specify the path to the folder from which the file search should start.
You can use the following prefixes:
- System environment variables.
- User-defined environment variables.
When using user-defined environment variables, the list of files includes information about files in folders of all users who have set the specified environment variables. If user-defined environment variables override system environment variables, the list of files includes information about files in folders based on the values of system environment variables.
- In the Hosts field, enter the IP address or name of the host to which you want to assign the task.
You can specify multiple hosts.
If you are using Kaspersky Endpoint Agent in the role of the Endpoint Agent component, the forensics collection task can be assigned only to hosts running Kaspersky Endpoint Agent for Windows version 3.10 and later. Getting a list of autorun points is only supported on hosts with Kaspersky Endpoint Agent for Windows 3.12 and higher.
If necessary, you can specify the following search criteria for files in folders:
- Mask is the mask of files to be included in the list of files.
- Alternative data streams is the check box that enables recording information about alternate data streams in the file list.
If the requested file is linked to other NTFS data streams, running the task yields all files of NTFS data streams that the requested file is linked to.
The check box is selected by default.
- Maximum nesting level is the maximum nesting level of folders in which the application searches for files.
- Exclusions is the path to the folders in which you want to prohibit the search for information about files.
- Description is the task description.
- Information type is the type of collected data. Select the check box next to one, multiple, or all settings:
- Click Add.
The forensic collection task is created. The task runs automatically after it is created.
As a result of the task, the application places a ZIP archive in Storage; the archive contains a file with the selected data. If the task completed successfully, you can download the archive to your local computer.
Users with the Security auditor role cannot create forensic collection tasks.
Users with the Security officer role do not have access to tasks.
Creating a registry key retrieval task
You can retrieve a registry key from selected hosts with the Endpoint Agent component. To do so, you must create a registry key retrieval task.
To create a registry key retrieval task:
- Select the Tasks section in the application web interface window.
This opens the task table.
- Click the Add button and select Registry key in the Get data drop-down list.
This opens the task creation window.
- Configure the following settings:
- Registry key is the registry key that you want to get.
You can enter the registry key in one of the following formats:
- Relative to the root key.
For example, \REGISTRY\MACHINE\SOFTWARE\Microsoft\WindowsUpdate\Orchestrator.
- Relative with full name of the root key.
For example, HKEY_LOCAL_MACHINE\SOFTWARE\Microsoft\WindowsUpdate\Orchestrator.
- Relative with an abbreviation instead of the full name of the root key.
For example, HKLM\SOFTWARE\Microsoft\WindowsUpdate\Orchestrator.
If you want to get data from HKEY_CURRENT_USER, you must specify HKEY_USERS and the SID of the user: HKEY_USERS\<SID of the user>.
- Relative to the root key.
- Description is the task description. This field is optional.
- In the Hosts field, enter the name or IP address of the host to which you want to assign the task.
You can specify multiple hosts.
If you are using Kaspersky Endpoint Agent in the role of the Endpoint Agent component, the registry key retrieval task can be assigned only to hosts running Kaspersky Endpoint Agent for Windows version 3.13 and later.
- Registry key is the registry key that you want to get.
- Click Add.
The registry key retrieval task is created. The task runs automatically after it is created.
As a result of the task, the application places a ZIP archive in Storage; the archive contains a .reg file, which contains a list of all registry keys and values under the key that was specified when creating the task. You can download the archive to your local computer.
If the task results in an error, the archive file contains the description of the error.
Users with the Security auditor role cannot create this task.
Users with the Security officer role do not have access to tasks.
Creating an NTFS metafile retrieval task
You can retrieve NTFS metafiles from selected hosts with the Endpoint Agent component. To do so, you must create an NTFS metafile retrieval task.
To create an NTFS metafile retrieval task:
- Select the Tasks section in the application web interface window.
This opens the task table.
- Click the Add button and select NTFS metafiles in the Get data drop-down list.
This opens the task creation window.
- Configure the following settings:
- Metafiles is the list of metafiles that you can get using the task. Select the relevant metafile by selecting the corresponding check box.
You can select multiple metafiles.
- Volume is the name of the disk from which you want to get metafiles.
By default, the system disk is specified. You can enter the path to a different disk in the
<drive letter>:format. - Description is the task description. This field is optional.
- Hostis the name or IP address of the host to which you want to assign the task.
You can specify only one host.
If you are using Kaspersky Endpoint Agent in the role of the Endpoint Agent component, the NTFS metafile retrieval task can be assigned only to hosts running Kaspersky Endpoint Agent for Windows version 3.13 and later.
- Metafiles is the list of metafiles that you can get using the task. Select the relevant metafile by selecting the corresponding check box.
- Click Add.
The NTFS metafile creation task is created. The task runs automatically after it is created.
When the task finishes, the application places a ZIP archive containing the selected metafiles in Storage. You can download the archive to your local computer.
If the task results in an error, the archive file contains the description of the error.
If you are using the distributed solution and multitenancy mode, the archive is placed in Storage of the Central Node server to which the host specified in the Host field is connected.
If downloading selected metafiles exhausts Storage capacity, objects in Storage will be rotated. If a metafile is larger than total Storage capacity, it is not downloaded
Users with the Security auditor role cannot create this task. Users with the Security officer role do not have access to tasks.
Creating a process memory dump retrieval task
You can retrieve a process memory dump from selected hosts with the Endpoint Agent component. To do so, you must create a process memory dump retrieval task.
To create a process memory dump retrieval task:
- Select the Tasks section in the application web interface window.
This opens the task table.
- Click the Add button and select Process memory dump in the Get data drop-down list.
This opens the task creation window.
- Configure the following settings:
- Process ID is the ID of the process for which you want to get a memory dump.
- MD5/SHA256 is the MD5 or SHA256 hash of the file of the process of which you want to get a memory dump. This field is optional.
- Description is the task description. This field is optional.
- Hostis the name or IP address of the host to which you want to assign the task.
You can specify only one host.
If you are using Kaspersky Endpoint Agent in the role of the Endpoint Agent component, the process memory dump retrieval task can be assigned only to hosts running Kaspersky Endpoint Agent for Windows version 3.13 and later.
- Click Add.
The process memory dump retrieval task is created. The task runs automatically after it is created.
The task creates a ZIP archive in Storage, which contains a file with information about the process and a process memory dump file. You can download the archive to your local computer.
If the task results in an error, the archive file contains the description of the error.
If you are using the distributed solution and multitenancy mode, the archive is placed in Storage of the Central Node server to which the host specified in the Host field is connected.
Users with the Security auditor role cannot create this task.
Users with the Security officer role do not have access to tasks.
Creating a disk image retrieval task
You can retrieve a disk image from selected Kaspersky Endpoint Agent for Windows host. To do so, you must create an NTFS disk image retrieval task.
The resulting file can be saved only to a shared network resource.
To create a disk image retrieval task:
- Select the Tasks section in the application web interface window.
This opens the task table.
- Click the Add button and select Disk image in the Get data drop-down list.
This opens the task creation window.
- Configure the following settings:
- Share path—path to a shared network resource.
You need to specify the path in the Universal Naming Convention (UNC) format:
\\server\share\path.If the last folder with the specified name is absent, Kaspersky Endpoint Agent will create one. If creation is unsuccessful, an error will be displayed in the web interface of Kaspersky Anti Targeted Attack Platform.
- User name—user name of the account used to access the shared network resource.
- Password—password of the account used to access the shared network resource.
- Under Disk type, select one of the following options:
- Logical.
- Physical.
- If you selected Logical, enter a
% SystemDrive%variable or a drive letter without the colon and slash in the Volume field. - If you selected Physical, enter the disk number in the Physical drive field.
- Select the Split file into parts check box if you want the file to be divided into multiple parts when saved.
- If you selected the check box, in the Part size, GB field, specify the minimum size of one part of the saved file.
The minimum part size must be more than one gigabyte.
- Description is the task description. This field is optional.
- Host—the IP address or name of the host to which you want to assign the task.
- Share path—path to a shared network resource.
- Click Add.
The disk image retrieval task will be created. The task runs automatically after it is created.
The application places an archive containing a file or files in the EWF or RAW format in a network share. You can convert files from the RAW format to the EWF format.
If you are using Kaspersky Endpoint Agent in the role of the Endpoint Agent component, the task can be assigned only to hosts running Kaspersky Endpoint Agent for Windows version 3.14 and later.
Users with the Security auditor role cannot create tasks.
Users with the Security officer role do not have access to tasks.
Converting a file from RAW to EWF format
Kaspersky Endpoint Security saves the disk image in the RAW format. Files can also be compressed into an archive. A special Python script allows converting files from the RAW format to the EWF format. The script constantly looks for RAW files in the specified folder. If such files are detected, the script automatically converts the files to the EWF format.
convert_to_ewf_monitor.py script
For the script to work, the following software must be installed on the computer:
- The libewf library for accessing Expert Witness Compression Format (EWF) files.
The libewf library is open source software.
It is recommended to place the library files and the script file in the same folder.
- The Python interpreter.
To enable the conversion of disk image files:
- Start the command line interpreter.
- Change to the folder where the script is located.
- Run the following command:
py convert_to_ewf_monitor.py --source <full path to the source files folder> [additional settings]EWF conversion script parameters
Parameter
Description
--source <full path to folder>The full path to the folder in which the script looks for source files. The script also looks for files in subfolders at the specified path. This is a mandatory parameter.
--destination <full path to folder>The full path to the folder where the script saves converted files. The folder structure is preserved. By default, the script saves converted files in the folder specified in the
sourceparameter.--deleteDelete source files after successful conversion. If the conversion fails, the script skips deleting the source files and you can try again.
--ewftool <full path to folder>The full path to the ewfacquirestream.exe file. The path must include the file name. By default, the script attempts to locate the ewfacquirestream.exe file in the folder where the script is located.
--name_mask <regular expressions>Regular expressions to find source files to convert. You can use this option if you need to convert individual files. By default, the script looks for files using the
^diskdump_regular expression.--convert_single_dumpFind a single file to convert. After successful conversion of the single file, the script exits.
--workers_num <number of files>The maximum number of source files that the script can convert at the same time. You can use this setting to optimize the performance of the script. By default, the script can convert up to four files at a time.
--log_level <log level>Logging level. By default, the script uses the DEBUG logging level.
--log_path <full path to folder>The full path for saving log files. The path must include the file name of the log file. By default, the script displays events on the interpreter console.
Example:
|
Creating a RAM dump retrieval task
You can retrieve a RAM dump from a selected host with the Endpoint Agent component. To do so, you must create a memory dump retrieval task.
The resulting file can be saved only to a shared network resource.
To create a memory dump retrieval task:
- Select the Tasks section in the application web interface window.
This opens the task table.
- Click the Add button and select Memory dump in the Get data drop-down list.
This opens the task creation window.
- Configure the following settings:
- Share path—path to a shared network resource.
You need to specify the path in the Universal Naming Convention (UNC) format:
\\server\share\path.If the last folder with the specified name is absent, Kaspersky Endpoint Agent will create one. If creation is unsuccessful, an error will be displayed in the web interface of Kaspersky Anti Targeted Attack Platform.
- User name—user name of the account used to access the shared network resource.
- Password—password of the account used to access the shared network resource.
- Description is the task description. This field is optional.
- Host—the IP address or name of the host to which you want to assign the task.
- Share path—path to a shared network resource.
- Click Add.
The RAM dump retrieval task is created. The task runs automatically after it is created.
As a result, the application places a RAW file or an archive that contains a RAW file on the shared network resource.
If you are using Kaspersky Endpoint Agent in the role of the Endpoint Agent component, the task can be assigned only to hosts running Kaspersky Endpoint Agent for Windows version 3.14 and later.
Users with the Security auditor role cannot create tasks.
Users with the Security officer role do not have access to tasks.
Creating a process termination task
If you believe that a process running on the computer could threaten the security of the computer or the corporate LAN, you can terminate the process.
To create a process termination task:
- Select the Tasks section in the application web interface window.
This opens the task table.
- Click Add and select Kill process.
This opens the task creation window.
- Configure the following settings:
- File path —Path to the file of the process that you want to terminate.
You can also specify the path to an alternate data stream of this file. In this case, only processes of the specified data stream will be terminated. The processes of the other streams of this file will be executed.
- MD5/SHA256—MD5- or SHA256 hash of the file of the process that you want to terminate. This field is optional.
- Description is the task description. This field is optional.
- Task for—Task scope:
- If you want to run the task on all hosts of all servers, select the All hosts option.
- If you want to run the task on selected servers, select the Specified servers option and on the right of the Servers parameter name select the check boxes next to the names of the servers on which you want to run the task.
This option is available only when distributed solution and multitenancy mode is enabled.
- If you want to run the task on selected hosts, select the Specified hosts option and list these hosts in the Hosts field.
- File path —Path to the file of the process that you want to terminate.
- Click Add.
The process termination task will be created. The task runs automatically after it is created.
Users with the Security auditor role cannot create process termination tasks.
Users with the Security officer role do not have access to tasks.
Creating a task to scan hosts using YARA rules
You can scan hosts with the Endpoint Agent component using YARA rules. To do so, you must create a Start YARA scan task. You can create the task:
- In the Tasks section.
In this case, when creating the task, you must select YARA rules that you want to use to scan hosts.
- In the Custom rules section, YARA subsection.
In this case, a task is created to scan hosts using selected YARA rules.
To create a task for scanning hosts with the Kaspersky Endpoint Agent component using YARA rules in the Tasks section:
- Select the Tasks section in the application web interface window.
This opens the task table.
- Click Add and select Start YARA scan.
This opens the task creation window.
- Configure the following settings:
- Select rules is the name of the rule. You can enter the name of the rule or a sequence of characters from the name of the rule, then select the rule in the list.
You can add multiple rules.
- Scan is the scan scope. Select one of the following options:
- RAM if you want to scan processes that are running at the time of the task execution.
The application does not scan processes with a low priority.
- Autorun points if you want to scan autorun points obtained from the Get forensics task.
If you are using Kaspersky Endpoint Agent as the Endpoint Agent component, this function is available only when integrated with Kaspersky Endpoint Agent 3.13 or later.
To have autorun points scanned, you must specify hosts for which the Get forensics was previously run.
- Specified directories if you want to scan files that are located in a specified folder and all its nested folders at the time of the task execution.
- All local disks if you want to scan files stored in all folders on local disks at the time of the task execution.
Scanning all local disks can cause high load on the host.
- RAM if you want to scan processes that are running at the time of the task execution.
- If you selected RAM, if necessary, do the following:
- In the Processes field, enter short names of processes or a mask of files that you want to scan.
The application scans all processes with identical names that are running on the host.
If the Processes field is left blank, the application scans all processes that were running at the time of the task execution, except processes with PID under 10 and processes listed in the Exclusions field.
- In the Exclusions field, enter short names of processes or a mask of files that you want to exclude from scanning.
If multiple processes with identical names are running on the host, the application excludes all such processes from scanning.
- In the Processes field, enter short names of processes or a mask of files that you want to scan.
- If you selected Autorun points, in the Scan type field, select the scan type:
- Quick.
In this case, all autorun points are scanned, except COM objects.
- Full.
In this case, all autorun points are scanned, as well as files involved with them.
If you are using Kaspersky Endpoint Security for Windows as the Endpoint Agent component, a full scan is performed regardless of the selected setting.
- Quick.
- If you selected Specified directories:
- In the Specified directories field, specify the path to the directory in the format C:\<directory name>\*.
- In the Exclusions field, specify the path to the directory in the format C:\<directory name>\*.
- Maximum scan duration is the maximum scan duration.
When this time elapses, the scan is stopped even if some rules were not applied to scan the hosts. The task report contains results that are up-to-date at the moment when the scan was stopped.
- Description is the task description. This field is optional.
- Task for—Task scope:
- If you want to run the task on all hosts of all servers, select the All hosts option.
- If you want to run the task on selected servers, select the Specified servers option and on the right of the Servers parameter name select the check boxes next to the names of the servers on which you want to run the task.
This option is available only when distributed solution and multitenancy mode is enabled.
- If you want to run the task on selected hosts, select the Specified hosts option and list these hosts in the Hosts field.
If you are using Kaspersky Endpoint Agent in the role of the Endpoint Agent component, the task for scanning Kaspersky Endpoint Agent hosts using YARA rules can be assigned only to hosts running Kaspersky Endpoint Agent for Windows version 3.12 and later. If you simultaneously assign a task to hosts with Kaspersky Endpoint Agent 3.12 and earlier versions of the application, the task is executed only on hosts with Kaspersky Endpoint Agent 3.12.
- Select rules is the name of the rule. You can enter the name of the rule or a sequence of characters from the name of the rule, then select the rule in the list.
To create a task for scanning Kaspersky Endpoint Agent for Windows hosts using YARA rules in the Custom rules section, YARA subsection:
- In the window of the application web interface, select the Custom rules section, YARA subsection.
- Select check boxes to the left of rules that you want to use when scanning the hosts.
A control panel appears in the lower part of the window.
- Click Start YARA scan.
- Carry out step 3 of the instruction above.
Task creation is complete. The task runs automatically after it is created.
If the scan detects any threats, Kaspersky Anti Targeted Attack Platform creates corresponding alerts.
Users with the Security auditor role cannot create a task for scanning hosts using YARA rules.
Users with the Security officer role do not have access to tasks.
Creating a service management task
You can remotely start, stop, pause, or resume a service, as well as remove a service or change its start type on selected hosts with the Endpoint Agent component. To do so, you must create a service management task.
To create a service management task:
- Select the Tasks section in the application web interface window.
This opens the task table.
- Click Add and select Manage services.
This opens the task creation window.
- Configure the following settings:
- In the Service name field, enter the name of the service.
- In the MD5/SHA256 field, enter the MD5 or SHA256 hash of the service. This field is optional.
If you enter the hash of a service that is loaded from a DLL, Kaspersky Anti Targeted Attack Platform simultaneously compares the specified hash with the hash of the service DLL and the hash of the svchost process.
- In the Action field, select the operation that you want to perform on the service.
The application supports the following operations with services:
- Start.
- Stop.
- Pause.
- Resume.
- Delete.
- Modify startup type.
When you remove a service, processes that the service has started keep running until the system is restarted or the process is terminated.
- If you selected Modify startup type, in the Startup type, select the start type for the service.
- Description is the task description. This field is optional.
- Task for—Task scope:
- If you want to run the task on all hosts of all servers, select the All hosts option.
- If you want to run the task on selected servers, select the Specified servers option and on the right of the Servers parameter name select the check boxes next to the names of the servers on which you want to run the task.
This option is available only when distributed solution and multitenancy mode is enabled.
- If you want to run the task on selected hosts, select the Specified hosts option and list these hosts in the Hosts field.
If you are using Kaspersky Endpoint Agent as the Endpoint Agent component, the task can be assigned only to hosts running Kaspersky Endpoint Agent for Windows version 3.12 and later. Hosts running earlier versions of Kaspersky Endpoint Agent for Windows are displayed in the list of hosts, but cannot be selected.
- Click Add.
The service management task is created. The task runs automatically after it is created.
Stopping, pausing, deleting services or changing the start type of services that affect the functioning on the host is strongly discouraged. |
Users with the Security auditor role cannot create service management tasks.
Users with the Security officer role do not have access to tasks.
Creating an application execution task
You can create an application running task or command execution task.
If the standard output file or error output file reaches a size of 100 KB when the task is running, some of the data is deleted from the file. The file will not contain all the data.
To create a task for running an application or executing a command:
- Select the Tasks section in the application web interface window.
This opens the task table.
- Click Add and select Run application.
This opens the task creation window.
- Configure the following settings:
- In the File path and Working directory fields, enter values in one of the following ways:
- In the File path field, enter the full path to the executable file (for example,
C:\Windows\System32\ipconfig.exe).Leave the Working directory field empty.When creating a task, the application does not check if the specified path to the executable file is valid.
- In the File path field, enter the name and extension of the executable file (for example,
ipconfig.exe). In the Working directory field, enter the working directory (for example,C:\Windows\System32\).
- In the File path field, enter the full path to the executable file (for example,
- In the Arguments field, enter additional options for running the file or task (for example, the
/allargument). - In the Description field, enter the task description. This field is optional.
- Configure the Task for setting, that is, the task scope:
- If you want to run the task on all hosts of all servers, select the All hosts option.
- If you want to run the task on selected servers, select the Specified servers option and on the right of the Servers parameter name select the check boxes next to the names of the servers on which you want to run the task.
This option is available only when distributed solution and multitenancy mode is enabled.
- If you want to run the task on selected hosts, select the Specified hosts option and list these hosts in the Hosts field.
- In the File path and Working directory fields, enter values in one of the following ways:
- Click Add.
The application running task or command execution task is created. The task runs automatically after it is created.
Example: To run the
|
Users with the Security auditor role cannot create application running tasks or command execution tasks.
Users with the Security officer role do not have access to tasks.
Creating a file deletion task
To create a file deletion task:
- Select the Tasks section in the application web interface window.
This opens the task table.
- Click Add and select Delete file.
This opens the task creation window.
- Configure the following settings:
- File path—Path to the file that you want to delete.
You can also specify the path to an alternate data stream of this file. In this case, only the specified data stream will be deleted. The other data streams of this file will be left unchanged.
- MD5/SHA256—MD5- or SHA256 hash of the file that you want to delete. This field is optional.
- Description is the task description. This field is optional.
- Task for—Task scope:
- If you want to run the task on all hosts of all servers, select the All hosts option.
- If you want to run the task on selected servers, select the Specified servers option and on the right of the Servers parameter name select the check boxes next to the names of the servers on which you want to run the task.
This option is available only when distributed solution and multitenancy mode is enabled.
- If you want to run the task on selected hosts, select the Specified hosts option and list these hosts in the Hosts field.
- File path—Path to the file that you want to delete.
- Click Add.
The file deletion task will be created. The task runs automatically after it is created.
If the file has been blocked by another process, the task will be displayed with the Completed status but the file will be deleted only after the host is restarted. It is recommended to check whether the file is successfully deleted after the host is restarted.
Deleting the file from a mapped network drive is not supported.
Users with the Security auditor role cannot create file deletion tasks.
Users with the Security officer role do not have access to tasks.
Creating a file quarantine task
If you believe that an infected or probably infected file is on the computer with the Endpoint Agent component, you can isolate it by putting it into quarantine.
To create a file quarantine task:
- Select the Tasks section in the application web interface window.
This opens the task table.
- Click Add and select Quarantine file.
This opens the task creation window.
- Configure the following settings:
- In the File path field, enter the path to the file that you want to quarantine.
- In the MD5/SHA256 field, enter the MD5 or SHA256 hash of the file that you want to quarantine. This field is optional.
- Description is the task description. This field is optional.
- In the Hosts field, enter the name or IP address of the host to which you want to assign the task.
You can specify multiple hosts.
- Click Add.
The file quarantine task is created. The task runs automatically after it is created.
As a result of the task:
- The file is deleted from the folder of the computer where it is located and moved to the quarantine directory on the same computer, which was specified during configuration of the application that is used as the Endpoint Agent component.
- In the task list of the Tasks section of the application web interface, execution information about the task is displayed.
- In the file list in the Storage section, Quarantine subsection, information about the quarantined file is displayed.
If the file has been blocked by another process, the task is displayed with the Completed status but the file is placed in quarantine only after the host is restarted. It is recommended to check whether the task was successfully completed after the host is restarted.
The file quarantine task can finish with the Access denied error if you are trying to quarantine an executable file and it is currently running.
To solve this problem, create a process termination task for this file, and then try creating the file quarantine task again.
Users with the Security auditor role cannot create file quarantine tasks.
Users with the Security officer role do not have access to tasks.
Creating a quarantined file recovery task
If you believe that a previously isolated file is safe, you can restore it from quarantine to the host.
To create a task for restoring a file from quarantine:
- Select the Tasks section in the application web interface window.
This opens the task table.
- Click Add and select Restore file from quarantine.
This opens the task creation window.
- Configure the following settings:
- Description is the task description. This field is optional.
- File search—Name of the file in quarantine.
- Click Add.
The task for restoring a file from quarantine is created. The task runs automatically after it is created.
After restoring a file from quarantine to a host, metadata about the file remains in the table of objects placed in Storage.
In distributed solution and multitenancy mode, a file that is quarantined on an SCN server cannot be restored on the PCN server. You can restore the file on the SCN server on which the quarantine file task was created.
Users with the Security auditor role cannot create tasks to restore files from quarantine.
Users with the Security officer role do not have access to tasks.
Creating a copy of a task
To copy the task:
- Select the Tasks section in the application web interface window.
This opens the task table.
- Open the task that you want to copy.
- Click Duplicate.
This opens the task creation window. All task settings will be copied.
- If you want to modify task settings, edit one or more settings depending on the type of the task being copied.
- Click Add.
A copy of the selected task will be created.
Users with the Security auditor role cannot copy tasks.
Users with the Security officer role do not have access to tasks.
Deleting tasks
If you delete a task while it is running, the task results might not be saved.
If you delete a successfully completed file download task, the file is also deleted.
To delete a task:
- Select the Tasks section in the application web interface window.
This opens the task table.
- Open the task that you want to delete.
- Click Delete.
This opens the action confirmation window.
- Click Yes.
The task will be deleted.
To delete all or multiple tasks:
- Select the Tasks section in the application web interface window.
This opens the task table.
- Select check boxes next to the tasks that you want to delete.
You can select all tasks by selecting the check box in the row containing the headers of columns.
- In the pane that appears in the lower part of the window, click Delete.
This opens the action confirmation window.
- Click Yes.
The selected tasks are deleted.
Users with the Security auditor role cannot delete tasks.
Users with the Security officer role do not have access to tasks.
Filtering tasks by creation time
To filter tasks by creation time:
- Select the Tasks section in the application web interface window.
This opens the task table.
- Click the Time link to open the task filtering menu.
- Select one of the following task display periods:
- All if you want the application to display all created tasks in the table.
- Last hour if you want the application to display tasks that were created during the last hour in the table.
- Last day if you want the application to display tasks that were created during the last day in the table.
- Custom range if you want the application to display tasks that were created during a specified period in the table.
- If you have selected the Custom range task display period:
- This opens the calendar; in the calendar, specify the start and end dates of the task display period.
- Click Apply.
The calendar closes.
The tasks table displays only tasks matching the filter criteria you have set.
You can use multiple filters at the same time.
Filtering tasks by type
If you are using distributed solution and multitenancy mode, you can filter tasks by their type.
To filter tasks by type:
- Select the Tasks section in the application web interface window.
This opens the task table.
- Click the Type link to open the task filtering menu.
- Select one of the following task display options:
- All, if you want to display all tasks regardless of their type.
- Global, if you want to display only tasks that were created on the PCN server. These tasks apply to hosts that are connected to this PCN server and to all SCN servers that are connected to this PCN server. Tasks belong to the tenant for which the user is managing the program using the web interface.
- Local, if you want to display only tasks that were created on a SCN server. These tasks apply only to hosts that are connected to this SCN server. Tasks belong to the tenant for which the user is managing the program using the web interface.
The tasks table displays only tasks matching the filter criteria you have set.
You can use multiple filters at the same time.
Filtering tasks by name
To filter tasks by name:
- Select the Tasks section in the application web interface window.
This opens the task table.
- Click the Name link to open the task filtering menu.
- Select one or more check boxes:
- Kill process.
- Run application.
- Get forensics.
- Start YARA scan.
- Manage services.
- Get file.
- Delete file.
- Quarantine file.
- Restore file.
- Click Apply.
The tasks table displays only tasks matching the filter criteria you have set.
You can use multiple filters at the same time.
Filtering tasks by file name and path
You can filter tasks based on the Details criterion—Name and path to the file or data stream.
To filter tasks by name and path to the file or data stream:
- Select the Tasks section in the application web interface window.
This opens the task table.
- Click the Details link to open the task filter configuration window.
- In the drop-down list on the right, select Details.
- In the drop-down list on the left, select one of the following task filtering operators:
- Contain
- Not contain
- Equal to
- Not equal to
- In the entry field, specify one or several characters of the file name or path.
- To add a filter condition using a different criterion, click and specify the filter condition.
- Click Apply.
The tasks table displays only tasks matching the filter criteria you have set.
You can use multiple filters at the same time.
Filtering tasks by description
You can filter tasks by the Description criterion, which is the task description that was added when the task was created.
To filter tasks by description:
- Select the Tasks section in the application web interface window.
This opens the task table.
- Click the Details link to open the task filter configuration window.
- In the drop-down list on the left, select Description.
- In the drop-down list on the right, select one of the following task filtering operators:
- Contain
- Not contain
- Equal to
- Not equal to
- In the entry field, specify one or several characters of the file name or path.
- To add a filter condition using a different criterion, click and specify the filter condition.
- Click Apply.
The tasks table displays only tasks matching the filter criteria you have set.
You can use multiple filters at the same time.
Page top
Filtering tasks by server name
If you are using distributed solution and multitenancy mode, you can filter tasks based on the servers to which the tasks are applied.
To filter tasks by servers to which the tasks are applied:
- Select the Tasks section in the application web interface window.
This opens the task table.
- Click the Servers link to open the task filtering menu.
- Select the check boxes next to the names of the servers whose tasks you want to display.
The tasks table displays only tasks matching the filter criteria you have set.
You can use multiple filters at the same time.
Filtering tasks based on the name of the user that created the task
To filter tasks based on the user name that created the task, all tasks must be displayed. If only tasks created by the current user are displayed, tasks cannot be filtered by user name.
To filter tasks by the name of the user that created the task:
- Select the Tasks section in the application web interface window.
This opens the task table.
- Click the Created by link to open the task filtering menu.
- In the drop-down list, select one of the following task filtering operators:
- Contain
- Not contain
- In the entry field, specify one or several characters of the user name.
- To add a filter condition using a different criterion, click and specify the filter condition.
- Click Apply.
The tasks table displays only tasks matching the filter criteria you have set.
You can use multiple filters at the same time.
Filtering tasks by processing status
To filter tasks based on the status of their processing by the user:
- Select the Tasks section in the application web interface window.
This opens the task table.
- Click the State link to open the task filtering menu.
- Select one or more check boxes:
- Pending.
- In process.
- Completed.
- Click Apply.
The tasks table displays only tasks matching the filter criteria you have set.
You can use multiple filters at the same time.
Clearing a task filter
To clear the task filter for one or more filtering criteria:
- Select the Tasks section in the application web interface window.
This opens the task table.
- Click to the right of the header of the table column for which you want to clear the filter conditions.
If you want to clear several filter conditions, perform the necessary actions to clear each filter condition.
The selected filters are cleared.
The tasks table displays only tasks matching the filter criteria you have set.
Managing policies (prevention rules)
When working in the application web interface, users with the Senior security officer role can manage prevention rules for files and processes on selected hosts. For example, you can prevent the running of applications that you consider unsafe to use on the selected host with the Endpoint Agent component. The application identifies files based on their hash by using the MD5 and SHA256 hashing algorithms. You can create, enable, disable, delete, and modify prevention rules. Additionally, you can click the link with the name of the hashing algorithm in the prevention rule table to find objects, events, or alerts that have triggered prevention rules, such as Find events, Find alerts, Find on Kaspersky TIP, or Find on virustotal.com.
In distributed solution and multitenancy mode, prevention rules can have the following types:
- Global—Created on the PCN. These prevention rules apply to hosts that are connected to this PCN server and to all SCN servers that are connected to this PCN server. Prevention rules belong to the tenant which the user is managing in the program web interface.
- Local—Created on the SCN server. These prevention rules apply only to hosts that are connected to this SCN server. Prevention rules belong to the tenant which the user is managing in the program web interface.
Users with the Senior security officer role can create, edit, delete, enable, disable, and import prevention rules for tenants to whose data they have access.
Users with the Security officer role do not have access to policies.
Users with the Security auditor role can view the table of file run prevention rules and process run prevention rules, as well as information about the selected prevention rule, but they cannot edit the rules.
All changes to prevention rules are applied on hosts after an authorized connection is established with the selected hosts. If there is no connection with the hosts, the old prevention rules continue to be applied on the hosts. Changes to prevention rules do not affect processes that are already running.
Prevention rules can be created automatically based on preset politics (hereinafter also "presets") added by default. With presets turned on, a prevention rule is created based on a medium or high severity alert of the Sandbox component. The prevention rule thus created prevents running the file based on its MD5 hash. Users with the Senior security officer role can enable and disable presets.
Presets are not supported in distributed solution and multitenancy mode.
The same operations can be applied to automatically created or imported prevention rules as for manually created rules.
You can create only one prevention rule for each file hash.
The maximum supported number of prevention rules in the system is 50,000.
Prevention rules are enforced only if the Endpoint Agent component is running on the host. If an attempt to run a file is made before the component is started or after the component is shut down on a host, the file will not be blocked from running.
You can manage file and process running prevention rules on selected hosts using policies only if the Endpoint Agent component is integrated with the Central Node server; to do so, you must use the web interface of Kaspersky Anti Targeted Attack Platform.
If you are using Kaspersky Endpoint Security for Windows as the Endpoint Agent component, you must take into account that the application supports preventing from running office format files with certain extensions and certain script interpreters.
Viewing the prevention rule table
The table of prevention rules is in the Prevention section of the application web interface window.
The table contains the following information:
- Type is the type of the rule depending on the operating mode of the application and the role of the server which generated the rule:
- Global—Created on the PCN. These prevention rules apply to hosts that are connected to this PCN server and to all SCN servers that are connected to this PCN server. Prevention rules belong to the tenant which the user is managing in the program web interface.
- Local—Created on the SCN server. These prevention rules apply only to hosts that are connected to this SCN server. Prevention rules belong to the tenant which the user is managing in the program web interface.
- Name is the name of the prevention rule.
- Created by—Name of the user whose account was used to create the rule.
- File hash—Hashing algorithm applied to identify a file.
A file can be identified based on one of the following hashing algorithms:
- MD5.
- SHA256.
Clicking the link with the name of the hashing algorithm opens a list in which you can view the file hash and select one of the following actions:
- Filter by this value.
- Exclude from filter.
- Find on Kaspersky TIP.
- Find on virustotal.com (for SHA256).
- Find events.
When this action is performed, the Threat Hunting section opens with events that are already filtered based on the hash you selected.
- Find alerts.
When this action is performed, the Alerts section opens with alerts that are already filtered based on the hash you selected.
- Enable prevention rule.
- Disable prevention rule.
- Delete prevention rule.
- Copy value to clipboard.
- Servers are names of servers with the PCN or SCN role to which the prevention rule applies.
This field is displayed if you are using the distributed solution and multitenancy mode.
- Hosts is the name of the server with the Central Node component to whose hosts the prevention rule is applied.
This field is displayed only when you are using a standalone Central Node server.
- State is the current state of the prevention rule.
A prevention rule can have one of the following states:
- Enabled
- Disabled
Configuring prevention rule table display
You can show or hide columns and change the order of columns in the prevention rule table.
To configure prevention rule table display:
- Select the Prevention section in the application web interface window.
This opens the prevention rule table
- In the heading part of the table, click .
This opens the Customize table window.
- If you want to show a column in the table, select the check box next to the name of the parameter that you want displayed in the table.
If you want to hide a parameter in the table, clear the check box.
At least one check box must be selected.
- If you want to change the order of columns in the table, move the mouse cursor to the row with the relevant parameter, click and move the row to its new place.
- If you want to restore default table display settings, click Default.
- Click Apply.
The prevention rule table display is configured.
Page top
Viewing a prevention rule
To view a prevention rule:
- Select the Prevention section in the application web interface window.
This opens the prevention rule table
- Select the prevention rule that you want to view.
A prevention rule contains the following information:
- The Events link opens the Threat Hunting section with the search condition containing your selected prevention rule.
- State is the current state of the prevention rule.
A prevention rule can have one of the following states:
- Enabled
- Disabled
- The Details tab contains the following information:
- MD5/SHA256 is the hash of the file prevented from running.
Clicking the MD5/SHA256 link opens a list in which you can select one of the following actions:
- Find on Kaspersky TIP.
- Find events.
- Find alerts.
- Copy value to clipboard.
- Name is the name of the prevention rule or file prevented from running.
- Type is the type of the rule depending on the operating mode of the application and the role of the server which generated the rule:
- Global—Created on the PCN. These prevention rules apply to hosts that are connected to this PCN server and to all SCN servers that are connected to this PCN server. Prevention rules belong to the tenant which the user is managing in the program web interface.
- Local—Created on the SCN server. These prevention rules apply only to hosts that are connected to this SCN server. Prevention rules belong to the tenant which the user is managing in the program web interface.
- Notification is the state of the Notify user about blocking file execution setting.
- Prevent on is the list of hosts on which the prevention rule is applied.
If the prevention is in effect on all hosts, the All hosts section is displayed.
- MD5/SHA256 is the hash of the file prevented from running.
- The Change log tab contains a list of changes made to the prevention: time of the change, name of the user that changed the prevention, and actions taken on the prevention.
Creating a prevention rule
When you create a prevention rule for a system file, the host on which the file is prevented from running may work incorrectly. Kaspersky Anti Targeted Attack Platform does not check what type of files the prevention rule is created for.
To create a prevention rule:
- Select the Prevention section in the application web interface window.
This opens the prevention rule table
- Click Add.
- Select Create rule.
This opens the prevention rule creation window.
- Configure the following settings:
- State is the state of the prevention rule:
- If you want to enable the prevention rule, set the toggle switch to On.
- If you want to disable the prevention rule, set the toggle switch to Off.
- MD5/SHA256—MD5- or SHA256 hash of the file or data stream that you want to prevent from starting.
- Name is the name of the prevention rule.
- If you want the application to display a notification about prevention rule triggering to the user of the computer on which the prevention is applied, select the Notify user about blocking file execution check box.
If you selected the Notify user about blocking file execution check box and an attempt is made to execute a file prevented from running, the user is notified that an execution prevention rule was triggered by this file.
- Prevent on is the prevention rule scope:
- If you want to apply the prevention rule on all hosts of all servers, select All hosts.
- If you want to apply the prevention rule on selected servers, select the Specified servers option and on the right of the Servers parameter name select the check boxes next to the names of the servers on which you want to apply the prevention rule.
This option is available only when distributed solution and multitenancy mode is enabled.
- If you want to apply the prevention rule on selected hosts, select the Specified hosts option and list these hosts in the Hosts field.
If you are using a Kaspersky Endpoint Security for Linux version earlier than 12.2 in the role of the Endpoint Agent component, the prevention rule creation functionality is not available. When creating a prevention rule, if you select a host with Kaspersky Endpoint Security for Linux or all hosts as the scope of the rule, the rule is not applied or is only applied to hosts with Kaspersky Endpoint Agent for Windows and Kaspersky Endpoint Security for Windows.
- State is the state of the prevention rule:
- Click Add.
The file startup prevention will be created.
You can also import prevention rules.
Users with the Security auditor role cannot create file launch prevention rules.
Users with the Security officer role cannot access prevention rules.
Importing prevention rules
You can import a file with MD5 and SHA256 hashes for files that you want to prevent from running. For each hash, Kaspersky Anti Targeted Attack Platform creates a separate prevention rule.
The maximum size of the imported file is 10 MB. Only one hash per line is allowed.
To import prevention rules:
- Select the Prevention section in the application web interface window.
This opens the prevention rule table
- Click Add.
- Select Import rules.
This opens the prevention rule import window.
- Configure the following settings:
- State is the state of the prevention rule:
- If you want to enable all imported prevention rules, set the toggle switch to On.
- If you want to disable all imported prevention rules, set the toggle switch to Off.
- If you want the application to display a notification about prevention rules triggering to the user of the computer on which the prevention is applied, select the Notify user about blocking file execution check box.
The Prevent on field cannot be edited. By default, prevention rules created on a PCN server are applied on all hosts connected to that PCN server and all SCN servers connected to that PCN server (if you are using the distributed solution and multitenancy mode).
- State is the state of the prevention rule:
- Click Browse to upload the file containing hashes of files for which you want to create prevention rules.
This opens the file selection window.
- Select the file that you want to upload and click Open.
This closes the file selection window.
- Click Add.
The rules are imported.
Users with the Security auditor role cannot import file launch prevention rules.
Users with the Security officer role cannot access prevention rules.
Page top
Enabling and disabling a prevention rule
To enable or disable a prevention rule:
- Select the Prevention section in the application web interface window.
This opens the prevention rule table
- In the row containing the prevention rule that you want to enable or disable, in the State column, perform one of the following actions:
- If you want to enable the prevention rule, set the toggle switch to Enabled.
The prevention rule you selected will be enabled.
- If you want to disable the prevention rule, set the toggle switch to Disabled.
The prevention rule you selected will be disabled.
- If you want to enable the prevention rule, set the toggle switch to Enabled.
Users with the Security auditor role cannot enable or disable prevention rules.
Users with the Security officer role do not have access to the prevention rules for launching files and processes on selected hosts using policies.
Enabling and disabling presets
To enable or disable presets:
- Select the Prevention section in the application web interface window.
This opens the prevention rule table
- Select the Presets tab.
- In the row of the preset that you want to enable or disable, in the State column, set the toggle switch to Enabled or Disabled.
The preset is enabled or disabled. When a preset is disabled, all prevention rules that were previously automatically created are not removed.
Page top
Deleting prevention rules
You can delete a single prevention rule or multiple prevention rules, or all prevention rules at the same time.
To delete a single prevention rule:
- Select the Prevention section in the application web interface window.
This opens the prevention rule table
- Click the prevention rule that you want to delete.
This opens the prevention rule details window.
- Click Delete.
This opens the action confirmation window.
- Click Yes.
The prevention rule is deleted.
To delete all or multiple prevention rules:
- Select the Prevention section in the application web interface window.
This opens the prevention rule table
- Select check boxes next to prevention rules that you want to delete.
You can select all prevention rules by selecting the check box in the row containing the headers of columns.
- In the pane that appears in the lower part of the window, click Delete.
This opens the action confirmation window.
- Click Yes.
The selected prevention rules are deleted.
Users with the Security auditor role cannot delete prevention rules.
Users with the Security officer role do not have access to the prevention rules for launching files and processes on selected hosts using policies.
Filtering prevention rules by name
To filter prevention rules by name:
- Select the Prevention section in the application web interface window.
This opens the prevention rule table
- Click the Name link to open the prevention filtering menu.
- In the drop-down list, select one of the following prevention filtering operators:
- Contain
- Not contain
- In the text box, enter one or more characters of the prevention rule name.
- To add a filter condition using a different criterion, click and specify the filter condition.
- Click Apply.
The prevention rules table displays only the prevention rules that match the filter criteria you have set.
You can use multiple filters at the same time.
Filtering prevention rules by type
If you are using distributed solution and multitenancy mode, you can filter prevention rules by their type.
To filter prevention rules by type:
- Select the Prevention section in the application web interface window.
This opens the prevention rule table
- Click the Type link to open the prevention rule filtering menu.
- Select one of the following options for displaying prevention rules:
- All, if you want to display all prevention rules regardless of their type.
- Global, if you want to display only the prevention rules that were created on the PCN. These prevention rules apply to hosts that are connected to this PCN server and to all SCN servers that are connected to this PCN server. Prevention rules belong to the tenant which the user is managing in the application web interface.
- Local, if you want to display only prevention rules that were created on a SCN server. These prevention rules apply only to hosts that are connected to this SCN server. Prevention rules belong to the tenant which the user is managing in the application web interface.
The prevention rules table displays only the prevention rules that match the filter criteria you have set.
You can use multiple filters at the same time.
Filtering prevention rules by file hash
To filter prevention rules by file hash:
- Select the Prevention section in the application web interface window.
This opens the prevention rule table
- Click the File hash link to open the prevention rule filtering menu.
- In the drop-down list, select one of the following prevention filtering operators:
- Contain
- Not contain
- In the text box, enter one or several characters of the file hash.
- To add a filter condition using a different criterion, click and specify the filter condition.
- Click Apply.
The prevention rules table displays only the prevention rules that match the filter criteria you have set.
You can use multiple filters at the same time.
Filtering prevention rules by server name
If you are using the distributed solution and multitenancy mode, you can filter prevention rules based on the servers to which the prevention rules apply.
To filter prevention rules by server name:
- Select the Prevention section in the application web interface window.
This opens the prevention rule table
- Click the Servers link to open the prevention rule filtering menu.
- Select the check boxes next to those servers by which you want to filter the prevention rules.
- Click Apply.
The prevention rules table displays only the prevention rules that match the filter criteria you have set.
You can use multiple filters at the same time.
Page top
Clearing a prevention rule filter
To clear the prevention rule filter for one or more filtering criteria:
- Select the Prevention section in the application web interface window.
This opens the prevention rule table
- Click to the right of the header of the column of the prevention rule table for which you want to clear the filter conditions.
If you want to clear several filter conditions, perform the necessary actions to clear each filter condition.
The selected filters are cleared.
The prevention rules table displays only the prevention rules that match the filter criteria you have set.
Managing user-defined rules
For additional protection of the corporate IT infrastructure, you can configure TAA, IDS, IOC, and YARA custom rules.
Users with the Senior security officer role can work with custom TAA, IDS, IOC, and YARA rules: load and delete rule files, view lists of rules, and edit the selected rules.
Users with the Security auditor role can view the lists of custom TAA, IDS, IOC, and YARA rules and properties of selected rules without the possibility of editing.
Users with the Security officer role can view the lists of custom TAA, IOC, and YARA rules and properties of selected rules without the possibility of editing.
Using indicators of compromise (IOC) and attack (IOA) for Threat Hunting
Kaspersky Anti Targeted Attack Platform uses two types of indicators for threat hunting: IOC (Indicator of Compromise) and IOA (Indicator of Attack).
An IOC is a set of data about a malicious object or malicious activity. Kaspersky Anti Targeted Attack Platform uses IOC files conforming to the
standard, which is an open standard for describing indicators of compromise. IOC files contain a set of indicators that are compared to the indicators of an event. If the compared indicators match, the application considers the event to be a detection and creates an alert. The likelihood of an alert may increase if a scan detects exact matches between the data of an object and several IOC files.An IOA (also referred to as a "TAA (IOA) rule") is a rule containing the description of a suspicious activity in the system that could be a sign of a targeted attack. Kaspersky Anti Targeted Attack Platform scans the Events database of the application and marks events or event chains that match behaviors described by TAA (IOA) rules. The streaming scan technology is used, which involves continuous real-time scanning of events being received from protected devices.
TAA (IOA) rules created by Kaspersky experts are used by the TAA (Targeted Attack Analyzer) technology and are updated alongside the application databases. They are not displayed in the interface of the application and cannot be edited.
You can add user-defined IOC and TAA (IOA) rules using IOC files in the OpenIOC format as well as create TAA (IOA) rules based on event database search conditions.
The following table contains a comparative analysis of indicators of compromise (IOC) and attack (IOA).
Comparison of IOC and IOA indicators
Characteristic |
IOC in user-defined IOC rules |
IOA in user-defined TAA (IOA) rules |
IOA in TAA (IOA) rules created by Kaspersky experts |
|---|---|---|---|
Scan scope |
Computers with the Endpoint Agent component |
Application events database |
Application events database |
Scanning mechanism |
Periodical scan |
Streaming scan |
Streaming scan |
Can be added to exclusions from scan |
None. |
Not needed. Users with the Senior security officer role can edit the text of the indicator in custom TAA (IOA) rules as necessary. |
Yes. |
If you are using the distributed solution and multitenancy mode, this section displays information for the selected tenant.
Page top
Managing user-defined TAA (IOA) rules
Custom TAA (IOA) rules are created based on event databased search criteria. For example, if you want Kaspersky Anti Targeted Attack Platform to generate alerts for events when an application that you consider unsafe is started on computers with the Endpoint Agent component, you can:
- Generate a search query to the event database manually or upload an IOC file with indicators of compromise or a YAML file with a Sigma rule to detect this application.
When creating an IOC file, review the list of IOC terms that you can use to search for events in the Threat Hunting section. You can view the list of supported IOC terms by downloading the file from the link below.
 IOC terms for searching events in the Threat Hunting section
 - Create a custom TAA (IOA) rule based on event search conditions.
When Central Node server receives events matching the created TAA (IOA) rule, Kaspersky Anti Targeted Attack Platform generates alerts.
You can also create a TAA (IOA) rule based on conditions from an already loaded IOC file. To do so:
- Find events corresponding to the criteria of the selected file.
- Create a TAA (IOA) rule based on event search criteria from the selected file.
In distributed solution and multitenancy mode, TAA (IOA) rules can have one of the following types:
- Global—Created on the PCN server. These rules are used to scan events on this PCN server and all SCN servers connected to this PCN server. Scanned events belong to the tenant which the user is managing in the application web interface.
- Local—Created on the SCN server. These rules are used to scan events on this SCN server. Scanned events belong to the tenant which the user is managing in the application web interface.
The differences between user rules and Kaspersky rules are summarized in the following table.
Comparison of TAA (IOA) rules
Characteristic |
User-defined TAA (IOA) rules |
Kaspersky TAA (IOA) rules |
|---|---|---|
Recommendations on responding to the event |
No |
Yes You can view recommendations in |
Correspondence to technique in MITRE ATT&CK database |
No |
Yes You can view the description of the |
Display in the TAA (IOA) rule table |
Yes |
No |
Ability to disable database lookup for this rule |
||
Ability to delete or add the rule |
You can delete or add a rule in the web interface of the application |
Rules are updated together with application databases |
Searching for alerts and events in which TAA (IOA) rules were triggered |
Using Alerts and Events links in the TAA (IOA) rule information window |
Using Alerts and Events links in the alert information window |
Users with the Senior security officer role can create, import, delete, enable or disable TAA (IOA) rules, and exclude Kaspersky TAA (IOA) rules from scanning. Users with the Security officer or Security auditor roles can use TAA (IOA) rules to search for signs of targeted attacks, infected and possibly infected objects in the database of events and alerts, and to view the TAA (IOA) rule table and TAA (IOA) rule information.
Viewing the TAA (IOA) rule table
If you are using the distributed solution and multitenancy mode, use the web interface of the PCN or SCN server for which you want to configure parameters.
The table of user-defined TAA (IOA) rules contains information about TAA (IOA) rules that are used to scan events and create alerts; the table is in the Custom rules section, TAA subsection of the application web interface window.
The table contains the following information:
- —Importance level that is assigned to an alert generated using this TAA (IOA) rule.
The importance level can have one of the following values:
- – Low.
- – Medium.
- – High.
- Type is the type of the rule depending on the operating mode of the application and the role of the server which generated the rule:
- Global—Created on the PCN server. These rules are used to scan events on this PCN server and all SCN servers connected to this PCN server. Scanned events belong to the tenant which the user is managing in the application web interface.
- Local—Created on the SCN server. These rules are used to scan events on this SCN server. Scanned events belong to the tenant which the user is managing in the application web interface.
- Confidence – level of confidence depending on the likelihood of false alarms caused by the rule:
- High.
- Medium.
- Low.
The higher the confidence, the lower the likelihood of false alarms.
- Name – name of the rule.
- Servers are names of servers with the PCN or SCN role to which the rule applies.
This column is displayed if you are using the distributed solution and multitenancy mode.
- Alerts – requirement to store information on alerts based on matching an event from the database with criteria of the rule.
- Enabled – a record is created for the event in the alerts table with Targeted Attack Analyzer (TAA) technology specified.
- Disabled – not displayed in the alert table.
- State – usage status of the rule in event scans:
- Enabled – the rule is being used.
- Disabled – the rule is not being used.
Creating a TAA (IOA) rule based on event search conditions
To create a TAA (IOA) rule based on event search conditions:
- Select the Threat Hunting section in the application web interface window.
This opens the event search form.
- Perform an event search in builder mode or source code mode.
- Click Save as TAA (IOA) rule.
This opens the New TAA (IOA) rule window.
- In the Name field, type the name of the rule.
- Click Save.
The event search condition will be saved. In the TAA (IOA) rule table in the Custom rules section, TAA subsection of the web interface, the new rule is displayed with the specified name.
If you want to save event search conditions as a user-defined TAA (IOA) rule, avoid using the following fields:
- IOAId.
- IOATag.
- IOATechnique.
- IOATactics.
- IOAImportance.
- IOAConfidence.
At the time of saving the user-defined TAA (IOA) rule, the application may not have any events containing data for these fields. When events with this data turn up, the user-defined field that you have created earlier will be unable to mark events by these fields.
Users with the Security auditor and Security officer roles cannot create TAA (IOA) rules based on event search conditions.
Importing TAA (IOA) rules
You can import TAA (IOA) rules from an IOC file or a YAML file with a Sigma rule and use these to scan events and generate Targeted Attack Analyzer alerts.
To import a TAA (IOA) rule:
- In the window of the application web interface, select the Custom rules section, TAA subsection.
This opens the TAA (IOA) rule table.
- Click Import.
This opens the file selection window on your local computer.
- Select the file that you want to upload and click Open.
This opens the New TAA (IOA) rule window.
- Set the State toggle switch to Enabled if you want to enable the rule for scanning the event database.
- On the Details tab, in the Name field, enter the name of the rule.
- In the Description field, enter any additional information about the rule.
- In the Importance drop-down list, select the importance level to be assigned to alerts generated using this TAA (IOA) rule.
- Low.
- Medium.
- High.
- In the Confidence drop-down list, select the level of confidence of this rule based on your estimate:
- Low.
- Medium.
- High.
- Under Apply to, select check boxes corresponding to servers on which you want to apply the rule.
- On the Query tab, verify the defined search conditions. Make changes if necessary.
- Click Save.
The user-defined TAA (IOA) rule is imported into the application.
You can also add a TAA (IOA) rule by saving events database search conditions in the Threat Hunting section.
Viewing custom TAA (IOA) rule details
To display information about the TAA (IOA) rule:
- In the window of the application web interface, select the Custom rules section, TAA subsection.
This opens the TAA (IOA) rule table.
- Select the rule for which you want to view information.
This opens a window containing information about the rule.
The window contains the following information:
- Click the Alerts link to display the alert table in a new browser tab. The alerts are filtered by the Targeted Attack Analyzer technology and the name of the TAA (IOA) rule that you are working on.
- Click the Find events link to display the events table in a new browser tab. The table is filtered by rule name.
- Click the Run query link to display the events table in a new browser tab. The table is filtered by rule name. The event search conditions are populated with information from the TAA (IOA) rule that you are working on. For example,
EventType=Process started AND FileName CONTAINS <name of the rule you are working on>. You can edit the event search query. - Click the IOA ID link to display the ID that the application assigns to each rule.
IDs cannot be modified. You can copy the ID by clicking the Copy value to clipboard button.
- State – use of the rule in events database scans.
The Details tab shows the following information:
- Name is the name of the rule that you specified when you added the rule.
- Description is any additional information about the rule that you specified.
- Importance is an estimate of the probable impact of the event on the security of computers or the corporate LAN as specified by the user when the rule was added.
- Confidence is the level of confidence depending on the likelihood of false alarms as defined by the user when the rule was added.
- Type is the type of the rule depending on the role of the server which generated it:
- Global—Created on the PCN server. These rules are used to scan events on this PCN server and all SCN servers connected to this PCN server. Scanned events belong to the tenant which the user is managing in the application web interface.
- Local—Created on the SCN server. These rules are used to scan events on this SCN server. Scanned events belong to the tenant which the user is managing in the application web interface.
- Apply to – name of servers with the Central Node component on which the rule is applied.
The Query tab displays the source code of the query being checked. Click the Run query link in the upper part of the window to go to the Threat Hunting section and run an event search query.
Searching for alerts and events in which TAA (IOA) rules were triggered
To search and display alerts and events that were created by a user-defined TAA (IOA) rule triggering:
- In the window of the application web interface, select the Custom rules section, TAA subsection.
This opens the TAA (IOA) rule table.
- Select the rule for which you want to view the triggering result.
This opens a window containing information about the rule.
- Do one of the following:
- If you want to view alerts generated by the TAA (IOA) rule triggering, click Alerts to go to the alerts database.
The alert table is opened in a new browser tab.
- If you want to view events generated by the TAA (IOA) rule triggering, click Events to go to the events database.
The event table is opened in a new browser tab.
- If you want to view alerts generated by the TAA (IOA) rule triggering, click Alerts to go to the alerts database.
To search and display alerts and events that were created by a user-defined TAA (IOA) rule triggering:
To search and display alerts and events that were created by a Kaspersky TAA (IOA) rule triggering:
- Select the Alerts section in the window of the application web interface.
This opens the table of alerts.
- Click the link in the Technologies column to open the filter configuration window.
- In the drop-down list on the left, select Contain.
- In the drop-down list on the right, select the (TAA) Targeted Attack Analyzer technology.
- Click Apply.
The table displays alerts generated by the TAA technology based on TAA (IOA) rules.
- Select an alert for which the Detected column displays the name of the relevant rule.
This opens a window containing information about the alert.
- Under Scan results, click the link with the name of the rule to open the rule information window.
- Do one of the following:
- If you want to view alerts generated by the TAA (IOA) rule triggering, click Alerts to go to the alerts database.
The alert table is opened in a new browser tab.
- If you want to view events generated by the TAA (IOA) rule triggering, click Events to go to the events database.
The event table is opened in a new browser tab.
- If you want to view alerts generated by the TAA (IOA) rule triggering, click Alerts to go to the alerts database.
To search and display alerts and events that were created by a Kaspersky TAA (IOA) rule triggering:
Filtering and searching TAA (IOA) rules
To filter or search for TAA (IOA) rules by required criteria:
- In the window of the application web interface, select the Custom rules section, TAA subsection.
This opens the TAA (IOA) rule table.
- Depending on the filtering criterion, do the following:
- By importance
- Click the icon to open the IOA rule filter configuration window.
- Select the check boxes next to the importance levels that you want to include in the filter criteria:
- Low.
- Medium.
- High.
- Click Apply.
- Click the
- By rule type
- By confidence level
- By rule name
- By server name
- By rule-based alert generation
- By rule state
- By importance
The table displays only rules that match the specified criteria.
You can use multiple filters at the same time.
Resetting the TAA (IOA) rule filter
To clear a TAA (IOA) rule filter based on one or multiple filter conditions:
- In the window of the application web interface, select the Custom rules section, TAA subsection.
This opens the TAA (IOA) rule table.
- Click to the right of that column heading of the rule table for which you want to clear filtering criteria.
If you want to clear several filter conditions, perform the necessary actions to clear each filter condition.
The selected filters are cleared.
The table displays only rules that match the specified criteria.
Enabling and disabling TAA (IOA) rules
Users with the Senior security officer role can enable or disable one or several rules, as well as all rules at once.
To enable or disable the use of a TAA (IOA) rule when scanning events:
- In the window of the application web interface, select the Custom rules section, TAA subsection.
This opens the TAA (IOA) rule table.
- In the row with the relevant rule, select or clear the check box in the State column.
The use of the rule when scanning events is enabled or disabled.
To enable or disable the use of all or multiple TAA (IOA) rules when scanning events:
- In the window of the application web interface, select the Custom rules section, TAA subsection.
This opens the TAA (IOA) rule table.
- Select the check boxes on the left of the rules whose use you want to enable or disable.
You can select all rules by selecting the check box in the row containing the headers of columns.
A control panel appears in the lower part of the window.
- Click Enable or Disable to enable or disable all rules.
The use of the selected rules when scanning events is enabled or disabled.
In distributed solution and multitenancy mode, you can manage only global TAA (IOA) rules on the PCN server. You can manage local TAA (IOA) rules on SCN servers of tenants to which you have access.
Users with the Security auditor and Security officer roles cannot enable or disable TAA (IOA) rules.
Modifying a TAA (IOA) rule
Users with the Senior security officer role can modify custom TAA (IOA) rules. Rules created by Kaspersky cannot be edited.
In distributed solution and multitenancy mode, you can edit only those TAA (IOA) rules that were created on the current server. Consequently, in the web interface of the PCN, you can edit only the rules that were created on the PCN. In the web interface of an SCN, you can edit only the rules that were created on the SCN.
To edit a TAA (IOA) rule:
- In the window of the application web interface, select the Custom rules section, TAA subsection.
This opens the TAA (IOA) rule table.
- Select the rule that you want to modify.
This opens a window containing information about the rule.
- Make the relevant changes.
- Click Save.
The rule settings are modified.
Users with the Security auditor and Security officer roles cannot modify TAA (IOA) rules based on event search conditions.
Deleting TAA (IOA) rules
Users with the Senior security officer role can delete one or more TAA (IOA) rules, or all rules at the same time.
In distributed solution and multitenancy mode, you can delete only those TAA (IOA) rules that were created on the current server. Consequently, in the web interface of the PCN, you can delete only the rules that were created on the PCN. In the web interface of an SCN, you can delete only the rules that were created on the SCN.
To delete a custom TAA (IOA) rule:
- In the window of the application web interface, select the Custom rules section, TAA subsection.
This opens the TAA (IOA) rule table.
- Select the rule that you want to delete.
This opens a window containing information about the rule.
- Click Delete.
This opens the action confirmation window.
- Click Yes.
The rule is deleted.
To delete all or multiple custom TAA (IOA) rules:
- In the window of the application web interface, select the Custom rules section, TAA subsection.
This opens the TAA (IOA) rule table.
- Select the check boxes on the left of the rules that you want to delete.
You can select all rules by selecting the check box in the row containing the headers of columns.
A control panel appears in the lower part of the window.
- Click Delete.
This opens the action confirmation window.
- Click Yes.
The selected rules will be deleted.
You cannot delete TAA (IOA) rules defined by Kaspersky. If you do not want to use a Kaspersky TAA (IOA) rule for scanning, add it to exclusions.
Users with the Security auditor and Security officer roles cannot modify TAA (IOA) rules based on event search conditions.
Managing user-defined IOC rules
You can use IOC files to search indicators of compromise in the event database and on computers with the Endpoint Agent component. For example, if you have received third-party information about a piece of malware currently spreading, you can:
- Create an IOC file with indicators of compromise for the malware and upload it to the web interface of Kaspersky Anti Targeted Attack Platform.
- Find events corresponding to the criteria of the selected IOC file.
You can view such events, and if you want Kaspersky Anti Targeted Attack Platform to generate alerts for the selected events, you can create a TAA (IOA) rule.
- Enable automatic use of the selected IOC file to search indicators of compromise on computers with the Endpoint Agent component.
- If while scanning the computers, the Endpoint Agent component detects indicators of compromise, Kaspersky Anti Targeted Attack Platform generates an alert.
You can find these alerts in the table of alerts by filtering by technology name.
- Configure the schedule for searching for indicators of compromise using IOC files on computers with the Endpoint Agent component.
In distributed solution and multitenancy mode, IOC files can have the following types:
- Local—IOC files uploaded to an SCN server. These IOC files are used to search for indicators of compromise on Kaspersky Endpoint Agent hosts connected to the SCN server.
- Global—IOC files uploaded to the PCN server. These IOC files are used to search for indicators of compromise on Kaspersky Endpoint Agent hosts connected to the PCN server and all SCN servers connected to the PCN server.
An IOC file is a text file saved with the .ioc extension. When creating the IOC file, review the list of IOC terms supported by the application that you are using in the Endpoint Agent role. You can view the list of supported IOC terms by downloading the files from the links below.
![]() Kaspersky Endpoint Agent for Windows and Kaspersky Endpoint Security for Windows
Kaspersky Endpoint Agent for Windows and Kaspersky Endpoint Security for Windows
![]() Kaspersky Endpoint Security 12 for Linux
Kaspersky Endpoint Security 12 for Linux
Kaspersky Endpoint Security 11.4 for Linux and Kaspersky Endpoint Security for Mac do not support IOC files.
Example of an IOC file for finding a file by its hash
Each IOC file can contain only one rule. The rule can be of any complexity.
Users with the Senior security officer role can import, delete, download IOC files to their computer, enable or disable the search of indicators of compromise using IOC files, as well as configure the schedule for searching indicators of compromise on computers with the Endpoint Agent component.
Users with the Security officer and Security auditor roles can view the list of IOC files and information about the selected file, and export IOC files to their computer.
Viewing the table of IOC files
If you are using the distributed solution and multitenancy mode, use the web interface of the PCN or SCN server for which you want to configure parameters.
The table of IOC files contains information about IOC files used for scanning on computers with the Endpoint Agent component installed; you can find the table in the Custom rules section, IOC subsection of the application web interface window.
The table of IOC files contains the following information:
- —Importance level that will be assigned to an alert generated using this IOC file.
The importance level can have one of the following values:
- — Low importance.
- — Medium importance.
- — High importance.
- Type—Type of IOC file depending on the application operating mode and the server to which the IOC file was uploaded:
- Local—IOC files uploaded to an SCN server. These IOC files are used to search for indicators of compromise on hosts with the Endpoint Agent component connected to the SCN server.
- Global—IOC files uploaded to the PCN server. These IOC files are used to search for indicators of compromise on hosts with the Endpoint Agent component connected to the PCN server and all SCN servers connected to the PCN server.
- Name—Name of the IOC file.
- Servers are names of servers with the PCN or SCN role to which the rule applies.
This column is displayed if you are using the distributed solution and multitenancy mode.
- Autoscan—The IOC file is used when automatically scanning hosts with the Endpoint Agent component.
Host scanning using this IOC file can have one of the following statuses:
- Enabled
- Disabled
Viewing information about an IOC file
To view IOC file details:
- In the window of the application web interface, select the Custom rules section, IOC subsection.
This opens the table of IOC files.
- Select the IOC file for which you want to view information.
This opens a window containing information about the IOC file.
The window contains the following information:
- Clicking the Find alerts link opens the Alerts section with the filter condition populated with the name of your selected IOC file.
- Clicking the Find events link opens the Threat Hunting section with the search condition populated with indicators of compromise of your selected IOC file.
- Clicking the Download link opens the IOC file download window.
- Autoscan—The IOC file is used when automatically scanning hosts with the Endpoint Agent component.
- Name—Name of the IOC file.
- Importance—Importance level that must be assigned to an alert generated using this IOC file.
The importance level can have one of the following values:
- — Low importance.
- — Medium importance.
- — High importance.
- Apply to—Displays the name of the tenant and the names of servers associated with events scanned based on this IOC file (in distributed solution and multitenancy mode).
- XML—Displays the IOC file contents in XML format.
Uploading an IOC file
IOC files having UserItem properties for domain users are not supported.
To upload an IOC file:
- In the window of the program web interface, select the Custom rules section, IOC subsection.
This opens the table of IOC files.
- Click Import.
This opens the file selection window on your local computer.
- Select the file that you want to upload and click Open.
- Specify the following parameters:
- Autoscan—The IOC file is used when automatically scanning hosts with the Endpoint Agent component:
- Enabled
- Disabled
- Name—Name of the IOC file.
- Importance—Importance level that must be assigned to an alert generated using this IOC file:
- Low.
- Medium.
- High.
- Apply to—Name of the tenant and names of the servers which you want to scan using this IOC file (in distributed solution and multitenancy mode).
- Autoscan—The IOC file is used when automatically scanning hosts with the Endpoint Agent component:
- Click Save.
The IOC file will be uploaded in XML format.
Downloading an IOC file to a computer
You can download a previously uploaded IOC file to a computer.
To download an IOC file:
- In the window of the program web interface, select the Custom rules section, IOC subsection.
This opens the table of IOC files.
- Select the IOC file that you want to download.
This opens a window containing information about the IOC file.
- Depending on your browser settings, click the Download link to save the file to the default folder or specify a folder in which to save the file.
The IOC file is saved to your computer in the browser's downloads folder.
Enabling and disabling the automatic use of an IOC file when scanning hosts
You can enable or disable the automatic use of an IOC file for searching for indicators of compromise on hosts with the Endpoint Agent component.
To enable or disable the automatic use of an IOC file for searching for indicators of compromise on hosts with the Endpoint Agent component:
- In the window of the program web interface, select the Custom rules section, IOC subsection.
This opens the table of IOC files.
- In the row containing the IOC file whose use you want to enable or disable, in the State column, set the toggle switch to one of the following positions:
- Enabled
- Disabled
Automatic use of an IOC file for searching for indicators of compromise on hosts with the Endpoint Agent component is enabled or disabled.
Users with the Security auditor and Security officer roles cannot enable or disable automatic application of an IOC file.
Deleting an IOC file
To delete an IOC file:
- In the window of the program web interface, select the Custom rules section, IOC subsection.
This opens the table of IOC files.
- Select the IOC file that you want to delete.
This opens a window containing information about the IOC file.
- Click Delete.
The IOC file will be deleted.
Users with the Security auditor and Security officer roles cannot delete IOC files.
Searching for alerts in IOC scan results
To find and view scan results for the selected IOC file:
- In the window of the program web interface, select the Custom rules section, IOC subsection.
This opens the table of IOC files.
- Select the IOC file for which you want to view scan results.
This opens a window containing information about the IOC file.
- Go to the alert database by clicking Find alerts.
The alert table is opened in a new browser tab.
You can also view scan results for all IOC files by filtering alerts by technology name.
Searching for events using an IOC file
To view events found using an IOC file:
- In the window of the program web interface, select the Custom rules section, IOC subsection.
This opens the table of IOC files.
- Select the IOC file to use for searching for events in the event database.
This opens a window containing information about the IOC file.
- Go to the event database by clicking Find events.
The event table is opened in a new browser tab.
Filtering and searching IOC files
To filter or search for IOC files by required criteria:
- In the window of the program web interface, select the Custom rules section, IOC subsection.
- This opens the table of IOC files. Depending on the filtering criterion, do the following:
- By importance
- Click the icon to open the filter configuration window for IOC files.
- Select one or several of the following importance levels:
- Low.
- Medium.
- High.
- Click Apply.
- Click the
- By file name
- By the state of the automatic scan (enabled / disabled)
- By importance
The table of IOC files will display only IOC files that match the filter criteria you have set.
You can use multiple filters at the same time.
Clearing an IOC file filter
To clear the IOC file filter for one or more filtering criteria:
- In the window of the program web interface, select the Custom rules section, IOC subsection.
- This opens the IOC file table. Click to the right of the header of the IOC file table column for which you want to clear the filtering conditions.
If you want to clear several filter conditions, perform the necessary actions to clear each filter condition.
The selected filters are cleared.
The table of IOC files will display only IOC files that match the filter criteria you have set.
Configuring an IOC scan schedule
You can configure the schedule for searching for indicators of compromise using IOC files on hosts with the Endpoint Agent component.
Users with Security auditor and Security officer roles cannot configure the schedule for searching for indicators of compromise using IOC files.
To configure the schedule for searching for indicators of compromise using IOC files on hosts with the Endpoint Agent component:
- In the window of the application web interface, select the Settings section, Endpoint Agents subsection, IOC scanning schedule group of settings.
- In the Start time drop-down lists, select the start time of the indicator of compromise search. The time is specified in the time zone of the Central Node server on which you are performing the configuration.
If the Endpoint Agent gets the new scan schedule later than the time specified in the IOC scanning schedule, the next scan is initiated the next day at the specified time.
- In the Maximum scan duration drop-down list, select a time limit for completing the indicator of compromise search.
- Click Apply.
The new schedule for searching for indicators of compromise using IOC files on hosts with the Endpoint Agent component becomes active immediately after changes are saved. Results of the indicator of compromise search are displayed in the table of alerts.
Managing the search for indicators of compromise using IOC files is limited to the functionality provided by the web interface of Kaspersky Anti Targeted Attack Platform. No alternative ways of managing the search for indicators of compromise are provided.
If you are using Kaspersky Endpoint Security for Windows in the role of the Endpoint Agent component, make sure that the IOC files comply with the requirements. You must also take into account that when adding the RegistryItem data type to the IOC search scope, the application analyzes only certain registry keys.
For more details on the requirements for IOC files and the scanned registry keys, refer to the Online Help for Kaspersky Endpoint Security for Windows:
Managing user-defined Intrusion Detection rules
To detect intrusions in network traffic, you can use Intrusion Detection rules and additional Intrusion Detection methods that use built-in algorithms. When indicators of attacks are detected in traffic, Kaspersky Anti Targeted Attack Platform registers Intrusion Detection technology events.
A valid KATA or KATA + NDR license key is required to manage user-defined Intrusion Detection rules.
An Intrusion Detection rule describes a traffic anomaly that may signify an attack in the network. Rules contain conditions that the Intrusion Detection system uses to analyze traffic.
Intrusion Detection rules are applied if the Rule-based Intrusion Detection method is enabled. You can enable or disable the method.
You can use the following types of rule sets:
- System rule sets. These rule sets are supplied by Kaspersky and are designed to detect indicators of the most common attacks or unwanted network activity. System rule sets are available immediately after installing the application. You can update system rule sets by installing updates.
- User-defined rule sets. These are the rule sets that you upload yourself. The files you upload must contain data structures that define Intrusion Detection rules. Files that you want to upload must all be in the same directory, and they must have the .rules extension. The names of the custom rule sets match the names of the files from which the rule sets were uploaded.
User-defined Intrusion Detection rule sets are displayed in the Custom rules → Intrusion detection section.
The application supports up to 50,000 rules in total across all uploaded rule sets. You can upload up to 100 rule sets.
Rules loaded from user-defined rule sets may contain traffic analysis conditions that cause the application to register too many rule triggering events. In that case, you must keep in mind that registering too many events can impact the performance of the Intrusion Detection system.
Intrusion Detection rule sets can be enabled or disabled. Rules from an enabled rule set are applied when analyzing traffic if the Rule-based Intrusion Detection method is enabled. If a rule set is disabled, the rules in that rule set are not applied.
When a rule set is uploaded, the application checks the rules it contains. If any errors are found in the rules, the application blocks such rules and they are not applied. If errors are found in all rules of a rule set or the rule set does not contain any rules, the application disables such a rule set.
When conditions specified in a rule from an enabled set are detected in traffic, the application registers a rule triggering event. System event types are used for registration, which have the following codes:
- 4000003000 for an event involving a rule from the system rule set being triggered
- 4000003001 for an event involving a rule from a user-defined rule set being triggered
User-defined rule sets can contain rules obtained from other intrusion detection and prevention systems. When processing such rules, the application does not perform the specified actions that apply to network packets (for example, the drop and reject actions). When an intrusion detection rule triggers, Kaspersky Anti Targeted Attack Platform only registers an event.
The values of Kaspersky Anti Targeted Attack Platform event scores correspond to the priority values in the intrusion detection rules (see the table below).
Correspondence between rule priorities and event scores
Priority values in intrusion detection rules |
Kaspersky Anti Targeted Attack Platform event scores |
|---|---|
4 or more |
2.5 |
3 |
4.5 |
2 |
6.5 |
1 |
9 |
You can configure the settings for registering Intrusion Detection events under Settings → Event types.
You can view Intrusion Detection events in the table of registered events.
Users with the Senior security officer role can upload, enable, and disable user-defined Intrusion Detection rule sets. Users with the Security auditor role can view user-defined detection rule sets. Users with the Security officer role do not have access to user-defined intrusion detection rules.
Intrusion Detection rules
An Intrusion Detection rule describes a traffic anomaly that may signify an attack in the network. Rules contain conditions that the Intrusion Detection system uses to analyze traffic.
Intrusion Detection rules are applied if the Rule-based Intrusion Detection method is enabled. You can enable or disable the method.
You can use the following types of rule sets:
- System rule sets. These rule sets are supplied by Kaspersky and are designed to detect indicators of the most common attacks or unwanted network activity. System rule sets are available immediately after installing the application. You can update system rule sets by installing updates.
- User-defined rule sets. These are the rule sets that you upload yourself. The files you upload must contain data structures that define Intrusion Detection rules. Files that you want to upload must all be in the same directory, and they must have the .rules extension. The names of the custom rule sets match the names of the files from which the rule sets were uploaded.
The application supports up to 50,000 rules in total across all uploaded rule sets. You can upload up to 100 rule sets.
Rules loaded from user-defined rule sets may contain traffic analysis conditions that cause the application to register too many rule triggering events. In that case, you must keep in mind that registering too many events can impact the performance of the Intrusion Detection system.
Intrusion Detection rule sets can be enabled or disabled. Rules from an enabled rule set are applied when analyzing traffic if the Rule-based Intrusion Detection method is enabled. If a rule set is disabled, the rules in that rule set are not applied.
When a rule set is uploaded, the application checks the rules it contains. If any errors are found in the rules, the application blocks such rules and they are not applied. If errors are found in all rules of a rule set or the rule set does not contain any rules, the application disables such a rule set.
When conditions specified in a rule from an enabled set are detected in traffic, the application registers a rule triggering event. System event types are used for registration, which have the following codes:
- 4000003000 for an event involving a rule from the system rule set being triggered
- 4000003001 for an event involving a rule from a user-defined rule set being triggered
User-defined rule sets can contain rules obtained from other intrusion detection and prevention systems. When processing such rules, the application does not perform the specified actions that apply to network packets (for example, the drop and reject actions). When an intrusion detection rule triggers, Kaspersky Anti Targeted Attack Platform only registers an event.
The values of Kaspersky Anti Targeted Attack Platform event scores correspond to the priority values in the intrusion detection rules (see the table below).
Correspondence between rule priorities and event scores
Priority values in intrusion detection rules |
Kaspersky Anti Targeted Attack Platform event scores |
|---|---|
4 or more |
2.5 |
3 |
4.5 |
2 |
6.5 |
1 |
9 |
Additional Intrusion Detection methods
To detect intrusions, you can use the following additional methods:
- Detection of signs of falsified addresses in ARP packets (ARP spoofing).
If ARP spoofing detection is enabled, Kaspersky Anti Targeted Attack Platform checks the addresses specified in ARP packets and detects indicators of low-level man-in-the-middle (MITM) attacks. This type of attack in networks that use the ARP protocol is indicated by fake ARP messages being found in the traffic.
When indicators of ARP spoofing are detected, the application registers Intrusion Detection technology events. System event types are used for registration, which have the following codes:
- 4000004001 for an event involving the detection of multiple ARP responses that are not associated with ARP requests
- 4000004002 for an event involving the detection of multiple ARP requests from the same MAC address to different recipients.
- TCP Protocol Anomaly Detection.
If TCP Protocol Anomaly Detection is enabled, Kaspersky Anti Targeted Attack Platform scans TCP segments of the data stream in supported application layer protocols.
When Kaspersky Anti Targeted Attack Platform detects packets containing overlapping TCP segments with different content, it registers an Intrusion Detection technology event. Events are registered with system event type code 4000002701.
- IP Protocol Anomaly Detection.
If IP protocol anomaly detection is enabled, Kaspersky Anti Targeted Attack Platform scans fragmented IP packets.
When IP packet assembly errors are detected, the application registers Intrusion Detection technology events. System event types are used for registration, which have the following codes:
- 4000005100 for an event involving the detection of a data conflict during IP packet assembly (IP fragment overlapped)
- 4000005101 for an event involving the detection of an IP packet exceeding the maximum allowed size (IP fragment overrun)
- 4000005102 for an event involving the detection of an IP packet with the initial fragment smaller than expected (IP fragment too small)
- 4000005103 for an event involving the detection of mis-association of fragments of an IP packet (mis-associated fragments)
- Brute-force Attack and Scan Detection.
When Brute-force Attack and Scan Detection is enabled, Kaspersky Anti Targeted Attack Platform examines network activity statistics to detect indicators of brute force attacks, denial of service attacks, scanning, network service spoofing, and other anomalies.
This method uses built-in rules. When the rules are triggered, the application registers an Intrusion Detection technology event. Events are registered with system event type code 4000003002.
You can enable or disable methods. Additional Intrusion Detection methods can be applied regardless of whether Intrusion Detection rules exist or are enabled. Additional detection methods use built-in algorithms.
Page top
Enabling and disabling sets of Intrusion Detection rules
Intrusion Detection rule sets can be Enabled or Disabled. If a rule set is disabled, none of the rules in that rule set are used for intrusion detection.
When you enable or disable selected rule sets, the Intrusion Detection system is restarted on all computers that have application components (Central Node and Sensor) installed. A restart is necessary to apply the changes.
Only users with the Senior security officer role can change the status of Intrusion Detection rule sets.
To change the status of Intrusion Detection rule sets:
- In the window of the application web interface, select the Custom rules section, Intrusion detection subsection.
- Select the check boxes next to the rule sets whose status you want to change.
- Right-click to open the context menu.
- In the context menu, select one of the following commands:
- Enable if you want to enable all disabled sets of rules from among the selected rule sets.
- Disable if you want to disable all enabled sets of rules from among the selected rule sets.
- Change the statuses of selected rule sets if you want to invert the statuses of all selected rule sets. This option allows you to quickly enable and disable selected rule sets with different statuses on all computers with installed application components: to apply the changes, you only need one restart of the Intrusion Detection system on these computers.
- In the confirmation window, click OK.
The statuses of the intrusion detection rule sets are changed.
Page top
Loading and replacing user-defined sets of Intrusion Detection rules
You can upload Intrusion Detection rule sets from files into the application. To be uploaded to the application, files with Intrusion Detection rule descriptions must be located in the same folder and have the .rules extension. File names may not contain the following characters: \ / : * ? , " < > |
Intrusion Detection rules uploaded from a file are saved in the application as a user-defined rule set. The name of the rule set is the same as the name of the file from which the rule set was uploaded.
When rule sets are uploaded from files, current user-defined rule sets are deleted from the table and replaced with new rule sets.
Only users with the Senior security officer role can upload user-defined Intrusion Detection rule sets.
To upload and replace user-defined Intrusion Detection rule sets:
- In the window of the application web interface, select the Custom rules section, Intrusion detection subsection.
- In the toolbar, click the Replace all user-defined rules button.
- In the confirmation window, click OK.
This opens the file upload window.
- Select the folder that contains the files that you need and click the button to upload files from this folder.
The rule set table displays new user-defined rule sets. All rule sets without errors are enabled.
- Check the uploaded rule sets for errors.
Information about the detected errors is displayed in the Rules column. The OK status is displayed if there are no errors. If the rule set contains errors, you can view detailed information about them by clicking Details.
- If necessary, enable or disable the rule sets (including the rule sets that have the Errors in some rules status).
User-defined Intrusion Detection rule sets are uploaded.
Page top
Removing user-defined sets of Intrusion Detection rules
You can delete all user-defined Intrusion Detection rule sets that were uploaded into the application from files. Selecting which user-defined rule sets to delete is not possible. If you want to use only some of the current rule sets in the application, you can copy the files with these sets to a separate folder and replace all user-defined rule sets with rule sets from this folder.
Only users with the Senior security officer role can delete user-defined Intrusion Detection rule sets.
To delete user-defined Intrusion Detection rule sets:
- In the window of the application web interface, select the Custom rules section, Intrusion detection subsection.
- In the toolbar, click the Delete all user-defined rules button.
- In the confirmation window, click OK.
This opens a window for selecting the folder with Intrusion Detection rule files.
All user-defined Intrusion Detection rule sets are deleted from the table.
Page top
Managing user-defined YARA rules
You can use YARA rules as YARA module databases to scan files and objects received at the Central Node and to scan hosts with the Endpoint Agent component.
In distributed solution and multitenancy mode, custom YARA rules can have one of the following types:
- Global—Created on the PCN server. These rules are used to scan files and objects received at the PCN server and all SCN servers connected to that PCN server. Scanned files and objects belong to the tenant which the user is managing in the application web interface.
- Local—Created on the SCN server. These rules are used to scan files and objects received at the SCN server. Scanned files and objects belong to the tenant which the user is managing in the application web interface.
When managing the application web interface, users with the Senior security officer role can import a YARA rule file into Kaspersky Anti Targeted Attack Platform using the application web interface.
Users with the Security auditor and Security officer roles can only view YARA rules.
Viewing the YARA rule table
The table of user-defined YARA rules contains information about YARA rules that are used to scan files and objects and to create alerts; the table is displayed in the Custom rules section, YARA subsection of the application web interface window.
The table contains the following information:
- Created is the rule creation time.
- —Alert importance for the Kaspersky Anti Targeted Attack Platform user depending on the impact this alert may have on computer or corporate LAN security based on Kaspersky experience.
By default, alerts generated as a result of scanning by uploaded YARA rules are assigned a high importance.
- Type is the type of the rule depending on the operating mode of the application and the role of the server which generated the rule:
- Global—Created on the PCN server. These rules are used to scan files and objects received at the PCN server and all SCN servers connected to that PCN server. Scanned files and objects belong to the tenant which the user is managing in the application web interface.
- Local—Created on the SCN server. These rules are used to scan files and objects received at the SCN server. Scanned files and objects belong to the tenant which the user is managing in the application web interface.
- Name – name of the rule.
- File name is the name of the file from which the rule was imported.
- Created by is the name of the user whose account was used to import the rule.
- Servers is the name of the server with the PCN or SCN role to which the rule applies.
This column is displayed if you are using the distributed solution and multitenancy mode.
- Traffic scanning is the usage status of the rule when stream scanning files and objects arriving at the Central Node:
- Enabled – the rule is being used.
- Disabled – the rule is not being used.
Configuring YARA rule table display
You can show or hide columns and change the order of columns in the table.
To configure the table display:
- In the window of the application web interface, select the Custom rules section, YARA subsection.
This opens the YARA rule table.
- In the heading part of the table, click .
This opens the Customize table window.
- If you want to show a column in the table, select the check box next to the name of the parameter that you want displayed in the table.
If you want to hide a parameter in the table, clear the check box.
At least one check box must be selected.
- If you want to change the order of columns in the table, move the mouse cursor to the row with the relevant parameter, click and move the row to its new place.
- If you want to restore default table display settings, click Default.
- Click Apply.
The table display is configured.
Page top
Importing YARA rules
To import YARA rules:
- In the window of the program web interface, select the Custom rules section, YARA subsection.
- Click Upload.
This opens the file selection window.
- Select the YARA rule file that you want to upload and click Open.
This closes the file selection window and opens the Import YARA rules window.
The maximum allowed size of an uploaded file is 20 MB.
A report is displayed in the lower part of the window. The report contains the following information:
- The number of rules that can be successfully imported.
- The number of rules that will not be imported (if any).
For each rule that cannot be imported, its name is listed.
- Select the Traffic scanning check box if you want to use imported rules for streaming scans of objects and data received at the Central Node.
- If necessary, enter any additional information in the Description field.
The Importance field cannot be edited. By default, alerts generated by uploaded YARA rules are assigned a high level of importance.
- Under Apply to, select check boxes corresponding to servers on which you want to apply the rules.
This field is displayed only when you are using the distributed solution and multitenancy mode.
- Click Save.
Imported rules are displayed in the table of YARA rules.
Viewing YARA rule details
To view YARA rule details:
- In the window of the application web interface, select the Custom rules section, YARA subsection.
This opens the YARA rule table.
- Select the rule for which you want to view information.
This opens a window containing information about the rule.
The window contains the following information:
- Click the Alerts link to display the alert table in a new browser tab. The alerts are filtered by the Targeted Attack Analyzer technology and the name of the TAA (IOA) rule that you are working on.
- The Start YARA scan link opens the task creation window.
- The Download link lets you download a file with YARA rules.
- Rule name is the name of the rule specified in the file.
- Traffic scanning is the usage status of the rule when stream scanning files and objects arriving at the Central Node:
- Type is the type of the rule depending on the role of the server which generated it:
- Global—Created on the PCN server. These rules are used to scan files and objects received at the PCN server and all SCN servers connected to that PCN server. Scanned files and objects belong to the tenant which the user is managing in the application web interface.
- Local—Created on the SCN server. These rules are used to scan files and objects received at the SCN server. Scanned files and objects belong to the tenant which the user is managing in the application web interface.
- Importance is the importance level assigned to the alert created as a result of scanning by this rule.
By default, alerts generated as a result of scanning by uploaded YARA rules are assigned a high importance.
- Description is any additional information about the rule that you specified.
- Apply to – name of servers with the Central Node component on which the rule is applied.
Filtering and searching YARA rules
To filter or search for YARA rules by required criteria:
- In the window of the application web interface, select the Custom rules section, YARA subsection.
This opens the YARA rule table.
- Depending on the filtering criterion, do the following:
The table displays only rules that match the specified criteria.
You can use multiple filters at the same time.
Clearing a YARA rule filter
To clear the YARA rule filter for one or more filtering criteria:
- In the window of the application web interface, select the Custom rules section, YARA subsection.
This opens the YARA rule table.
- Click to the right of that column heading of the rule table for which you want to clear filtering criteria.
If you want to clear multiple filter conditions, take steps to clear each filter condition individually.
The selected filters are cleared.
The table displays only rules that match the specified criteria.
Enabling and disabling YARA rules
Users with the Senior security officer role can enable or disable one or several rules, as well as all rules at once.
When working in distributed solution and multitenancy mode, you can enable or disable only those YARA rules that were created on the current server. It means that in the web interface of the PCN, you can enable or disable only the rules that were created on the PCN server. In the web interface of an SCN, you can enable or disable only the rules that were created on the SCN server.
If YARA rules with identical names are enabled on the PCN and SCN servers, the PCN rule takes precedence over the SCN rule when scanning files and objects.
To enable or disable a YARA rule for stream scanning files and objects arriving at the Central Node:
- In the window of the application web interface, select the Custom rules section, YARA subsection.
This opens the YARA rule table.
- In the row with the relevant rule, select or clear the check box in the Traffic scanning column.
The rule is enabled or disabled for stream scanning files and objects arriving at the Central Node.
To enable or disable all or multiple YARA rules for stream scanning files and objects arriving at the Central Node:
- In the window of the program web interface, select the Custom rules section, YARA subsection.
- Select the check boxes on the left of the rules whose use you want to enable or disable.
You can select all rules by selecting the check box in the row containing the headers of columns.
A control panel appears in the lower part of the window.
- Click Enable or Disable to enable or disable all rules.
Selected rules are enabled or disabled for stream scanning files and objects arriving at the Central Node.
Deleting YARA rules
To delete a YARA rule:
- In the window of the application web interface, select the Custom rules section, YARA subsection.
This opens the YARA rule table.
- Select the rule that you want to delete.
This opens a window containing information about the rule.
- Click Delete.
- This opens the action confirmation window; in that window, click Yes.
The rule is deleted.
To delete all or multiple YARA rules:
- In the window of the application web interface, select the Custom rules section, YARA subsection.
This opens the YARA rule table.
- Select the check boxes on the left of the rules that you want to delete.
You can select all rules by selecting the check box in the row containing the headers of columns.
A control panel appears in the lower part of the window.
- Click Delete.
- This opens the action confirmation window; in that window, click Yes.
The selected rules will be deleted.
Users with the Security auditor and Security officer roles cannot delete YARA rules.
Managing objects in Storage and quarantine
Storage is used for storing files that must be sent for scanning as well as files obtained as a result of running tasks: Get file, Restore file from quarantine, Get forensics, Get NTFS metafiles, Get registry key, Get process memory dump.
Storage is located on the Central Node server.
You can manage objects in Storage as follows: delete, download, upload, and send objects to be scanned, and filter lists of objects.
Kaspersky Anti Targeted Attack Platform displays the objects in Storage as a table of objects.
If you are using the distributed solution and multitenancy mode, Storage is located on PCN and SCN servers. The web interface of the PCN server displays information about Storage of all connected SCNs for those tenants to which the user has access.
Users with the Senior security officer role can place copies of objects into Storage using tasks or by uploading the object to Storage using the Kaspersky Anti Targeted Attack Platform web interface on the PCN or SCN server that is used for managing tenants to which the user has access.
Users with the Security officer role can only work with files received as part of tasks that the same user created on the PCN or SCN server which is used to manage tenants to which the user has access.
If you consider a file threatening, you can quarantine it on the computer with the Endpoint Agent component. Metadata of the quarantined file are displayed in the Storage section, Quarantine subsection of the Kaspersky Anti Targeted Attack Platform web interface.
Quarantine on a Kaspersky Anti Targeted Attack Platform server is an area of Storage of the server part of the Kaspersky Anti Targeted Attack Platform solution, which is used for storing metadata of objects quarantined on Endpoint Agent computer, in the Storage section, Quarantine subsection of the web interface of Kaspersky Anti Targeted Attack Platform.
You can manage quarantined objects: restore objects from quarantine and upload copies of objects quarantined on Endpoint Agent computers to Storage of Kaspersky Anti Targeted Attack Platform.
Kaspersky Anti Targeted Attack Platform displays the information about quarantined objects as a table.
The maximum capacity of Storage is determined when configuring the sizing of the application. As soon as this threshold value is exceeded, the application starts to remove the oldest copies of objects from Storage. When the amount of occupied space is again below the threshold value, the application stops removing copies of objects from Storage.
The maximum size of an object that can be placed in Storage is 1 GB.
The actual size of the object can be greater than the apparent size of the object due to the metadata required to restore the object from quarantine. When an object is quarantined, its actual size is considered. Encrypted files may be sent in decrypted form (depending on encryption settings), compressed files are sent as-is.
Viewing the table of objects that were placed in Storage
The table of objects placed in Storage is in the Storage section, Files subsection of the application web interface window.
The table of objects placed in Storage contains the following information:
- Type is the method by which the object was placed in Storage.
The following methods are possible:
 — The object was placed in Storage in one of the following ways:
- The Get file task was run.
- A copy was received of an object that was quarantined on hosts with the Endpoint Agent component (in the Storage section, Quarantine subsection, Get file from quarantine action was selected in the menu for the link with the directory of the object).
 — The object was placed in Storage in one of the following ways:
- The Get forensics task was run.
- The Get process memory dump task was run.
- The Get registry key task was run.
- The Get NTFS metafiles task was run.
 — The object was manually downloaded by the user in the Storage section, Files subsection.
- Object—Information about the object. For example, the file name or file path.
- Scan results—Object scan result.
The scan result is displayed as one of the following values:
- Not detected—As a result of a scan, the application did not detect signs of a targeted attack, probably infected objects, or suspicious activity.
- Error—Object scan ended with an error.
- In process—Object scan has not yet completed.
- Not scanned—Object was not sent to be scanned.
- Detected—As a result of a scan, the application detected signs of a targeted attack, a probably infected object, or suspicious activity.
- Servers is the name of the server with the PCN or SCN role. The host from which the object was received is connected to this server.
This column is displayed if you are using the distributed solution and multitenancy mode.
- Source—IP address or name of the host from which the object was received, or the name of the user account that uploaded the object.
- Time stored—Date and time when the object was placed in Storage.
- Actions—Actions that can be performed with the object. The following actions are available:
 — delete an object from Storage.
 — send the object in Storage for scanning by the Anti-Malware Engine, YARA, and Sandbox technologies.
 — download the object from Storage to your computer.
Clicking the link with the file name or file path opens a list in which you can select one of the following actions:
- Filter by this value.
- Exclude from filter.
- Download.
- Send file for scanning.
- Find events:
- File path.
- MD5.
- SHA256.
- Find alerts:
- File path
- MD5.
- SHA256
- Copy value to clipboard.
Clicking the link with the host name opens a list in which you can select one of the following actions:
- Filter by this value.
- Exclude from filter.
- Find events.
- Find alerts.
- Copy value to clipboard.
Viewing information about an object manually placed in Storage using the web interface
To view information about an object manually placed in Storage:
- In the application web interface window, select the Storage section, Files subsection.
This opens the object table.
- In the table, select the object with the icon for which you want to view information.
This opens the object details window.
The window contains the following information:
- File name—Name of the file.
- Size—Size of the file.
- MD5—MD5 hash of a file.
- SHA256—SHA256 hash of a file.
- Time uploaded—Time of upload for objects that were manually uploaded by a user.
- User name—Name of the user account that manually uploaded the object to Storage.
- Scan results—Result of object scan by the application.
The Find on Kaspersky TIP button allows to find a file on the Kaspersky Threat Intelligence Portal.
Click Create prevention rule to prevent the file from running.
You can click Download to download the file to your computer's hard drive.
Clicking the link with the file name opens a list in which you can select one of the following actions:
- Find events.
- Find alerts.
- Copy value to clipboard.
Clicking the link with MD5 opens a list in which you can select one of the following actions:
- Find on Kaspersky TIP.
- Find events.
- Find alerts.
- Create prevention rule.
- Copy value to clipboard.
Clicking the link with SHA256 opens a list in which you can select one of the following actions:
- Find on Kaspersky TIP.
- Find on virustotal.com.
- Find events.
- Find alerts.
- Create prevention rule.
- Copy value to clipboard.
Viewing information about an object placed in Storage by a get file task
To view information about an object placed in Storage by a Get file or Get file from quarantine task:
- In the application web interface window, select the Storage section, Files subsection.
This opens the object table.
- In the table, select the object with the icon for which you want to view information.
This opens the object details window.
The window contains the following information:
- Recommendations group. The following recommendations can be displayed:
- Object—File name or path.
- Size—Size of the file.
- MD5—MD5 hash of a file.
- SHA256—SHA256 hash of a file.
- Time stored—Time when the object was placed in Storage.
- Tenant —Name of the tenant to which the Central Node, PCN, or SCN server belongs.
- Server—Name of the Central Node, PCN, or SCN server. The host from which the object was received is connected to this server.
- Host—Name of the host from which the object was received.
- Scan results—Result of object scan by the application.
Clicking Sandbox detection displays detailed information about the results of the file behavior analysis.
The Find on Kaspersky TIP button allows to find a file on the Kaspersky Threat Intelligence Portal.
Click Create prevention rule to prevent the file from running.
You can click Download to download the file to your computer's hard drive.
Clicking the link with the file name opens a list in which you can select one of the following actions:
- Find events.
- Find alerts.
- Copy value to clipboard.
Clicking the link with MD5 opens a list in which you can select one of the following actions:
- Find on Kaspersky TIP.
- Find events.
- Find alerts.
- Create prevention rule.
- Copy value to clipboard.
Clicking the link with SHA256 opens a list in which you can select one of the following actions:
- Find on Kaspersky TIP.
- Find on virustotal.com.
- Find events.
- Find alerts.
- Create prevention rule.
- Copy value to clipboard.
Viewing information about an object placed in Storage by a get data task
To view information about an object placed in Storage by Get forensics, Get process memory dump, Get registry key, Get NTFS metafiles tasks:
- In the application web interface window, select the Storage section, Files subsection.
This opens the object table.
- In the table, select the object with the icon for which you want to view information.
This opens the object details window.
The window contains the following information:
- Object is the file name or path.
- Size—Size of the file.
- MD5—MD5 hash of a file.
- SHA256—SHA256 hash of a file.
- Time stored—Time when the object was placed in Storage.
- Host—Name of the host from which the object was received.
You can click Download to download the file to your computer's hard drive.
Clicking the link with the file name opens a list in which you can select one of the following actions:
- Find events.
- Find alerts.
- Copy value to clipboard.
Clicking the link with MD5 opens a list in which you can select one of the following actions:
- Find on Kaspersky TIP.
- Find events.
- Find alerts.
- Create prevention rule.
- Copy value to clipboard.
Clicking the link with SHA256 opens a list in which you can select one of the following actions:
- Find on Kaspersky TIP.
- Find on virustotal.com.
- Find events.
- Find alerts.
- Create prevention rule.
- Copy value to clipboard.
Downloading objects from Storage
If you consider an object in Storage to be safe, you can download it to a local computer.
Downloading infected objects could pose a threat to the security of your local computer.
To download an object from Storage:
- In the application web interface window, select the Storage section, Files subsection.
This opens the object table.
- In the right part of the line with the name of the object that you want to download, click .
The object will be saved to your local computer in the browser's downloads folder. The file is downloaded as a ZIP archive protected with the password "infected".
Uploading objects to Storage
If you need to scan a specific object, you can upload this object to Storage and send it to be scanned.
To upload an object to Storage:
- In the application web interface window, select the Storage section, Files subsection.
This opens the object table.
- In the upper-right corner of the window, click Upload.
This opens the file selection window.
- Select the object that you want to upload to Storage.
- If you want to upload a file with the .Lnk extension to Storage:
- In the File name field, enter *.Lnk and press Enter.
- Select the object.
- Click Open.
The object is uploaded to Storage and displayed in the table of objects.
Users with the Security auditor role cannot upload objects to Storage.
Sending objects in Storage for scanning
You can scan Storage objects with the Central Node component using the Anti-Malware Engine and YARA technologies, and with the Sandbox component.
It is recommended to send objects from Storage to be scanned in the following cases:
- Scanning of objects when placed in Storage had been disabled.
- Application databases have been updated.
- An object was manually uploaded to Storage.
To send an object from Storage for scanning:
- In the application web interface window, select the Storage section, Files subsection.
This opens the object table.
- Click the object that you want to scan.
This opens the object details window.
- Click Scan.
The object scan will start.
After the object scan is complete, its status will be displayed in the object table.
You can also send an object in Storage for scanning by clicking ![]() in the right part of the object information row in the table of objects placed in Storage.
in the right part of the object information row in the table of objects placed in Storage.
Users with the Security auditor role cannot scan objects in Storage.
Deleting objects from Storage
To delete an object from Storage:
- In the application web interface window, select the Storage section, Files subsection.
This opens the object table.
- Click the object that you want to delete.
This opens the object details window.
- Click Delete.
This opens the action confirmation window.
- Click Yes.
The object will be deleted from Storage.
You can also delete an object in Storage by clicking ![]() in the right part of the object information row in the table of objects placed in Storage.
in the right part of the object information row in the table of objects placed in Storage.
To delete all or multiple objects from Storage:
- In the application web interface window, select the Storage section, Files subsection.
This opens the object table.
- Select check boxes next to objects that you want to delete from Storage.
You can select all objects by selecting the check box in the row containing the headers of columns.
- In the pane that appears in the lower part of the window, click Delete.
This opens the action confirmation window.
- Click Yes.
The selected objects are removed from Storage.
Users with the Security auditor role cannot delete objects in Storage.
Filtering objects in Storage by object type
To filter objects in Storage by type:
- In the application web interface window, select the Storage section, Files subsection.
This opens the object table.
- Click the Type link to open the object filtering menu.
- Select one or more check boxes:
- Uploaded by a Get file task if you want the table to display objects that were placed in Storage by Get file and Restore file from quarantine tasks.
- Uploaded through the web interface if you want the table to display objects uploaded by the user using the Kaspersky Anti Targeted Attack Platform web interface.
- Uploaded by a get data task if you want the table to display objects placed in Storage by Get forensics, Get NTFS metafiles, Get registry key, Get process memory dump tasks.
- Click Apply.
The objects table will display only objects matching the filter criteria you have set.
You can use multiple filters at the same time.
Filtering objects in Storage by object description
To filter objects in Storage by object description:
- In the application web interface window, select the Storage section, Files subsection.
This opens the object table.
- Click the Object link to open the object filtering menu.
- In the drop-down list, select one of the following options:
- File path.
- MD5.
- SHA256.
- In the drop-down list, select one of the following object filtering operators:
- Contain
- Not contain
- Equal to
- Not equal to
- Matches
- Not matches
- In the entry field, specify one or several characters of the object description.
- To add a filter condition using a different criterion, click and specify the filter condition.
- Click Apply.
The objects table will display only objects matching the filter criteria you have set.
You can use multiple filters at the same time.
Filtering objects in Storage based on scan results
To filter objects in Storage by scan results for these objects:
- In the application web interface window, select the Storage section, Files subsection.
This opens the object table.
- Click the Scan results link to open the object filtering menu.
- Select one or more check boxes:
- Not detected.
- Error.
- In process.
- Not scanned.
- Detected.
- Click Apply.
The objects table will display only objects matching the filter criteria you have set.
You can use multiple filters at the same time.
Filtering objects in Storage based on the name of Central Node, PCN, or SCN server
To filter objects in Storage by the name of Central Node, PCN, or SCN server:
- In the application web interface window, select the Storage section, Files subsection.
This opens the object table.
- Click the Servers link to open the object filtering menu.
- Select one or multiple check boxes opposite those servers by which you want to filter objects in Storage.
- Click Apply.
The objects table will display only objects matching the filter criteria you have set.
You can use multiple filters at the same time.
Filtering objects in Storage by object source
To filter objects in Storage by the source from which they were received:
- In the application web interface window, select the Storage section, Files subsection.
This opens the object table.
- Click the Source link to open the object filtering menu.
- In the drop-down list, select one of the following object filtering operators:
- Contain
- Not contain
- In the entry field, specify one or several characters of the IP address, host name or name of the user account that manually uploaded the object.
- To add a filter condition using a different criterion, click and specify the filter condition.
- Click Apply.
The objects table will display only objects matching the filter criteria you have set.
You can use multiple filters at the same time.
Filtering objects based on the time they were placed in Storage
To filter objects by the time when they were placed in Storage:
- In the application web interface window, select the Storage section, Files subsection.
This opens the object table.
- Click the Time stored link to open the object filtering menu.
- Select one of the following object display periods:
- All if you want the table to display all objects that were placed in Storage.
- Last hour if you want the table to display objects that were placed in Storage during the last hour.
- Last day if you want the table to display objects that were placed in Storage during the last day.
- Custom range if you want the table to display objects that were placed in Storage during the period you specify.
- If you have selected the Custom range object display period:
- In the calendar that opens, specify the start and end dates of the object display period.
- Click Apply.
The objects table will display only objects matching the filter criteria you have set.
You can use multiple filters at the same time.
Clearing a Storage objects filter
To clear the Storage objects filter for one or more filtering criteria:
- In the application web interface window, select the Storage section, Files subsection.
This opens the object table.
- Click to the right of the header of the Storage objects table column for which you want to clear the filter conditions.
If you want to clear several filter conditions, perform the necessary actions to clear each filter condition.
The selected filters are cleared.
The objects table will display only objects matching the filter criteria you have set.
Viewing the table of objects quarantined on computers with the Kaspersky Endpoint Agent component
The table of objects quarantined on computers with the Endpoint Agent component can be found in the Storage section, Quarantine subsection of the application web interface.
The Kaspersky Anti Targeted Attack Platform server stores metadata of objects quarantined on computers with the Endpoint Agent component. The objects themselves are kept in special storage on each computer where the threatening object was detected.
The table of objects quarantined on computers with the Endpoint Agent component contains the following information:
- Object—Information about the object. For example, the file name or file path.
- Source—IP address or host name of the computers with the Endpoint Agent component where the object is quarantined.
- Time stored—Date and time when the object was quarantined.
- State—State of the object.
The right part of the object information row contains buttons:
- You can click to delete the metadata of the object on the Kaspersky Anti Targeted Attack Platform server.
- You can click
 to restore the object from quarantine on a computer with the Endpoint Agent component.
 - You can click
 to copy the object from quarantine on a computer with the Endpoint Agent component to the Kaspersky Anti Targeted Attack Platform server.
Clicking the link with the file name or file path opens a list in which you can select one of the following actions:
- Filter by this value.
- Exclude from filter.
- Download.
- Send file for scanning.
- Find events:
- File path.
- MD5.
- SHA256.
- Find alerts:
- File path
- MD5.
- SHA256
- Copy value to clipboard.
Clicking the link with the host name opens a list in which you can select one of the following actions:
- Filter by this value.
- Exclude from filter.
- Find events.
- Find alerts.
- Copy value to clipboard.
Viewing information about a quarantined object
To view information about an object quarantined on a computer with the Endpoint Agent component:
- In the application web interface window, select the Storage section, Quarantine subsection.
This opens the object table.
- In the table, select the object whose information you want to view.
This opens the object details window.
The window contains the following information:
- Recommendations group. The Task recommendation can be displayed, which is a link that opens the Tasks section; this is the task that has quarantined the object.
- Type is the type of the quarantined object.
The following types of objects are available:
- — file.
 — process memory dump.
- Object—File name or path.
- State is the state of the file (whether the file can be restored from quarantine).
- Source is the name of the computer with the Endpoint Agent component on which the object is quarantined.
- Recording time is the date and time when the object was quarantined.
- Actions is the state of the file (whether the file can be restored from quarantine).
The following actions are available:
- — delete the file from quarantine.
- — obtain a copy of the file on the Kaspersky Anti Targeted Attack Platform server.
Clicking the link with the file name or file path opens a list in which you can select one of the following actions:
- Find events.
- Find alerts.
- Copy value to clipboard.
Restoring an object from Quarantine
To restore the object from quarantine on a computer with the Endpoint Agent component:
- In the application web interface window, select the Storage section, Quarantine subsection.
This opens the object table.
- In the table, select the object that you want to restore from quarantine on the computer with the Endpoint Agent component.
This opens the object details window.
- Click Restore in the lower part of the window.
This opens the Tasks section and the Restore file from quarantine task.
- In the Description field, enter the task description.
- Click Add.
The file is restored from quarantine.
You can also run the task to restore the file from quarantine by clicking ![]() in the right part of the row with object information of the table of objects quarantined on computers with the Endpoint Agent component.
in the right part of the row with object information of the table of objects quarantined on computers with the Endpoint Agent component.
In distributed solution and multitenancy mode, a file that is quarantined on an SCN server cannot be restored on the PCN server. You can restore the file on the SCN server on which the quarantine file task was created.
Users with the Security auditor role cannot restore objects from quarantine.
Obtaining a copy of a quarantined object on a Kaspersky Anti Targeted Attack Platform server
The object that you want to download a copy of must not exceed 100 MB. If the object exceeds 100 MB, the task finishes with an error.
To copy an object quarantined on a computer with the Kaspersky Endpoint Agent component to a Kaspersky Anti Targeted Attack Platform server:
- In the application web interface window, select the Storage section, Quarantine subsection.
This opens the object table.
- In the table, select the object that you want to restore from quarantine on the computer with the Endpoint Agent component.
This opens the object details window.
- Click Get file in the lower part of the window.
This creates a task for getting a copy of an object that was quarantined on a computer with the Endpoint Agent component. If the task completes successfully, the copy of the object is uploaded to the Kaspersky Anti Targeted Attack Platform server. The object is displayed in the Storage section, Files subsection of the application web interface in the table of objects placed in Storage.
Information about the created task is displayed in the Tasks section of the web interface.
You can also copy an object from quarantine on a computer with the Endpoint Agent component to the Kaspersky Anti Targeted Attack Platform server by clicking ![]() in the right part of the object information row in the table of objects quarantined on computers with the Endpoint Agent component.
in the right part of the object information row in the table of objects quarantined on computers with the Endpoint Agent component.
Users with the Security auditor role cannot get copies of objects from quarantine.
Removing information about the quarantined object from the table
To delete the information of an object quarantined on a computer with the Kaspersky Endpoint Agent component from the Kaspersky Anti Targeted Attack Platform table:
- In the application web interface window, select the Storage section, Quarantine subsection.
This opens the object table.
- Click the object for which you want to delete information from the table.
This opens the object details window.
- Click Delete.
This opens the action confirmation window.
- Click Yes.
The information about the object quarantined on the computer with the Endpoint Agent component is deleted from the table.
You can also delete the information of an object quarantined on a computer with the Endpoint Agent component from the table by clicking ![]() in the right part of the object information row in the table of quarantined objects.
in the right part of the object information row in the table of quarantined objects.
Users with the Security auditor role cannot delete information about a quarantined object from the table.
Filtering information about quarantined objects by object type
To filter quarantined object details by object type:
- In the application web interface window, select the Storage section, Quarantine subsection.
This opens the object table.
- Click the Type link to open the object filtering menu.
- Select one or more check boxes:
- File if you want the table to display metadata of quarantined objects.
- Process memory dump if you want the table to display metadata of quarantined dumps.
- Click Apply.
The objects table will display only objects matching the filter criteria you have set.
You can use multiple filters at the same time.
Filtering information about quarantined objects by object description
To filter quarantined object details by object description:
- In the application web interface window, select the Storage section, Quarantine subsection.
This opens the object table.
- Click the Object link to open the object filtering menu.
- In the drop-down list, select one of the following object filtering operators:
- Contain
- Not contain
- In the entry field, specify one or several characters of the object description.
- To add a filter condition using a different criterion, click and specify the filter condition.
- Click Apply.
The objects table will display only objects matching the filter criteria you have set.
You can use multiple filters at the same time.
Filtering information about quarantined objects by host name
To filter quarantined object details by the name of the host where they were quarantined:
- In the application web interface window, select the Storage section, Quarantine subsection.
This opens the object table.
- Click the Source link to open the object filtering menu.
- In the drop-down list, select one of the following object filtering operators:
- Contain
- Not contain
- In the entry field, specify one or several characters of the host name.
- To add a filter condition using a different criterion, click and specify the filter condition.
- Click Apply.
The objects table will display only objects matching the filter criteria you have set.
You can use multiple filters at the same time.
Filtering information about quarantined objects by time
To filter quarantined object details by the time when the objects were quarantined:
- In the application web interface window, select the Storage section, Quarantine subsection.
This opens the object table.
- Click the Time stored link to open the object filtering menu.
- Select one of the following object display periods:
- All if you want the table to display all objects.
- Last hour if you want the table to display objects that were quarantined during the last hour.
- Last day if you want the table to display objects that were quarantined during the last day.
- Custom range if you want the table to display objects that were quarantined during the period you specify.
- If you have selected the Custom range object display period:
- In the calendar that opens, specify the start and end dates of the object display period.
- Click Apply.
The objects table will display only objects matching the filter criteria you have set.
You can use multiple filters at the same time.
Resetting the filter for information about quarantined objects
To clear the filter for one or more filtering criteria:
- In the application web interface window, select the Storage section, Quarantine subsection.
This opens the object table.
- Click to the right of the header of the column of the quarantined objects table for which you want to reset the filter conditions.
If you want to clear several filter conditions, perform the necessary actions to clear each filter condition.
The selected filters are cleared.
The objects table will display only objects matching the filter criteria you have set.
Managing reports
Users with the Senior security officer role can use Kaspersky Anti Targeted Attack Platform to manage reports about application alerts: create report templates, create reports based on a template, view, and delete reports and report templates.
Users with the Security auditor role can view reports and report templates and create reports from templates.
The following types of reports are available:
- General reports. Templates for these reports are available in the Reports section, Templates subsection. You can manage the generated reports in the Reports section, Generated reports subsection.
You can manage report templates and reports in all modes of the application in accordance with your license. Reports are generated based on a selection of alerts for a specified period. If you are using distributed solution and multitenancy mode, the selection can also be based on the tenant and this tenant's servers.
- NDR functionality reports. Available in the Reports section, Reports (NDR) subsection.
You can manage report templates and reports if you add a KATA + NDR license key. Reports are generated based on a selection of alerts for the specified period in accordance with the data of the node on which the report is generated.
Managing common reports
When managing the application web interface, users with the Senior security officer role can manage KATA reports about application alerts: create report templates, create reports based on a template, view, and delete reports and report templates.
Users with the Security auditor role can view KATA reports and report templates and create reports from templates.
To create a KATA report:
Viewing the table of templates and reports
Templates and reports are displayed in the Reports section of the application web interface window.
The Generated reports subsection contains a report table. The table contains the following information:
- Time created—Date and time of report creation.
- Report name—Name of the report created based on the template.
- Period—Period for which the report was generated.
- Servers is the name of the server with the PCN or SCN role to which the rule applies.
This column is displayed if you are using the distributed solution and multitenancy mode.
- Created by—Name of the user that created report.
- State—Report state (whether the file can be downloaded).
The Templates subsection displays the table of templates. The table contains the following information:
- Time created—Date and time when the template was created.
- Time updated—Date and time of last modification of the template.
- Report name—Name of the template.
- Created by—Name of the user that created the template.
Creating a template
When creating a report template, you need to specify all the information that you want to display in the report: report name, its description, availability of a table, graph or image. You can also select the data that you want to display in the report and define the position of report elements.
When creating a report in the Reports section, Generated reports subsection of the interface, you can only select the template for creating the report and the data display period.
A new report template is created for each data sample.
To create a template:
- In the application web interface window, select the Reports section, Templates tab.
This opens the table of templates.
- Click Add.
This opens the template creation window. This window contains the body of the report and the report builder in a floating window. You can move the report builder over the workspace of the web interface window.
- In the Template name field in the upper-right corner of the window, type the name that you want to assign to reports that are created from this template. For example, Alerts by technology.
This name is displayed in the table in the Reports section, Generated reports subsection when creating all reports in this template.
- In place of the Report title text, type the report name that will be displayed in a report after the report is created. If you do not want to add a report name, you can delete the Report title text and leave this report section blank.
You can format text using the buttons in the Text section in the template builder.
- In place of the Report description text, type the report description that will be displayed in a report after the report is created. If you do not want to add a report description, you can delete the Report description text and leave this report section blank.
You can format text using the buttons in the Text section in the template designer.
- Using the report builder, add one or more report elements:
- Table.
- Pie chart.
- Image.
- If you chose to add an image, the Image window opens. Do the following:
- Click Upload.
- Upload the image. For example, you can upload your company logo.
- In the list on the right of the upload button, select the alignment of the image on the report page: Left, Right or Center.
- Click Apply.
- If you chose to add a pie chart, the Pie chart of alert attributes window opens. Do the following:
- In the Name field, type the name of the pie chart. For example, Top 5 alerts by technology. You can also leave the field blank.
- In the Data source list, select the alert property for which you want to create a pie chart. For example, Technologies.
- In the Number of slices field, specify the maximum number of sectors of the pie chart.
When a report is created, the application selects the most frequently encountered data. For example, if you specified 5 sectors and want to create a pie chart by technology, the application displays a chart for the 5 technologies that generated the greatest number of alerts. Technologies that generated fewer alerts are not included in the chart.
- Click Apply.
- If you chose to add a table, the Alerts table window opens. Do the following:
- In the Available columns field, double-click to select the alert properties that you want to add to the report table.
The selected properties are moved to the Selected columns field. You can drag the names of columns between the Available columns and Selected columns fields, and change the order of columns in the report table.
For example, if you move the Technologies, Detected, and Time created properties to the Selected columns field, the table of the created report displays technologies that generated alerts, a list of detected objects, and the time when the alerts were generated.
- If you want to filter alerts by the State property, select the check boxes next to the processing statuses of alerts whose data you want to display in the report.
- If you want to filter alerts by the Technologies property, select the check boxes next to the names of application modules and components whose data you want to display in the report.
- If you want to filter alerts by the Importance property, select the check boxes next to the importance levels of alerts whose data you want to display in the report.
- If you want to filter alerts by the VIP status, select VIP in the list. Only alerts with the VIP status are displayed in the report.
- Click Apply.
- In the Available columns field, double-click to select the alert properties that you want to add to the report table.
- Click the Save button in the upper-right corner of the window.
A new template will be created.
Users with the Security auditor and Security officer roles cannot create report templates.
Creating a report based on a template
To create a report based on a template:
- In the window of the program web interface, select the Reports section, Generated reports subsection.
This opens the table of reports.
- Click Add.
This opens the New report window.
- Do the following:
- In the Template drop-down list, select one of the templates for creating a report.
- Under Period, select one of the following options:
- Last hour if you want the report to contain information about application operation during the last hour.
- Last day if you want the report to contain information about application operation during the last day.
- Last 7 days if you want the report to contain information about application operation during the last week.
- Last 30 days, if you want the report to contain information about system operation during the last month.
- Custom, if you want the report to contain information about system operation during the period you specify.
- If you have selected the Custom display period for information about application operation:
- In the calendar that opens, specify the start and end dates of the period for which the report will be generated.
- Click Apply.
- If you are using distributed solution and multitenancy mode, in the Servers settings group, select the check boxes next to the tenants and servers whose data you want to include in the report.
- Click Create.
The created report is displayed in the table of reports. You can download the report for viewing on your computer.
Users with the Security officer role cannot create report templates.
Viewing a report
To view a report:
- In the window of the program web interface, select the Reports section, Generated reports subsection.
This opens the table of reports.
- Select the report that you want to view.
The report opens in a new tab in your browser.
Downloading a report to a local computer
To download a report to your computer:
- In the window of the program web interface, select the Reports section, Generated reports subsection.
This opens the table of reports.
- In the line containing the report that you want to view, click the
 icon.
icon.The report is saved in HTML format to your local computer in the browser's downloads folder.
To view a report, you can use any application that lets you view HTML files (for example, a browser).
Editing a template
To edit a template:
- In the application web interface window, select the Reports section, Templates tab.
- This opens the table of templates. Select the template that you want to edit.
This opens the template editing window.
- You can edit the following settings:
- Template name is the report name that is displayed in the table in the Reports section, Generated reports subsection when creating all reports based on this template.
- Report title is the report name that is displayed in the report after the report is created.
You can format text using the buttons in the Text section in the template builder.
- Report description is the report description that is displayed in a report after the report is created.
You can format text using the buttons in the Text section in the template builder.
- Image. You can upload or delete an image.
- Pie chart. You can change the following pie chart settings:
- Name.
- Data source.
- Number of slices.
Click Apply.
- Table. You can change the following table settings:
- Selected columns. You can drag the names of columns between the Available columns and Selected columns fields, and change the order of columns in the report table.
- State.
- Technologies.
- Importance.
- VIP status.
- Select one of the following methods to save the template:
- If you want to apply changes to the current template, click the Save button.
The template is modified.
- If you want to create a new template, enter a name for the template and click Save as.
The name of the new template must not be the same as the name of an already existing template.
The new template will be saved.
- If you want to apply changes to the current template, click the Save button.
Users with the Security auditor and Security officer roles cannot edit templates.
Filtering templates by name
To filter templates by name:
- In the application web interface window, select the Reports section, Templates tab.
- This opens the table of templates. Click the Report name link to open the template filtering menu.
- In the drop-down list, select one of the following template filtering operators:
- Contain
- Not contain
- Enter one or several characters of the template name.
- If you want to add a filtering criterion to the filter, click the button under the list of filtering operators and repeat the sequence for specifying filtering criteria.
- Click Apply.
The table of templates will display only templates that match the filter criteria you have set.
Filtering templates based on the name of the user that created the template
To filter templates by the name of the user that created the template:
- In the application web interface window, select the Reports section, Templates tab.
- This opens the table of templates. Click the Created by link to open the menu for filtering templates.
- In the drop-down list, select one of the following template filtering operators:
- Contain
- Not contain
- Enter one or several characters of the user name.
- If you want to add a filtering criterion to the filter, click the button under the list of filtering operators and repeat the sequence for specifying filtering criteria.
- Click Apply.
The table of templates will display only templates that match the filter criteria you have set.
Filtering templates by creation time
To filter report templates by creation time:
- In the application web interface window, select the Reports section, Templates tab.
- This opens the table of templates. Click the Time created link to open the menu for filtering templates.
- Select one of the following template display periods:
- All if you want the application to display all created templates in the table.
- Last hour if you want the application to display the templates that were created during the last hour in the table.
- Last day if you want the application to display the templates that were created during the last day in the table.
- Custom range if you want the application to display templates that were created during the period you specify in the table.
- If you have selected the Custom range template display period:
- This opens the calendar; in the calendar, specify the start and end dates of the template display period.
- Click Apply.
The table of templates will display only templates that match the filter criteria you have set.
Clearing a template filter
To clear the template filter for one or more filtering criteria:
- In the application web interface window, select the Reports section, Templates tab.
- This opens the table of templates. Click to the right of the header of the column of the template table for which you want to clear the filter conditions.
If you want to clear several filter conditions, perform the necessary actions to clear each filter condition.
The selected filters are cleared.
The table of templates will display only templates that match the filter criteria you have set.
Deleting a template
To delete a template:
- In the application web interface window, select the Reports section, Templates tab.
- This opens the table of templates. Select the check box in the line containing the template that you want to delete.
- Click Delete.
This opens the action confirmation window.
- Click Yes.
The template that you selected will be deleted.
Users with the Security auditor and Security officer roles cannot delete templates.
Filtering reports by creation time
To filter reports by creation time:
- In the window of the program web interface, select the Reports section, Generated reports subsection.
This opens the table of reports.
- Click the Time created link to open the report filtering menu.
- Select one of the following report display periods:
- All if you want the application to display all created reports in the table.
- Last hour if you want the application to display the reports that were created during the last hour in the table.
- Last day if you want the application to display the reports that were created during the last day in the table.
- Custom range if you want the application to display reports that were created during the period you specify in the table.
- If you have selected the Custom range report display period:
- In the calendar that opens, specify the start and end dates of the report display period.
- Click Apply.
The table of reports will display only reports that match the filter criteria you have set.
Filtering reports by name
To filter reports by name:
- In the window of the program web interface, select the Reports section, Generated reports subsection.
This opens the table of reports.
- Click the Report name link to open the report filtering menu.
- In the drop-down list, select one of the following report filtering operators:
- Contain
- Not contain
- In the text box, enter one or more characters of the report name.
- If you want to add a filtering criterion to the filter, click the button under the list of filtering operators and repeat the sequence for specifying filtering criteria.
- Click Apply.
The table of reports will display only reports that match the filter criteria you have set.
Filtering reports by the name of the server with the Central Node component
To filter reports by the name of the server with the Central Node component:
- In the window of the program web interface, select the Reports section, Generated reports subsection.
This opens the table of reports.
- Click the Servers link to open the report filtering menu.
- Select the check boxes opposite those servers by which you want to filter reports.
- Click Apply.
The table of reports will display only reports that match the filter criteria you have set.
Filtering reports based on the name of the user that created the report
To filter reports by the name of the user that created the report:
- In the window of the program web interface, select the Reports section, Generated reports subsection.
This opens the table of reports.
- Click the Created by link to open the report filtering menu.
- In the drop-down list, select one of the following report filtering operators:
- Contain
- Not contain
- Enter one or several characters of the user name.
- If you want to add a filtering criterion to the filter, click the button under the list of filtering operators and repeat the sequence for specifying filtering criteria.
The table of reports will display only reports that match the filter criteria you have set.
Clearing a report filter
To clear the report filter for one or more filtering criteria:
- In the window of the program web interface, select the Reports section, Generated reports subsection.
This opens the table of reports.
- Click to the right of the header of the column of the reports table for which you want to clear the filter conditions.
If you want to clear several filter conditions, perform the necessary actions to clear each filter condition.
The selected filters are cleared.
The table of reports will display only reports that match the filter criteria you have set.
Deleting a report
To delete an application operation report:
- In the window of the program web interface, select the Reports section, Generated reports subsection.
This opens the table of reports.
- Select the check box in the line containing the report that you want to delete.
- Click Delete.
This opens the action confirmation window.
- Click Yes.
The selected report will be deleted.
Users with the Security auditor and Security officer roles cannot delete reports.
Managing NDR reports
You can use Kaspersky Anti Targeted Attack Platform to get reports with various information saved by the application. Kaspersky Anti Targeted Attack Platform generates reports as PDF files. The application can send report files to email addresses.
You can view information about generated reports and export them to files in the Reports section, Reports (NDR) subsection, Generated reports tab.
The following types of NDR report templates are possible:
- System templates, created automatically during application installation. In the table of report templates, system templates are displayed with the
 icon. You cannot delete system templates.
Kaspersky Anti Targeted Attack Platform supports the following system report templates:
- Inventory report.
Contains information about devices and system commands, as well as protocols used and detected risks on devices.
- System security report.
Contains information about the security status of devices, registered events, detected risks, and interactions with devices on external networks.
- Executive summary.
Contains brief information about devices and the security status of the system.
- Full report.
Contains complete information about devices and the security status of the system.
- Inventory report.
- Custom templates, created manually by duplicating templates. You can duplicate system or custom templates. Only users with the Senior security officer role can duplicate report templates.
Information in reports is presented as separate information blocks. Each Kaspersky Anti Targeted Attack Platform report includes a fixed set of information blocks, which are arranged in a fixed order. Information blocks used in reports and their descriptions are listed in the table below.
Using information blocks in reports
Name of the information block |
Inventory report |
System security report |
Executive summary |
Full report |
|---|---|---|---|---|
|
|
|
|
|
|
|
|
|
|
|
|
|
|
|
|
|
|
|
|
|
|
|
|
|
|
|
|
|
|
|
|
|
|
|
|
|
|
|
|
|
|
|
|
|
|
|
|
|
|
|
|
|
|
|
|
|
|
|
|
|
|
|
|
|
|
|
|
|
|
|
|
|
|
|
|
|
|
|
|
|
|
|
|
|
|
|
|
|
|
|
|
|
|
|
|
|
|
|
|
.png)
Viewing the table of NDR report templates
You can view the table of report templates in the web interface of the application, in the Reports section, Reports (NDR) subsection, on the Report templates tab.
Report template settings are displayed in the following columns of the table:
- Name.
Report template name. The
icon is displayed next to the names of system report templates. - Schedule.
Information about the schedule used by Kaspersky Anti Targeted Attack Platform to automatically generate a report based on the template. Schedule information is displayed if a user with the Senior security officer role configured a schedule in the report template. If the schedule is not configured, the column displays Disabled.
- Type/use.
Name of the user who last modified the report template. System is displayed for system templates that have default settings.
- Last report.
Time when the last report was generated based on the report template.
- Destinations.
Icon signifying that email report recipients are configured. The following icons have the following meanings:
 – report recipients are defined.
 – report recipients are not defined.
Viewing NDR report template details
To view report template information:
In the Reports section, Reports (NDR) subsection, on the Report templates tab, select the relevant template.
The details area is displayed in the right part of the web interface window. The details area displays all specified details.
Details of the report template include the following fields:
- Name is the name of the report template.
- Type/user is the name of the user that last modified the report template. System is displayed for system templates that have default settings.
- Period is the time period covered by the report that Kaspersky Anti Targeted Attack Platform generates based on the template.
- Modified is the time when the most recent change to the template was made.
- Last report is the time when the last report was generated based on the template.
- Next start (local time) is the time when the next report generation based on the template will start. This setting is displayed if a schedule is configured for the report template.
- Schedule displays information about the schedule used by Kaspersky Anti Targeted Attack Platform to automatically generate a report based on the template. This setting is displayed if a schedule is configured for the report template.
Recipient addresses are email addresses to which Kaspersky Anti Targeted Attack Platform sends the generated reports. This setting is displayed if recipient addresses are configured for the report template.
Page top
Viewing the table of NDR reports
You can view the table of reports in the web interface of the application, in the Reports section, Reports (NDR) subsection, on the Generated reports tab.
Report settings are displayed in the following columns of the table:
- ID.
Unique ID of the report.
- Report name.
Name of the generated report.
- Template name.
Name of the template used to generate the report.
- Start.
Date and time when the report generation started.
- Status.
Status of the report. A report can have one of the following statuses:
 Pending. The report is queued for generation. A report can have the Pending status when multiple reports are generated at the same time.
 In progress. The report is being generated.
 Error. An error occurred while generating the report.
 Done. The report is successfully generated.
 Canceling. Report generation is being canceled.
 Canceled. Report generation has been canceled.
 - User.
Name of the user that initiated the generation of the report or configured the schedule for running the report based on a template.
- Run type.
Report generation type: manual or scheduled.
- Completed.
Date and time when the report generation ended.
Manually generating an NDR report based on a template
You can manually start generating a report based on a template.
To start report generation:
- Select the Reports section, then the Reports (NDR) subsection.
- On the Report templates tab, select one or more templates that you want to use to generate reports.
When multiple templates are selected, the application generates reports based on these templates simultaneously. You can select up to 10 templates.
- In the toolbar above the table of report templates, click Get reports.
Kaspersky Anti Targeted Attack Platform starts generating the report.
You will be taken to the Generated reports tab, which displays the status of the reports being generated. After the reports are generated, Kaspersky Anti Targeted Attack Platform sends report files in PDF format to the email addresses specified in the report template. If an email address is not defined in the report template, you can individually export generated reports to files manually on the Generated reports tab. The maximum size of a report file is 10 MB.
If necessary, you can cancel the generation of the report.
Page top
Duplicating an NDR report template
You can create custom templates by duplicating existing report templates. You can duplicate system templates or custom templates. When duplicating a template, you cannot choose which information blocks to include in the report or rearrange them.
The maximum number of templates in the application is 5000.
To duplicate a report template:
- Select the Reports section, then the Reports (NDR) subsection.
- On the Report templates tab, select the relevant template.
The details area is displayed in the right part of the web interface window.
- Click Create new template.
- In the Name field, edit the name of the report template.
You can use Latin and Cyrillic letters, numerals, the space character, as well as -, –, _ characters.
The name of the report template must satisfy the following requirements:
- Does not reuse the name of another report template (case-insensitive).
- Contains up to 100 characters.
Names of reports generated from the updated template will reflect the new name of the template.
- In the Data period drop-down list, select the time period for which you want to get system information in the report.
You can generate reports with information received by the application within the last 24 hours, 7 days, 30 days, the last year, or a manually configured time frame.
- If you need to generate reports on a schedule, turn on the Generate report by schedule toggle switch and set up a schedule:
- In the Frequency drop-down list, select how often you want to generate the report: Hourly, Daily, Weekly, or Monthly.
- Depending on the selected option, specify the values for the settings to refine the report generation start time.
- If necessary, use the Recipient addresses field to enter the email address to which you want to send the generated reports. If you need to specify additional recipients of the report, click Add recipient address and enter the email address.
The maximum number of report recipients is 20.
- Click Save.
The new report is added to the table of report templates.
Page top
Editing an NDR report template
To edit the settings of a report template:
- Select the Reports section, then the Reports (NDR) subsection.
- On the Report templates tab, select the relevant template.
The details area is displayed in the right part of the web interface window.
- Click Edit.
- In the Name field, edit the name of the report template.
You can use Latin and Cyrillic letters, numerals, the space character, as well as -, –, _ characters.
The name of the report template must satisfy the following requirements:
- Does not reuse the name of another report template (case-insensitive).
- Contains up to 100 characters.
Names of reports generated from the updated template will reflect the new name of the template.
- In the Data period drop-down list, select the time period for which you want to get system information in the report.
You can generate reports with information received by the application within the last 24 hours, 7 days, 30 days, the last year, or a manually configured time frame.
- If you need to generate reports on a schedule, turn on the Generate report by schedule toggle switch and set up a schedule:
- In the Frequency drop-down list, select how often you want to generate the report: Hourly, Daily, Weekly, or Monthly.
- Depending on the selected option, specify the values for the settings to refine the report generation start time.
- If necessary, use the Recipient addresses field to enter the email address to which you want to send the generated reports. If you need to specify additional recipients of the report, click Add recipient address and enter the email address.
The maximum number of report recipients is 20.
- Click Save.
The changes are displayed in the corresponding columns of the table of report templates.
Page top
Exporting an NDR report to a file
You can export the generated report to a PDF file.
To export a report to a file:
- In the Reports section, select the Reports (NDR) subsection.
- On the Generated reports tab, select the relevant report.
The reports are filtered by the IDs of the reports that were started last in the current Server connection session. To display all generated reports, reset the filter settings by clicking Default filter. If necessary, you can configure filtering by a time period of your choice.
The details area is displayed in the right part of the web interface window.
- Click Export.
The browser save the report file. By default, the report file has a name in the <report name>_<date and time when the report was generated> format. Depending on your browser's settings, a window may be displayed on your screen in which you can specify the path and name of the downloaded file.
Deleting an NDR report template
Only custom report templates can be deleted.
To delete a report template:
- Select the Reports section, then the Reports (NDR) subsection.
- On the Report templates tab, select one or more report templates that you want to delete.
- Click Delete.
System templates cannot be deleted. In the table of report templates, system templates are displayed with the
icon. - In the displayed prompt window, confirm the deletion of report templates.
Deleting an NDR report
To delete a report:
- Select the Reports section, then the Reports (NDR) subsection.
- On the Generated reports tab, select one or more reports that you want to delete.
The reports in the table of reports are filtered by the IDs of the reports that were started last in the current Server connection session. To display all generated reports, reset the filter settings by clicking Default filter. If necessary, you can configure filtering by a time period of your choice.
The details area is displayed in the right part of the web interface window.
- Click Delete.
- In the displayed prompt window, confirm the deletion of the report.
Canceling NDR report generation
You can cancel report generation only for a report with the In progress status.
To cancel report generation:
- Select the Reports section, then the Reports (NDR) subsection.
- On the Generated reports tab, select the report with the In progress status that you want to cancel.
The details area is displayed in the right part of the web interface window.
- Click Cancel.
- In the displayed prompt window, confirm the cancellation of the report.
After this request is completed, the report status changes to Canceled.
Managing the settings for storing report files
You can change the maximum total size limit for stored report files.
To edit report file storage settings:
- Log in to the web interface with the application administrator account.
- Select the Sensor servers section.
- Select the card of the local host (IP address 0.0.0.0).
The details area is displayed in the right part of the web interface window.
- Click Edit.
In the details area, tabs are displayed, on which you can manage the settings of the server.
- On the General tab, under Reports, use the Max volume setting to set a size limit for the stored report files.
You can select the unit of measure for the size limit: MB or GB.
When editing the value, you also need to take into account that the sum total of all size limits may not exceed the specified maximum storage capacity for the node.
- If necessary, use the Storage time (days) setting to limit the storage duration of report files, and specify the duration in days.
- Click Save.
Managing rules for assigning the VIP status to alerts
Users with the Senior security officer role can create, delete, modify, import and export a list of rules for assigning the VIP status to alerts.
You can create the following types of rules:
- IP. The VIP status will be assigned to new alerts associated with this IP address of the computer.
- Host name. The VIP status will be assigned to new alerts associated with this host name.
- Email address. The VIP status will be assigned to new alerts associated with this email address.
Users with the Security auditor role can view and export a list of rules for assigning the VIP status to alerts.
Users with the Security officer role cannot view the list of rules for assigning VIP status to alerts.
Viewing the table of VIP status assignment rules
The table of rules for assigning the VIP status is located in the Settings section, VIP status subsection of the web interface of the application.
The table contains the following information:
- Criterion—Criterion for adding an entry to the list of rules.
- Value—Value of the criterion.
- Description—Additional information specified when creating the rule.
Creating a VIP status assignment rule
To add a rule for assigning the VIP status to alerts:
- In the main window of the application web interface, select the Settings tab, VIP status section.
- In the upper-right corner of the application web interface window, click Add.
This opens the window for adding a rule.
- In the Criterion drop-down list, select one of the following rule types:
- IP, if you want to add a rule for a computer IP address.
- Host, if you want to add a rule for a host name.
- Email address, if you want to add a rule for an email address.
- Enter the necessary value in the Value field.
For example, if under Criterion, you selected Email address, enter the email address that you want to add in the Value field.
- In the Description field, enter additional information if necessary.
- Click Add.
The rule is added. The VIP status will be assigned to new alerts associated with the added IP address, host name, or email address.
Users with the Security auditor role cannot create VIP status assignment rules.
Users with the Security officer role cannot view the list of rules for assigning VIP status to alerts.
Deleting a VIP status assignment rule
To delete a rule for assigning the VIP status to alerts:
- In the main window of the application web interface, select the Settings tab, VIP status section.
- Select the check box to the left of each rule that you want to remove from the list.
- If you want to delete all rules, select the check box above the list.
- In the upper-right corner of the application web interface window, click Delete.
The action confirmation window is displayed.
- Click Yes.
The selected rules will be deleted.
Users with the Security auditor role cannot delete VIP status assignment rules.
Users with the Security officer role cannot view the list of rules for assigning VIP status to alerts.
Modifying a VIP status assignment rule
To modify a rule for assigning the VIP status to alerts:
- In the main window of the application web interface, select the Settings tab, VIP status section.
- Select the rule that you want to modify.
This opens the rule editing window.
- Make the necessary changes to the Criterion, Value and Description fields.
- Click Save.
The rule is modified.
Users with the Security auditor role cannot modify VIP status assignment rules.
Users with the Security officer role cannot view the list of rules for assigning VIP status to alerts.
Importing a list of VIP status assignment rules
To import a list of rules for assigning VIP status to alerts:
- In the main window of the application web interface, select the Settings tab, VIP status section.
- Click Import.
You will be prompted for confirmation of the list import.
The imported list of rules for assigning the VIP status to alerts will replace the current list of VIP status alert assignment rules.
- Click Yes.
This opens the file selection window.
- Select a JSON file containing the list of rules that you want to import and click Open.
This closes the file selection window.
The list is imported.
Exporting the list of data excluded from the scan
To export the scan exclusion list:
- In the main window of the application web interface, select the Settings section, Exclusions subsection.
- Go to the Scan tab.
- In the upper-right corner of the application web interface window, click Export.
The JSON file containing the exported list of scan exclusions is saved in the browser's downloads folder on your computer.
Filtering and searching by type of VIP status assignment rule
To filter or search for VIP status assignment rules by rule type:
- In the main window of the application web interface, select the Settings tab, VIP status section.
- Click the Criterion link to open the filter configuration window.
- Select one or several check boxes next to the types of rules:
- IP.
- Host.
- Email address.
- Click Apply.
The filter configuration window closes.
The table will display only the rules that match the filter criteria you have set.
You can use multiple filters at the same time.
Filtering and searching by value of VIP status assignment rule
To filter or search for VIP status assignment rules by rule value:
- In the main window of the application web interface, select the Settings tab, VIP status section.
- Click the Value link to open the filter configuration window.
- Enter one or several characters of the rule value.
- Click Apply.
The filter configuration window closes.
The table will display only the rules that match the filter criteria you have set.
You can use multiple filters at the same time.
Filtering and searching by description of VIP status assignment rule
To filter or search for VIP status assignment rules by description:
- In the main window of the application web interface, select the Settings tab, VIP status section.
- Click the Description link to open the filter configuration window.
- Enter one or several characters of the description.
- Click Apply.
The filter configuration window closes.
The table will display only the rules that match the filter criteria you have set.
You can use multiple filters at the same time.
Clearing a VIP status assignment rule filter
To clear the VIP status assignment rule filter for one or more filtering criteria:
- In the main window of the application web interface, select the Settings tab, VIP status section.
- Click to the right of the header of the table column for which you want to clear the filter conditions.
If you want to clear several filter conditions, perform the necessary actions to clear each filter condition.
The selected filters are cleared.
The table will display only the rules that match the filter criteria you have set.
Managing allow rules for NDR events
Kaspersky Anti Targeted Attack Platform can monitor network interactions between devices. Allow rules are used to configure authorized and unauthorized network interactions. All network interactions that matches active allow rules is treated as allowed. When allowed interactions are detected, the application does not log NDR events or generate alerts.
You can view, create, copy, modify, delete, enable or disable allow rules.
Viewing the table of allow rules
To view the table of allow rules:
- Select the Settings section in the application web interface window.
- Go to the Allow rules tab.
The table of allow rules is displayed.
The table contains the following information:
- Rule ID is the unique ID of the rule.
- Status (
 icon) is the current status of the rule (Enabled or Disabled).
 - Rule type: for rules that disable event registration, the EVT type is specified.
- Protocols/Commands defines a set of protocols.
- Side 1 is the device name / address information of one of the sides of the network interaction. You can enable or disable the display of addresses and ports in address information using the following settings: MAC address, IP address, and Port number. If additional address spaces are added to application, you can enable or disable the display of address space names using the following settings:
- AS for MAC addresses: Address spaces containing the MAC addresses in the rule. This setting can contain the names of only those address spaces that have address space rules with Data Link (L2) selected as the OSI layer.
- AS for IP addresses: Address spaces containing the IP addresses in the rule. This setting can contain the names of only those address spaces that have address space rules with Network (L3) selected as the OSI layer.
- Side 1 is the device name / address information of the other side of the network interaction. The display of address information can be configured the same way as the Side 1 column.
- Comment lets you provide additional information about the rule.
- Created is the date and time when the rule was created.
- Changed is the date and time when the rule was last modified.
- Monitoring point is the name of the monitoring point to be specified in events (for rules of the EVT type).
- Event type is the ID and title of the event type.
- Origin provides information about the origin of the rule.
- SID of the system IDS rule is the ID of the system IDS rule. If an ID was not specified when creating the allow rule, All rules is displayed.
Creating an allow rule with blank settings or settings from a template
To create an allow rule with blank settings or settings from a template:
- Select the Settings section in the application web interface window.
- Go to the Allow rules tab.
- Click Add rule.
- If you want to use settings from a template, in the details area click Use template, select the necessary template in the opened window and click Apply.
- In the details area, click EVT.
- In the Protocol field, specify the protocol for interaction between devices.
Selecting the Protocol field opens the window with the table of supported protocols displayed as a protocol stack tree. You can control the display of tree nodes using the + and - buttons next to the names of protocols that encompass protocols of the next tiers.
If necessary, use the search bar above the table to find the protocols that you need.
To specify the protocol:
- In the table of protocols, select the protocol that you want to specify for the rule. To select a protocol, click the button in the left column of the table of protocols.
- Click OK.
If you select a protocol that the application can detect by the contents of network packets, the corresponding warning is displayed under the Protocol field.
- If necessary, enter additional information about the rule in the Comment field.
- Under Side 1 and Side 2, specify the editable address information for the sides of network interaction. Depending on the selected protocol (or set of protocols), the address information may contain the MAC address, IP address, and/or port number. If additional address spaces have been added to the application, you can specify the names of the address spaces for the addresses.
To automatically fill in the address information for the side of the network interaction, you can select devices known to the application. To do so:
- Open the device selection window by clicking Specify device addresses.
- In the device selection window, select check boxes next to the devices that you want to use.
The device selection window contains a table in which you can configure the layout and order of columns, and also filter, search, and sort similarly to the devices table in the Assets section.
- Click OK in the device selection window.
- In the Event type field, specify the event type whose numerical code is indicated in events.
Selecting the Event type field opens a window containing a list of event types that may be specified in allow rules. If necessary, use the search bar above the list to find the event type that you need. To specify the event type, select it in the list and click Apply.
- In the Monitoring point field, specify the name of the monitoring point that is indicated in events.
Selecting the Monitoring point field opens a window containing a list of all monitoring points on all nodes that have application components installed. If necessary, use the search bar above the list to find the name of the monitoring point that you need. To specify the monitoring point name, select it in the list and click Apply.
- If you do not want the application to use the selected system IDS rule to scan network connections that match the conditions of this allow rule, specify the ID of this rule in the SID of the system IDS rule field. You can view the SID of the system IDS rule in the details of the IDS alert.
If a SID is not specified, the application disables scanning by all system IDS rules for network interactions that match the conditions of this allow rule.
- In the details area, click Save.
The rule is added to the table of allow rules.
Page top
Creating an allow rule from a registered event
To create an allow rule from a registered event:
- In the Network traffic events section in the table of events, select the event on which you want to base the allow rule for events that you are creating.
- In the details area, click Create allow rule.
This opens the Allow rules section in the browser window. In the right part of the web interface window, the details area is displayed in rule settings editing mode. The settings of the new rule are initialized with values from the saved event details.
- If necessary, edit the settings of the new rule. To do this, follow steps 4–12 of the procedure for creating a rule with initially blank settings. If you do not need to edit the settings of the new rule, save the rule by clicking Save.
An allow rule is created based on the registered event.
Page top
Copying an allow rule
To create an interaction control rule from an existing one:
- Select the Settings section in the application web interface window.
- Go to the Allow rules tab.
- Select the rule that you want to base the new rule on.
- Right-click to open the context menu.
- In the context menu, select Copy rule.
In the right part of the web interface window, the details area is displayed in rule settings editing mode. The settings of the new rule are initialized with values of the saved event settings.
- Edit the settings as needed. To do this, follow steps 4–12 described in the procedure for creating a rule.
The allow rule is copied.
Page top
Editing the settings of an allow rule
You can edit the settings of an enabled allow rule. Disabled rules are not editable.
To edit the settings of an allow rule:
- Select the Settings section in the application web interface window.
- Go to the Allow rules tab.
- Select the rule whose settings you want to edit.
The details area is displayed in the right part of the web interface window.
- Click Edit.
- Edit the settings as needed. To do this, follow steps 4–12 described in the procedure for creating a rule.
- Click Save.
The rule settings are modified.
Page top
Enabling or disabling allow rules
Allow rules can have the Enabled or Disabled status. By default, rules are enabled after creation.
To change the status of allow rules:
- Select the Settings section in the application web interface window.
- Go to the Allow rules tab.
- In the table of rules, select the rules whose status you want to change.
- Enable or disable rules by clicking Enable or Disable. Each of these buttons is displayed the selected rules include rules to which the corresponding operation can be applied.
The status of the selected rules is changed.
Page top
Deleting allow rules
You can selectively delete one or more allow rules.
To delete allow rules:
- Select the Settings section in the application web interface window.
- Go to the Allow rules tab.
- In the rule table, select the allow rules that you want to delete.
- Click Delete.
This opens a confirmation prompt window. Depending on the state of the selected rules, the prompt offer the following options:
- If all of the selected rules are enabled, the application prompts you to delete the selected rules, disable them, or cancel the operation. This condition is not checked if all rules that match the current filter and search conditions are selected, and the number of selected rules is greater than 1000.
- If the selected rules include disabled rules or all rules that satisfy the current filter and search conditions are selected, and the number of selected rules is greater than 1000, the application prompts you to delete the selected rules or cancel the operation.
- In the prompt window, confirm deletion of the rules.
The selected rules will be deleted.
Page top
Managing the list of scan exclusions
Users with the Senior security officer role can create, import and export the list of scan exclusions, that is, the list of data that Kaspersky Anti Targeted Attack Platform treats as safe and does not display in the alerts table. You can create scan exclusion rules for the following data:
- MD5
- Format.
- URL mask.
- Email recipient.
- Email sender.
- Source IP or subnet.
- Destination IP or subnet.
- User Agent.
Users with the Security auditor and Security officer roles can view the list of scan exclusion rules as well as export it.
Viewing the table of data excluded from the scan
To view the table with data excluded from the scan:
- In the main window of the application web interface, select the Settings section, Exclusions subsection.
- Go to the Scan tab.
This opens the table with a list of data that Kaspersky Anti Targeted Attack Platform will treat as safe and will not create alerts for. You can filter the rules by clicking links in column headers.
The table contains the following information:
- Criterion—Criterion for adding an entry to the list of allowed objects.
- Value—Value of the criterion.
Adding a scan exclusion rule
To add to scan exclusions:
- In the main window of the application web interface, select the Settings section, Exclusions subsection.
- Go to the Scan tab.
- In the upper-right corner of the application web interface window, click Add.
This opens the New rule window.
- In the Criterion drop-down list, select one of the following criteria for adding a rule to the list of scan exclusions:
- MD5.
- Format.
- URL mask.
- Email recipient.
- Email sender.
- Source IP or subnet.
- Destination IP or subnet.
- User Agent.
- If you selected Format, select the file format that you want to add from the Value drop-down list.
For example, you can select the MSOfficeDoc format.
- If you selected MD5, URL mask, Email recipient, Email sender, Source IP or subnet, Destination IP or subnet, or User Agent, in the Value field, enter the value of the relevant criterion that you want to add to the list of scan exclusions:
- If you selected MD5, enter the MD5 hash of the file in the Value field.
- If you selected URL mask, enter the URL mask in the Value field.
You can use the following special characters in the mask:
* – any sequence of characters.
Example:
If you enter
*abc*as the mask, the application considers as safe any URL that contains the sequenceabc. For example,www.example.com/download_virusabc? – any single character.
Example:
If you enter
example_123?.comas the mask, the application considers as safe any URL that contains the given character sequence and any character following3. For example,example_1234.comIf the
*or?characters are part of the full URL that you want to add to the list of scan exclusions, use the\character when entering the URL to escape a single*,?, or \ character that follows it.Example:
You need to add the following URL as a trusted address:
www.example.com/download_virus/virus.dll?virus_name=You do not want the application to treat
?as a special mask character so you put a\character before the?character.The URL added to the list of scan exclusions looks as follows:
www.example.com/download_virus/virus.dll\?virus_name= - If you selected Email recipient or Email sender, enter the email address in the Value field.
- If you selected User Agent, enter the User agent header of HTTP requests containing browser information in the Value field.
- If you selected Source IP or subnet or Destination IP or subnet, enter the address or subnet (for example, 255.255.255.0) in the Value field.
In the URL mask, Email recipient, and Email sender field, you can enter domain names containing Cyrillic characters. In this case, the address is converted to Punycode and processed in accordance with application settings.
- Click Add.
The rule is added to the scan exclusion list.
Users with the Security auditor and Security officer roles cannot add a scan exclusion rule.
Deleting a scan exclusion rule
To remove one or multiple rules from scan exclusions:
- In the main window of the application web interface, select the Settings section, Exclusions subsection.
- Go to the Scan tab.
- Select the check box to the left of each rule that you want to remove from the list of scan exclusions.
If you want to delete all rules, select the check box above the list.
- In the lower part of the window, click Delete.
The action confirmation window is displayed.
- Click Yes.
The selected rules are removed from the list of scan exclusions.
Users with the Security auditor and Security officer roles cannot remove entries from the list of scan exclusions.
Editing a rule added to scan exclusions
To edit a rule in the scan exclusion list:
- In the main window of the application web interface, select the Settings section, Exclusions subsection.
- Go to the Scan tab.
- Select the rule that you want to modify.
This opens the Edit rule window.
- Make the necessary changes to the Criterion and Value fields.
- Click Save.
The rule is modified.
Users with the Security auditor and Security officer roles cannot edit rules in the list of scan exclusions.
Exporting the list of data excluded from the scan
To export the scan exclusion list:
- In the main window of the application web interface, select the Settings section, Exclusions subsection.
- Go to the Scan tab.
- In the upper-right corner of the application web interface window, click Export.
The JSON file containing the exported list of scan exclusions is saved in the browser's downloads folder on your computer.
Filtering rules in the scan exclusion list by criterion
To filter scan exclusion list entries by rule type:
- In the main window of the application web interface, select the Settings section, Exclusions subsection.
- Go to the Scan tab.
- Click the Criterion link to open the filter configuration window.
- Select one or more check boxes next to criteria by which you want to filter the rules:
- MD5.
- Format.
- URL mask.
- Email recipient.
- Email sender.
- Source IP or subnet.
- Destination IP or subnet.
- User Agent.
- Click Apply.
The filter configuration window closes.
The list of scan exclusions displays only those rules that match your criteria.
You can use multiple filters at the same time.
Searching for rules in the scan exclusion list by value
To search rules in the scan exclusion list by value:
- In the main window of the application web interface, select the Settings section, Exclusions subsection.
- Go to the Scan tab.
- Click the Value link to open the filter configuration window.
- Enter value characters.
- Click Apply.
The list of scan exclusions displays only those rules that match your criteria.
You can use multiple filters at the same time.
Resetting the rule filter in the scan exclusion list
To clear an exclusion list record filter by one or more filtering criteria:
- In the main window of the application web interface, select the Settings section, Exclusions subsection.
- Go to the Scan tab.
- Click to the right of the header of the column in the table of scan exclusion list entries for which you want to clear the filter conditions.
If you want to clear several filter conditions, perform the necessary actions to clear each filter condition.
The selected filters are cleared.
The list of scan exclusions displays only those rules that match your criteria.
Managing Intrusion Detection rule exclusions
Users with the Senior security officer role can add Kaspersky Intrusion Detection rules to scan exclusions. Kaspersky Anti Targeted Attack Platform does not create alerts when scanning by excluded Intrusion Detection rules.
You can add to exclusions only Intrusion Detection rules made by Kaspersky. If you do not want to apply a user-defined Intrusion Detection rule when scanning, you can disable this rule or delete it.
If you want to configure a singular exclusion, for example, for a specific source address, you can:
- Open the alert details of the IDS alert for which you want to create a singular exception.
- Copy the IDS alert data in Suricata format and save it in any way that you find convenient.
- Add the Kaspersky Intrusion Detection rule that generated the alert to exclusions from scanning.
- Add a new rule based on the properties of the excluded Kaspersky rule to the list of user-defined Intrusion Detection rules in one of the following ways:
- If the system already has user-defined Intrusion Detection rules, export a file with the rules and add a new rule to this file with conditions that narrow down the rule using the Suricata syntax. An example of creating user-defined Intrusion Detection rules is shown below.
- If no user-defined Intrusion Detection rules exist in the system yet, create a text file and add to it a rule with qualifying conditions using the Suricata syntax. An example of creating user-defined Intrusion Detection rules is shown below.
- Import a file with the added rule.
We do not recommend using the above method of creating singular exclusions on a regular basis because a large number of user-defined Intrusion Detection rules can get out of control and reduce the level of protection of the corporate LAN. We strongly recommended monitoring the results of the created exclusions. We also strongly recommended testing the user-defined rules in a test environment before importing. User-defined Intrusion Detection rules may cause performance issues, in which case stable operation of Kaspersky Anti Targeted Attack Platform is not guaranteed.
Users with the Security auditor role can view the list of Intrusion Detection rules added to exclusions, and view the properties of a selected rule.
Users with the Security officer role cannot view the list of Intrusion Detection rules added to exclusions.
Examples of creating user-defined Intrusion Detection rules based on the properties of an excluded Kaspersky rule
If you do not want one or more of the source and/or destination addresses to be reflected in the IDS alert, you can use the ! (NOT) operator.
Example: For an IDS alert with data:
You can create the following user-defined Intrusion Detection rules with singular exclusions:
|
Viewing the table of Intrusion Detection rules added to exclusions
To view the table of Intrusion Detection rules added to exclusions:
- In the main window of the application web interface, select the Settings section, Exclusions subsection.
- Go to the IDS tab.
The table of excluded IDS rules is displayed. You can filter the rules by clicking links in column headers.
The table contains the following information:
- Time created—Date and time when the Intrusion Detection rule was added to exclusions.
- Rule name—Name of the Intrusion Detection rule.
- Rule ID—ID of the Intrusion Detection rule (SID or signature ID) in Suricata format.
- Description—Description of the Intrusion Detection rule.
- Created by—Name of the user whose account was used to add the Intrusion Detection rule to exclusions.
Adding an Intrusion Detection rule to exclusions
You can exclude Kaspersky Intrusion Detection rules with medium or high importance alerts from event scanning.
You can add to exclusions only Intrusion Detection rules made by Kaspersky. If you do not want to apply a user-defined Intrusion Detection rule when scanning events, you can disable this rule or delete it.
To add an Intrusion Detection rule to exclusions:
- Select the Alerts section in the window of the application web interface.
This opens the table of alerts.
- Click the link in the Technologies column to open the filter configuration window.
- In the drop-down list on the left, select Contain.
- In the drop-down list on the right, select the (IDS) Intrusion Detection System technology.
- Click Apply.
- If you want to filter detections, click to expand the list of filtering parameters and select the required filter.
- Select an alert for which the Detected column displays the name of the relevant Intrusion Detection rule.
This opens a window containing information about the alert.
- In the right part of the window, in the Recommendations section, Qualifying subsection, click Add to exclusions.
This opens the Add IDS rule to exclusions window.
- In the Description field, enter a description for the Intrusion Detection rule.
- Click Add.
The Intrusion Detection rule is added to exclusions and is displayed in the exclusion list in the Settings section, Exclusions subsection on the IDS tab in the application web interface. This rule is no longer used for creating alerts.
Users with the Security auditor role cannot modify entries in the list of allowed objects.
Users with the Security officer role do not have access to the list of Intrusion Detection rules added to exclusions.
Editing the description of an Intrusion Detection rule added to exclusions
To edit the description of an excluded Intrusion Detection rule, in the Alerts section:
- Select the Alerts section in the window of the application web interface.
This opens the table of alerts.
- Click the link in the Technologies column to open the filter configuration window.
- In the drop-down list on the left, select Contain.
- In the drop-down list on the right, select the (IDS) Intrusion Detection System technology.
- Click Apply.
- If you want to filter detections, click to expand the list of filtering parameters and select the required filter.
- Select an alert for which the Detected column displays the name of the relevant Intrusion Detection rule.
This opens a window containing information about the alert.
- In the right part of the window, in the Recommendations section, Qualifying subsection, click Edit IDS exclusion.
This opens the Edit IDS exclusion window.
In the Description field, edit the description of the rule.
Click Save.
The description of the excluded Intrusion Detection rule is modified. This rule is no longer used for creating alerts.
Users with the Security auditor role cannot edit Intrusion Detection rule descriptions.
Users with the Security officer role do not have access to the list of Intrusion Detection rules added to exclusions.
Removing Intrusion Detection rules from exclusions
You can remove from exclusions a single Intrusion Detection rule, multiple rules, or all rules at the same time.
To remove an Intrusion Detection rule from exclusions:
- In the application web interface window, select the Settings → Exclusions section and go to the IDS tab.
- The list of excluded Intrusion Detection rules is displayed.
- Select the rule that you want to remove from exclusions.
This opens a window containing information about the rule.
- Click Delete.
This opens the action confirmation window.
- Click Yes.
The rule is removed from exclusions. This rule is used for creating alerts.
To remove all or multiple IDS rules from exclusions:
- In the application web interface window, select the Settings → Exclusions section and go to the IDS tab.
- The list of excluded Intrusion Detection rules is displayed.
- Select check boxes next to rules that you want to remove from exclusions.
You can select all rules by selecting the check box in the row containing the headers of columns.
- In the pane that appears in the lower part of the window, click Delete.
This opens the action confirmation window.
- Click Yes.
The selected rules are removed from exclusions. These rules are used for creating alerts.
Users with the Security auditor role cannot remove Intrusion Detection rules from exclusions.
Users with the Security officer role do not have access to the list of exclusions from Intrusion Detection rules.
Managing TAA exclusions
TAA (IOA) rules created by Kaspersky experts contain indicators of suspicious behavior of an object in the corporate IT infrastructure. Kaspersky Anti Targeted Attack Platform scans the events database of the application and creates alerts for events that match behaviors described by TAA (IOA) rules. If you do not want the application to create alerts for events generated as part of host activity that is normal for your organization, you can add a TAA (IOA) rule to exclusions.
TAA (IOA) rule modes added to exclusions can work in the following modes:
- The rule is always excluded.
In this case, Kaspersky Anti Targeted Attack Platform does not mark events as matching the TAA (IOA) rule and does not create alerts based on that rule.
- The rule is supplemented by a condition.
In this case, the TAA (IOA) rule is supplemented by conditions in the form of a search query. Kaspersky Anti Targeted Attack Platform does not mark events that match specified conditions as matching the TAA (IOA) rules. For events that match the TAA (IOA) rule, but do not satisfy the conditions of the applied exclusion, the application marks the events and creates alerts.
If you are using the distributed solution and multitenancy mode, TAA exclusions can have the following types:
- Local—Created on the SCN server. These exclusions apply only to hosts that are connected to this SCN server. Exclusions belong to the tenant which the user is managing in the application web interface.
- Global—Created on the PCN server. Exclusions apply to hosts that are connected to this PCN server and to all SCN servers that are connected to this PCN server. Exclusions belong to the tenant which the user is managing in the application web interface.
Users with the Senior security officer role can create, edit, and delete exclusions for tenants to whose data they have access.
Users with the Security auditor and Security officer roles can only view the list of TAA exclusions and the properties of a selected exclusion.
For each TAA (IOA) rule, you can create only one local or global exclusion.
If one TAA (IOA) rule has exclusions created both on an SCN server and the PCN server, Kaspersky Anti Targeted Attack Platform processes events in accordance with exclusion settings on the PCN server.
Viewing the table of TAA (IOA) rules added to exclusions
To view the table of TAA (IOA) rules added to exclusions:
- In the main window of the application web interface, select the Settings section, Exclusions subsection.
- Click the TAA tab.
The table of excluded TAA (IOA) rules is displayed. You can filter the rules by clicking links in column headers.
The table contains the following information:
- is the importance of the alert generated as a result of scanning by this TAA (IOA) rule.
The importance level can have one of the following values:
- – Low.
- – Medium.
- – High.
- Type is the type of the rule depending on the role of the server which generated it:
- Local—Created on the SCN server. These exclusions apply only to hosts that are connected to this SCN server. Exclusions belong to the tenant which the user is managing in the application web interface.
- Global—Created on the PCN server. Exclusions apply to hosts that are connected to this PCN server and to all SCN servers that are connected to this PCN server. Exclusions belong to the tenant which the user is managing in the application web interface.
- Confidence – level of confidence depending on the likelihood of false alarms caused by the rule:
- High.
- Medium.
- Low.
The higher the confidence level, the lower the likelihood of false alarms.
- Exclude rule is the operating mode of the rule that is added to exclusions.
- Always means the rule is always excluded. In this case, Kaspersky Anti Targeted Attack Platform does not mark events as matching the TAA (IOA) rule and does not create alerts based on that rule.
- Based on conditions means the rule is excluded if a condition is added. In this case, the TAA (IOA) rule is supplemented by conditions in the form of a search query. Kaspersky Anti Targeted Attack Platform does not mark events that match specified conditions as matching the TAA (IOA) rules. For events that match the TAA (IOA) rule, but do not satisfy the conditions of the applied exclusion, the program marks the events and creates alerts.
- Name is the name of the rule.
Adding a TAA (IOA) rule to exclusions
You can add to exclusions only TAA (IOA) rules made by Kaspersky. If you do not want to apply a user-defined TAA (IOA) rule for scanning events, you can disable that rule or delete it.
To add a TAA (IOA) rule to exclusions from the Alerts section:
- Select the Alerts section in the window of the application web interface.
This opens the table of alerts.
- Click the link in the Technologies column to open the filter configuration window.
- In the drop-down list on the left, select Contain.
- In the drop-down list on the right, select the (TAA) Targeted Attack Analyzer technology.
- Click Apply.
The table displays alerts generated by the TAA technology based on TAA (IOA) rules.
- Select an alert for which the Detected column displays the name of the relevant rule.
This opens a window containing information about the alert.
- Under Scan results, click the link with the name of the rule to open the rule information window.
- To the right of the TAA exclusions setting name, click Add to exclusions.
This opens a window that allows you to add the TAA (IOA) rule to exclusions.
- In the Exclude rule field, select the exclusion operating mode:
- Always if you do not want the application to create alerts for events that match the selected TAA (IOA) rule.
- Based on conditions if you do not want the application to create events only for events that match specified conditions. Alerts are created for events that match the TAA (IOA) rule with the configured exclusion conditions taken into account.
If you selected Based on conditions:
- Click Configure additional conditions to open the event search form.
- If you are using the distributed solution and multitenancy mode and want to enable the display of events for all tenants, turn on the Search in all tenants toggle switch.
- Perform an event search in builder mode.
A table is displayed of events that match the TAA (IOA) rule given the specified exclusion criteria.
If you are using the distributed solution and multitenancy mode, found events are grouped in tiers: Server – Tenant names – Server names.
- Click the name of the server for which you want to view events.
The host table of the selected server is displayed. Event grouping levels are displayed above the table.
If necessary, you can change event search conditions.
- Click Add exclusion.
- If you are using the distributed solution and multitenancy mode, in the Apply to servers* field, select check boxes for tenants and servers to which the rule must be applied.
- Click Add.
The TAA (IOA) rule is added to exclusions and is displayed in the exclusion list in the Settings section, Exclusions subsection on the TAA tab in the application web interface. This rule is no longer used for creating alerts.
To add a TAA (IOA) rule to exclusions from the Threat Hunting section:
- Select the Threat Hunting section in the application web interface window.
This opens the event search form.
- Define the search conditions and click the Search button. For example, you can select event search criteria in the TAA properties group in builder mode.
The table of events that satisfy the search criteria is displayed.
- Select an event.
- To the right of the IOA tags setting, click the name of the rule.
This opens a window containing information about the rule.
- To the right of the TAA exclusions setting name, click Add to exclusions.
This opens a window that allows you to add the TAA (IOA) rule to exclusions.
- In the Exclude rule field, select the exclusion operating mode:
- Always if you do not want the application to create alerts for events that match the selected TAA (IOA) rule.
- Based on conditions if you do not want the application to create events only for events that match specified conditions. Alerts are created for events that match the TAA (IOA) rule with the configured exclusion conditions taken into account.
If you selected Based on conditions:
- Click Configure additional conditions to open the event search form.
- If you are using the distributed solution and multitenancy mode and want to enable the display of events for all tenants, turn on the Search in all tenants toggle switch.
- Perform an event search in builder mode.
A table is displayed of events that match the TAA (IOA) rule given the specified exclusion criteria.
If you are using the distributed solution and multitenancy mode, found events are grouped in tiers: Server – Tenant names – Server names.
- Click the name of the server for which you want to view events.
The host table of the selected server is displayed. Event grouping levels are displayed above the table.
If necessary, you can change event search conditions.
- Click Add exclusion.
- Click Add.
The TAA (IOA) rule is added to exclusions and is displayed in the exclusion list in the Settings section, Exclusions subsection on the TAA tab in the application web interface. This rule is no longer applied when scanning events.
When creating a search query to be saved as an exclusion criterion, avoid using the following fields:
- IOAId.
- IOATag.
- IOATechnique.
- IOATactics.
- IOAImportance.
- IOAConfidence.
These fields are only displayed after Kaspersky Anti Targeted Attack Platform marks events as matching TAA (IOA) rules.
Users with the Security auditor and Security officer roles cannot add TAA (IOA) rules to exclusions.
Viewing a TAA (IOA) rule added to exclusions
To view a TAA (IOA) rule added to exclusions:
- In the application web interface window, select the Settings section, Exclusions subsection and go to the TAA tab.
The table of excluded TAA (IOA) rules is displayed.
- Select the rule that you want to view.
This opens a window containing information about the rule.
The window contains the following information:
- TAA (IOA) rule: click this link to open a window containing a description of the MITRE technique corresponding to this rule, recommendations on responding to the event, and information about the likelihood of false alarms.
- ID is the ID that the application assigns to each rule.
- Name is the name of the rule that you specified when you added the rule.
- Importance is an estimate of the probable impact of the event on the security of computers or the corporate LAN as assessed by Kaspersky experts.
- Confidence is the level of confidence depending on the probability of false positives as estimated by Kaspersky experts.
- Exclude rule is the operating mode of the rule that is added to exclusions.
- Always means the rule is always excluded. In this case, Kaspersky Anti Targeted Attack Platform does not mark events as matching the TAA (IOA) rule and does not create alerts based on that rule.
- Based on conditions means the rule is excluded if a condition is added. In this case, the TAA (IOA) rule is supplemented by conditions in the form of a search query. Kaspersky Anti Targeted Attack Platform does not mark events that match specified conditions as matching the TAA (IOA) rules. For events that match the TAA (IOA) rule, but do not satisfy the conditions of the applied exclusion, the program marks the events and creates alerts.
- Configure additional conditions: click this link to open the event search form with search conditions.
The field is displayed if, when adding the TAA (IOA) rule to exclusions, you have selected the Based on conditions mode, and configured some search criteria.
- The search criteria are configured in the
<IOA ID> AND NOT <search criteria>format.Search criteria are displayed if, when adding the TAA (IOA) rule to exclusions, you have selected the Based on conditions mode, and configured some search criteria.
- Apply to servers* are hosts to which the exclusion applies.
This field is displayed in distributed solution and multitenancy mode.
Removing a TAA (IOA) rule from exclusions
You can remove from exclusions a single TAA (IOA) rule, multiple rules, or all rules at the same time.
To remove a TAA (IOA) rule from exclusions:
- In the application web interface window, select the Settings section, Exclusions subsection and go to the TAA tab.
The table of excluded TAA (IOA) rules is displayed.
- Select the rule that you want to remove from exclusions.
This opens a window containing information about the rule.
- Click Delete.
This opens the action confirmation window.
- Click Yes.
The rule is removed from exclusions. The rule is applied when creating alerts or scanning events.
To remove all or multiple TAA (IOA) rules from exclusions:
- In the application web interface window, select the Settings section, Exclusions subsection and go to the TAA tab.
- The table of excluded TAA (IOA) rules is displayed.
- Select check boxes next to rules that you want to remove from exclusions.
You can select all rules by selecting the check box in the row containing the headers of columns.
- In the pane that appears in the lower part of the window, click Delete.
This opens the action confirmation window.
- Click Yes.
The selected rules are removed from exclusions. The rules are applied when creating alerts or scanning events.
Users with the Security auditor and Security officer roles cannot remove TAA (IOA) rules from exclusions.
Managing ICAP exclusions
Users with the Senior security officer can create an ICAP exclusion list, that is, a list of data that Kaspersky Anti Targeted Attack Platform must not scan. You can create ICAP exclusion rules for the following data:
- Format.
- User Agent.
- MD5.
- URL mask.
- Source IP or subnet.
Users with the Security auditor and Security officer roles can view the list of ICAP exclusion rules.
In distributed solution mode, ICAP exclusions created on an SCN apply to all Sensor components connected to that SCN. ICAP exclusions created on a PCN apply to the SCN installed on the same device as the PCN and to all Sensor components connected to that SCN.
Viewing the ICAP exclusion table
To view the ICAP exclusion table:
- In the main window of the application web interface, select the Settings section, Exclusions subsection.
- Open the ICAP tab.
The table of data that Kaspersky Anti Targeted Attack Platform must not scan is displayed. You can filter the rules by clicking links in column headers.
The table columns contain the following information:
- Value—Value of the criterion.
- Criterion—Criterion for adding an entry to the list of allowed objects.
- State is the state of the rule.
Adding a rule to ICAP exclusions
ICAP exclusion rules are processed if a rule for the data has not been previously added to the scan exclusion rules.
To add rule to ICAP exclusions:
- In the main window of the application web interface, select the Settings section, Exclusions subsection.
- Open the ICAP tab.
- In the upper-right corner of the application web interface window, click Add.
This opens the New rule window.
- Move the State toggle switch to the position you need.
By default, the toggle switch is in the Enabled position.
- In the Criterion drop-down list, select one of the following criteria for adding a rule to the list of ICAP exclusions:
- Format.
- User Agent.
- MD5.
- URL mask.
- Source IP or subnet.
- Depending on the selected criterion, in the Value field, specify the following information:
- If you selected Format, select the file format that you want to add from the drop-down list.
When you add an ICAP exclusion rule by format, web page content of the corresponding format is loaded without scanning, and the display of web pages is not disrupted.
- If you selected User Agent, enter the
User agent header of HTTP requestscontaining browser information. - If you selected MD5, enter the MD5 hash of the file.
- If you selected URL mask, enter the URL mask.
You can use the following special characters in the mask:
* – any sequence of characters.
? – any single character.
If the
*or?characters are part of the full URL that you want to add to the list of scan exclusions, use the\character when entering the URL to escape a single*,?, or \ character that follows it.In the URL mask field, you can enter domain names containing Cyrillic characters. In this case, the address is converted to Punycode and processed in accordance with application settings.
- If you selected Source IP or subnet, enter an address or subnet (for example, 255.255.255.0).
- If you selected Format, select the file format that you want to add from the drop-down list.
- Click Add.
The rule is added to the ICAP exclusion list.
Users with the Security auditor and Security officer roles cannot add an ICAP exclusion rule.
Page top
Removing rules from ICAP exclusions
To remove one or more rules from ICAP exclusions:
- In the main window of the application web interface, select the Settings section, Exclusions subsection.
- Open the ICAP tab.
- Select the check box to the left of each rule that you want to remove from the list of ICAP exclusions.
If you want to delete all rules, select the check box above the list.
- In the lower part of the window, click Delete.
- This opens a window; in that window, click Yes to confirm the deletion of rules.
The selected rules are removed from the list of ICAP exclusions. Data that was previously listed in the ICAP exclusion rules are now scanned by Kaspersky Anti Targeted Attack Platform.
Users with the Security auditor and Security officer roles cannot remove entries from the list of ICAP exclusions.
Editing or disabling a rule in the ICAP exclusion list
To edit a rule in the ICAP exclusion list:
- In the main window of the application web interface, select the Settings section, Exclusions subsection.
- Open the ICAP tab.
- Select the rule that you want to modify.
This opens the Edit rule window.
- Make the necessary changes to the State, Criterion, and Value fields.
- Click Save.
The rule is modified.
To disable a rule in the ICAP exclusion list:
- In the main window of the application web interface, select the Settings section, Exclusions subsection.
- Open the ICAP tab.
- To the right of the rule that you want to disable in the ICAP exclusion list, in the State column, move the toggle switch to the Disabled position.
- This opens a window; in that window, click Yes to confirm the disabling of the rule.
The rule is disabled.
Users with the Security auditor and Security officer roles cannot edit or disable rules in the list of ICAP exclusions.
Filtering rules in the ICAP exclusion list by criterion
To filter rules in the ICAP exclusion list by criterion:
- In the main window of the application web interface, select the Settings section, Exclusions subsection.
- Open the ICAP tab.
- Click the Criterion link to open the filter configuration window.
- Select one or more check boxes next to criteria by which you want to filter the rules:
- Format.
- User Agent.
- MD5.
- URL mask.
- Source IP or subnet.
- Click Apply.
The filter configuration window closes.
The list of ICAP exclusions displays only rules that match the specified filtering conditions. You can filter by the Value and State columns at the same time.
Page top
Filtering rules in the ICAP exclusion list by value
To filter rules in the ICAP exclusion list by value:
- In the main window of the application web interface, select the Settings section, Exclusions subsection.
- Open the ICAP tab.
- Click the Value link to open the filter configuration window.
- Enter a value.
- Click Apply.
The list of ICAP exclusions displays only rules that match the specified search conditions. You can filter by the Criterion and State columns at the same time.
Filtering rules in the ICAP exclusion list by state
To filter rules in the ICAP exclusion list by state:
- In the main window of the application web interface, select the Settings section, Exclusions subsection.
- Open the ICAP tab.
- Click the State link to open the filter configuration window.
- Select the check box next to one of the values:
- Enabled
- Disabled
- Click Apply.
The list of ICAP exclusions displays only rules that match the specified search conditions. You can filter by the Criterion and Value columns at the same time.
Page top
Clearing rule filter conditions in the ICAP exclusion list
To clear the filter conditions for rules in the ICAP exclusion list:
- In the main window of the application web interface, select the Settings section, Exclusions subsection.
- Open the ICAP tab.
- Click to the right of the header of the Value, Criterion, or State column in the table for which you want to reset the filter conditions.
If you want to clear several filter conditions, perform the necessary actions to clear each filter condition.
The selected filter conditions are cleared. The list of ICAP exclusions displays only rules that match the specified conditions.
Page top
Managing mirrored traffic from SPAN ports
When managing the web interface, users with the Senior security officer role can download dumps of mirrored traffic from SPAN ports in PCAP format from servers with the Sensor component and conduct investigations to detect suspicious activity.
If you are using the distributed solution and multitenancy mode, follow the steps on the PCN or SCN server to which the server with the Sensor component is connected.
To download mirrored traffic from SPAN ports:
- Select the Sensor servers section in the window of the application web interface.
- Click the card of the relevant Sensor component.
This opens a window with information about the component.
- Click Download traffic.
The download options window is displayed.
In the Internal storage section, the Oldest packet field displays the date and time of the first saved dump in the internal storage. In the Used / maximum field, the first number indicates the occupied space in the internal storage, and the second number indicates the total size of the internal storage. The External storage section displays the storage status: Connected or Not connected.
- Do the following:
- In the Period of traffic to download, set the bounds for the period for which you want to download traffic dumps.
If recorded traffic does not exist for your selected period, when you click Download traffic, Kaspersky Anti Targeted Attack Platform suggests selecting the period from the first recorded network traffic dump to the last. If no recorded dumps exist at all, a warning is displayed indicating the lack of data for the specified period.
- In the Download volume limit field, you can specify the maximum amount of traffic to be downloaded.
If the amount of downloaded traffic exceeds the specified limit, the newest traffic is dropped.
- If necessary, enable filtering under Filtering by monitoring points and specify the monitoring points from which you want to get traffic.
- If necessary, enable filtering in the Filtering using BPF section and enter a filtering expression using the Berkeley Packet Filter (BPF) technology. The BPF filtering expression is written in the libpcap format. For more details about the syntax, please refer to the pcap-filter manual page.
Example of a filter expression:
tcp port 102 or tcp port 502 - If necessary, enable filtering in the Filtering using regular expressions section and enter an expression for filtering based on payload data in traffic.
Example of a filtering expression:
^test.+xABxCD
- In the Period of traffic to download, set the bounds for the period for which you want to download traffic dumps.
- Click Download traffic.
Dumps of mirrored traffic from SPAN ports are downloaded in PCAP format.
Recommendations for sequential traffic download requests
We recommend taking into account the time it takes to process the previous traffic download request when sending a new one.
If the next traffic download request arrives before the previous one has completed, dump file download may fail without any error messages.
The request processing time depends on various factors: the search range, the volume of traffic to be downloaded, and the speed of the connection between the Sensor, the server and the client computer.
The volume of traffic to be downloaded depends on the client's requirements; small volumes can be downloaded in a matter of seconds. If the user attempts to download all available traffic, the download speed limit of 50 Mbps is applied. This limitation protects the system from overload caused by downloading a large volume of traffic. At 50 Mbps, downloading 1 GB of traffic takes about 20 seconds, and 1 TB downloads in about 5.5 hours.
Page top
Creating a list of passwords for archives
The application does not scan password-protected archives. You can create a list of the most frequently encountered passwords for archives that are used when exchanging files within your organization. If you do so, the application will try passwords from the list when scanning an archive. If one of the passwords match, the archive will be unlocked and scanned.
The list of passwords set in application settings is also transmitted to the server with the Sandbox component.
To create a list of archive passwords:
- In the window of the application web interface, select the Settings section, Passwords for archives subsection.
- In the Passwords for archives field, enter the passwords that the application will use for password-protected archives.
Enter each password on a new line. You can enter up to 50 passwords.
- Click Apply.
The list of passwords for archives will be created. When scanning PDF files and files of Microsoft Word, Excel, and PowerPoint that are password protected, the application will use the passwords from the defined list.
Users with the Security auditor role can view the list of passwords for archives, but cannot edit it.
Page top
Managing Central Node or Sensor server information
Users with the Security auditor role can view information about servers with the Central Node and Sensor components.
Information about servers with the Central Node or Sensor components is displayed in the Sensor servers of the application web interface window.
This section displays cards of components (on the left) and cards of network interfaces detected on these components (to the right of each component).
Above the card of the Sensor component is the card of the Central Node component to which the Sensor is connected.
If the Central Node component is deployed with Embedded Sensor, the name of that Sensor component is displayed the card as Embedded Sensor.
The network interface card displays the following information:
- Network interface name
- MAC address of the network interface
- IP address of the network interface
- Network interface bandwidth
If a monitoring point has been added to the network interface, the following information about the monitoring point is displayed in the card of the network interface:
- Monitoring point name.
- Technology mode is the state of the technology inheritance functionality. It can be Enabled or Disabled.
You can view details of the Central Node and Sensor components and the network interfaces discovered on these components.
To view component or network interface details:
Click its card.
The Settings tab for the Central Node and Sensor components displays the following information:
- Status is the current status of the component indicated by an icon and text description.
- Node type indicates the application component: Server (Central Node component) or Sensor (Sensor component).
- Disk space currently used by the application is the disk space occupied by application files. Includes installed files and files created by the application in the course of its operation.
- Maximum disk space that can be used by the application is the disk space that can be occupied by application files. Includes installed files and the sum total of all space limits configured in data storage rules. This value may not exceed the amount of available disk space.
- Occupied on disk is the disk space used by all files. Includes application files, operating system files, and files of other applications. The space is calculated on the disk that contains the /var directory in the file system of the component.
- Free disk space is the disk space that is not used by files. The space is calculated on the disk that contains the /var directory in the file system of the component.
- Total disk space is the total volume of disk space on the drive that contains the /var directory in the file system of the component.
- BPF filtering indicates whether filtering using the Berkley Packet Filter (BPF) technology based on address parameters in network packets is enabled or disabled.
- External storage for traffic dump files indicates the connection status of the external storage. The following statuses may be displayed: Connected, Not connected.
- Retention rules indicate current and maximum values of size, number of items, and storage duration of application data.
For the Sensor component, in addition to the Settings tab, the External storage, Other, ICAP integration, POP3 integration, and SMTP integration tabs are also displayed.
- The External storage tab displays information about the configuration of the external storage for mirrored SPAN traffic.
- On the Other tab, the following information is displayed:
- Maximum size of scanned file is the current limit on the size of files that can be scanned by the component.
- Dump HTTP body indicates whether HTTP body content dumping is enabled or disabled.
- The ICAP Integration tab displays the settings of integration with a proxy server via ICAP.
- The POP3 Integration tab displays the POP3 mail server integration settings.
- The SMTP Integration tab displays the SMTP mail server integration settings.
For a network interface that does not have a monitoring point added, the following information is displayed in the details area:
- Network interface is the name of the network interface in the operating system.
- Connection is the icon indicating that a network cable is connected to the Ethernet port of the network interface:
- – the network cable is connected.
- – the network cable is disconnected.
The icon blinks when the Ethernet port indication mode is enabled.
- MAC address is the MAC address of the network interface.
- IP address is the IP address of the network interface. If multiple IP addresses are found on the network interface, a maximum of 16 IP addresses are displayed in the details area.
If a monitoring point has been added to the network interface, the following information is displayed in the card of the network interface:
- Status is the current status of the monitoring point indicated by an icon and a text description:
- OК. The monitoring point is available.
- Switchover. The operating mode of the monitoring point is being changed.
- Error. An error was detected when switching over the operating mode of the monitoring point.
- Connection is the icon indicating that a network cable is connected to the Ethernet port of the network interface:
- – the network cable is connected.
- – the network cable is disconnected.
The icon blinks when the Ethernet port indication mode is enabled.
- Network interface is the name of the network interface in the operating system.
- Mode is the current mode of the monitoring point:
- Enabled.
- Disabled.
- On the Settings tab:
- The Inheritance of technologies indicates whether inheritance of technologies is enabled or disabled for the server.
- MAC address is the MAC address of the network interface.
- IP address is the IP address of the network interface.
Viewing server settings
Users with the Security auditor role can view Central Node server and PCN settings in distributed solution and multitenancy mode.
The server settings are located in the Settings section of the web interface window. In this section, you can view the following information:
- Users—List of user accounts of application web interface users.
- General settings—General settings of the server.
- Database update—Database update.
- Monitoring—Maximum allowed hard drive space usage for Central Node and Sensor servers.
- SNMP—SNMP connection settings.
- Authentication policies—Password policy settings.
- Certificates—Status of server certificates and computers with the Endpoint Agent component.
- Date and time—Server date and time settings.
- Endpoint Agents—Program functionality available when integrating with the Endpoint Agent component.
- IOC scanning schedule—Settings for the IOC scan schedule.
- Send files to Sandbox automatically—Automatically send files to be scanned by the Sandbox component.
- Activity indicators—Activity indicators of the Endpoint Agent component.
- Remove inactive hosts automatically—Automatic removal of inactive hosts from the Endpoint Agents table.
- Send files from hosts for analysis to Sandbox manually—Manual sending of files to be scanned by the Sandbox component.
- Use TAA (IOA) rules for chains of events—Use TAA (IOA) rules to scan chains of events. This functionality is disabled by default.
- ICAP traffic scanning—Settings of integration with a proxy server via ICAP.
- Connection servers—Servers that act as integration servers for the Endpoint Agent component.
- Connectors—Connector settings.
- Secrets—Settings of secrets.
- Event types—Settings of event types.
- Risk types—Settings of risk types.
- KSN/KPSN and MDR—Settings for participation in Kaspersky Security Network and Kaspersky Private Security Network.
- KPSN reputation database—Settings for using the KPSN reputation database.
- SIEM system—Settings for integration with a SIEM system.
- Notifications—Notification settings.
- VIP status—List of rules for assigning the VIP status to alerts.
- Exclusions—List of allowed objects and lists of exclusions from TAA and IDS rules.
- Network settings—Settings for the network interface parameters.
- Allow rules—Rules for controlling the interactions of devices on the network.
- Passwords for archives—List of passwords for archives.
- License—State of the license key.
Viewing the table of servers with the Sandbox component
Users with the Security auditor role can view the table of servers with the Sandbox component.
The table of servers with the Sandbox component is located in the Sandbox servers section, on the Servers tab of the application web interface window.
The Certificate fingerprint field displays the fingerprint of the TLS certificate of the Central Node server.
The Server list table contains the following information:
- IP and name—IP address or fully qualified domain name of the server with the Sandbox component.
- Certificate fingerprint—Certificate fingerprint of the server with the Sandbox component.
- Authorization—Status of the request to connect to the Sandbox component.
- Status—Status of the connection to the Sandbox component.
Users with the Security officer role cannot view the table of servers with the Sandbox component.
Page top
Viewing the settings of the set of operating systems used for scanning objects in Sandbox
Users with the Security auditor role can view the settings of a set of operating systems used as the basis for creating tasks for scanning objects by the Sandbox component. The Sandbox server must have virtual machines installed that match the selected set.
Information about the settings of the set of operating systems for scanning objects in Sandbox is located in the Sandbox servers section, on the Settings tab of the application web interface window.
Sets of operating systems on which the Sandbox component can scan objects are displayed under OS set.
Operating systems that are part of the selected set are displayed under Set composition.
Page top
Viewing the table of external systems
Users with the Security auditor role can view the table of external systems.
The table of external systems is in the External systems section of the application web interface window.
The Certificate fingerprint field displays the fingerprint of the TLS certificate of the Central Node server.
The Server list table contains the following information:
- Sensor—IP address or domain name of the external system server.
- Type—Type of external system (mail sensor or other system).
- Name—Name of the integrated external system that is not a mail sensor.
A dash is displayed in this column for a mail sensor.
- ID—ID of the external system.
- Certificate fingerprint—Fingerprint of the TLS certificate of the server with the external system used to establish an encrypted connection with the Central Node server.
The certificate fingerprint of the server with the Central Node component is displayed in the upper part of the window in the Certificate fingerprint field.
- State—State of the integration request.
Users with the Senior security officer and Security officer roles cannot view the table of external systems.
Page top
Managing user-defined Sandbox rules
Users with the Senior security officer and Administrator roles can create rules for scanning files and URLs in their user environments. If no rules are added, objects are not sent for scanning.
You can create, edit, delete, enable, or disable rules. File scanning rules can also be imported and exported.
To send objects for scanning in preset images, you do not need to create rules. By default, Kaspersky Anti Targeted Attack Platform sends objects that need to be scanned for scanning.
In distributed solution mode, you must create rules for scanning files in custom environments on each PCN and SCN server from which you want to send files for scanning.
Users with the Security auditor role can view the list of rules. Users with the Security officer role cannot view this section.
Page top
Viewing the table of user-defined Sandbox rules
To view the table of user-defined Sandbox rules:
- In the window of the application web interface, select the Custom rules section, Sandbox subsection.
- Open the Files or URLs tab.
The table of user-defined Sandbox rules for file or URL scanning is displayed.
The table of user-defined rules for file scanning contains the following information:
- Created is the rule creation time.
- Virtual machine is the name of the virtual machine to which files are sent for scanning.
- Mask is the mask of files sent for scanning.
- Mask exclusion is the mask of files that are excluded from scanning.
- File category are categories of files sent for scanning.
- State is the state of the rule. It can have the values Enabled and Disabled.
The table of user-defined URL scanning rules contains the following information:
- Created is the rule creation time.
- Virtual machine is the name of the virtual machine to which files are sent for scanning.
- State is the state of the rule. It can have the values Enabled and Disabled.
Configuring the Sandbox rule table display
You can show or hide columns and change the order of columns in the table.
To configure the table display:
- In the window of the application web interface, select the Custom rules section, Sandbox subsection.
- Open the Files or URLs tab.
The table of user-defined Sandbox rules for file or URL scanning is displayed.
- In the heading part of the table, click .
This opens the Customize table window.
- If you want to show a column in the table, select the check box next to the name of the parameter that you want displayed in the table.
If you want to hide a parameter in the table, clear the check box.
At least one check box must be selected.
- If you want to change the order of columns in the table, move the mouse cursor to the row with the relevant parameter, click and move the row to its new place.
- If you want to restore default table display settings, click Default.
- Click Apply.
The rule table display is configured.
Page top
Filtering and searching Sandbox rules
To filter or search for Sandbox rules by required criteria:
- In the window of the application web interface, select the Custom rules section, Sandbox subsection.
- Open the Files or URLs tab.
- Depending on the filtering criterion, do the following:
The table displays only rules that match the specified criteria.
You can use multiple filters at the same time.
Clearing a Sandbox rule filter
To clear the Sandbox rule filter for one or more filtering criteria:
- In the window of the application web interface, select the Custom rules section, Sandbox subsection.
- Open the Files or URLs tab.
- Click to the right of that column heading of the rule table for which you want to clear filtering criteria.
If you want to clear multiple filter conditions, take steps to clear each filter condition individually.
The selected filters are cleared.
The table displays only rules that match the specified criteria.
Viewing the information of a user-defined Sandbox rule
To view the information of a user-defined Sandbox rule:
- In the window of the application web interface, select the Custom rules section, Sandbox subsection.
- Open the Files or URLs tab.
- Select the rule for which you want to view information.
This opens a window containing information about the rule.
The window with information about the user-defined file scanning rule contains the following information:
- State is the state of the prevention rule.
- Virtual machine is the virtual machine on which files are scanned in accordance with this rule.
- Mask is the mask of files sent for scanning.
- Mask exclusion is the mask of files that are excluded from scanning.
- File category are categories of files that are sent for scanning.
- File size is the size of the files being scanned.
The window with information about the user-defined URL scanning rule contains the following information:
- Virtual machine is the virtual machine on which URLs are scanned.
- State is the state of the prevention rule.
Creating a user-defined Sandbox rule for scanning files
To add a user-defined Sandbox rule for file scanning:
- In the window of the application web interface, select the Custom rules section, Sandbox subsection.
- Open the Files tab.
- Click Add.
- Select Create rule.
This opens the rule creation window.
- Configure the following settings:
- State is the state of the prevention rule. Select the check box if you want to enable the rule.
- Virtual machine is the virtual machine on which files will be scanned in accordance with this rule.
Only virtual machines with custom operating system images can be selected. These virtual machines must belong to the set of operating systems selected on the Central Node.
- Specify at least one of following values: mask or category of a file. If you fill in all the fields, the rule is triggered for files that match the category and size conditions or mask and size conditions, and are not exclusions.
- Mask is the mask of files that you want to send for scanning. You can specify multiple values.
To specify a mask, you can use the * and ? wildcard characters. Other wildcard characters are not supported.
- Mask exclusion is the mask of files that must be excluded from scanning. You can specify multiple values.
To specify an exclusion mask, you can use the * and ? wildcard characters. Other wildcard characters are not supported.
- File category are categories of files that you want to send for scanning. You can specify multiple categories.
You can view the full list of extensions for each category in the List of extensions for file categories section.
- File size is the size of the files being scanned.
- If you want to set multiple ranges, click Add file size.
- Mask is the mask of files that you want to send for scanning. You can specify multiple values.
- Click Add.
The rule is created.
If you want to send an archive for scanning, you must take into account the special considerations involved in scanning archives.
Archives are scanned as follows:
- Kaspersky Anti Targeted Attack Platform unpacks the archive.
- Files from the archive that match the rule are sent for scanning.
Files with the MSI extension are scanned in the same way as archives.
Page top
Creating a user-defined Sandbox rule for URL scanning
To add a user-defined Sandbox rule for URL scanning:
- In the window of the application web interface, select the Custom rules section, Sandbox subsection.
- Open the URLs tab.
- Click Add.
- Select Create rule.
This opens the rule creation window.
- Configure the following settings:
- Virtual machine is the virtual machine on which URLs will be scanned.
Only virtual machines with custom operating system images can be selected. These virtual machines must belong to the set of operating systems selected on the Central Node.
- State is the state of the prevention rule. Select the check box if you want to enable the rule.
- Virtual machine is the virtual machine on which URLs will be scanned.
- Click Add.
The rule is created.
Page top
Copying a user-defined Sandbox rule
To copy a user-defined Sandbox rule:
- In the window of the application web interface, select the Custom rules section, Sandbox subsection.
- Open the Files or URLs tab.
- Select the relevant rule.
- In the rule window, click Duplicate.
The rule is copied with all settings. You can change the values of settings if necessary.
Page top
Importing user-defined Sandbox rules for file scanning
To import user-defined Sandbox rules for file scanning:
- In the window of the application web interface, select the Custom rules section, Sandbox subsection.
- Open the Files tab.
- Click Add.
- Select Import rules.
- This opens the file upload window.
- Select the file that you want to import.
- Click Open.
The file is imported.
Page top
Editing a user-defined Sandbox rule
To edit a user-defined Sandbox rule:
- In the window of the application web interface, select the Custom rules section, Sandbox subsection.
- Open the Files or URLs tab.
The table of user-defined Sandbox rules for file or URL scanning is displayed.
- Select a rule.
This opens the rule editing window.
You can edit the following fields:
- In the user-defined Sandbox rules for scanning files:
- State is the state of the prevention rule. Select the check box if you want to enable the rule.
- Virtual machine is the virtual machine on which files will be scanned in accordance with this rule.
Only virtual machines with custom operating system images can be selected. These virtual machines must belong to the set of operating systems selected on the Central Node.
- Specify at least one of following values: mask or category of a file. If you fill in all the fields, the rule is triggered for files that match the category and size conditions or mask and size conditions, and are not exclusions.
- Mask is the mask of files that you want to send for scanning. You can specify multiple values.
To specify a mask, you can use the * and ? wildcard characters. Other wildcard characters are not supported.
- Mask exclusion is the mask of files that must be excluded from scanning. You can specify multiple values.
To specify an exclusion mask, you can use the * and ? wildcard characters. Other wildcard characters are not supported.
- File category are categories of files that you want to send for scanning. You can specify multiple categories.
You can view the full list of extensions for each category in the List of extensions for file categories section.
- File size is the size of the files being scanned.
If you want to set multiple ranges, click Add file size.
- Mask is the mask of files that you want to send for scanning. You can specify multiple values.
- In the user-defined Sandbox rules for scanning URLs:
- Virtual machine is the virtual machine on which URLs will be scanned.
Only virtual machines with custom operating system images can be selected. These virtual machines must belong to the set of operating systems selected on the Central Node.
- State is the state of the prevention rule. Select the check box if you want to enable the rule.
- Virtual machine is the virtual machine on which URLs will be scanned.
Enabling or disabling user-disabling Sandbox rules
To enable or disable a Sandbox rule:
- In the window of the application web interface, select the Custom rules section, Sandbox subsection.
- Open the Files or URLs tab.
The table of user-defined Sandbox rules for file or URL scanning is displayed.
- In the row with the relevant rule, select or clear the check box in the State column.
The rule is enabled or disabled.
To enable or disable the use of all or multiple Sandbox rules:
- In the window of the application web interface, select the Custom rules section, Sandbox subsection.
- Open the Files or URLs tab.
The table of user-defined Sandbox rules for file or URL scanning is displayed.
- Select the check boxes on the left of the rules whose use you want to enable or disable.
You can select all rules by selecting the check box in the row containing the headers of columns.
A control panel appears in the lower part of the window.
- Click Enable or Disable to enable or disable selected rules.
Selected rules are enabled or disabled.
Page top
Exporting user-defined Sandbox rules for file scanning
To export user-defined Sandbox rules for object scanning:
- In the window of the application web interface, select the Custom rules section, Sandbox subsection.
- Open the Files tab.
- Click Export.
The rules file is saved to your local computer. The file is downloaded in the JSON format.
Page top
Deleting user-defined Sandbox rules
Users with the Senior security officer role can delete one or more user-defined Sandbox rules, or all rules at the same time.
To delete a user-defined Sandbox rule:
- In the window of the application web interface, select the Custom rules section, Sandbox subsection.
- Open the Files or URLs tab.
The table of user-defined Sandbox rules for file or URL scanning is displayed.
- Select the rule that you want to delete.
This opens a window containing information about the rule.
- Click Delete.
This opens the action confirmation window.
- Click Yes.
The rule is deleted.
To delete all or multiple user-defined Sandbox rules:
- In the window of the application web interface, select the Custom rules section, Sandbox subsection.
- Open the Files or URLs tab.
The table of user-defined Sandbox rules for file or URL scanning is displayed.
- Select the check boxes on the left of the rules that you want to delete.
You can select all rules by selecting the check box in the row containing the headers of columns.
A control panel appears in the lower part of the window.
- Click Delete.
This opens the action confirmation window.
- Click Yes.
The selected rules will be deleted.
Page top
List of extensions for file categories
Extensions for file categories are listed in the table below.
Extensions for file categories
Category |
Extensions |
|---|---|
1C |
.epf, .ert, .erf, .cf, .dt, .deb, .bsl, .os, .ertx, .xls, .xml, .html, .txt, .cfu, .rptdesign, .xdt, .xslt, .wsdl |
Adobe Flash Player |
.swf, .fla, .flv, .f4v, .f4p, .f4a, .f4b, .mxml, .as, .asc, .ascs, .asv, .fxp, .fxpl, .xfl, .swc, .cfx, .spl, .dcr, .dir, .dxr, .aam, .swz |
Java |
.jar, .class, .war, .ear, .jad, .jnlp, .ser, .jsp, .jspx, .properties, .policy |
Html |
.html, .htm, .shtml, .xhtml, .xml, .svg, .mathml, .rss, .atom, .json, .mht, .mhtml, .webarchive |
Network packet |
.pcap, .pcapng, .cap, .netcap, .etl, .erf, .pkts, .pkt, .tcpdump, .snoop, .ngc, .dump, .cat, .smb, .vpcap, .dmp, .shb, .npl, .nfcapd, .wcap, .arpd, .pc, .tr1, .tr2, .trace |
SAP |
.abap, .adt, .bak, .cct, .cdp, .cpf, .dsc, .erd, .glo, .grc, .lis, .log, .lsa, .msg, .olap, .pgm, .prd, .sap, .sd, .se, .so, .spf, .tpz, .trc, .trex, .ttx, .wri, .xlf |
XML |
.xml, .xsl, .xslt, .rdf, .rss, .opf, .svg, .wsdl, .xhtml, .xjb, .xmi, .xpl, .xsl-fo, .xquery, .xsd, .dtd, .xht, .atom, .mathml, .mml, .plist, .xul, .fodt, .fo, .mxf, .xspf, .gpx, .unity, .ac, .ad, .aw, .ccxml, .csd, .dms, .epub, .fxml, .glb, .glTF, .glTF-Binary, .gml, .iif, .imdi, .jelly, .kml, .mrc, .msh, .mshxml, .mtl, .nib, .nws, .nzb, .osdx, .owl, .pbix, .plistxml, .ptx, .qti, .rdfxml, .rl, .rng, .ros, .rpj, .scml, .scxml, .shex, .sketch, .soap, .srdf, .srx |
Archive |
.snb, .apk, .mht, .crx, .dd, .r01, .mpkg, .pup, .tbz, .ace, .arj, .bin, .cab, .cbr, .deb, .exe, .gzip, .one, .pak, .pkg, .ppt, .rpm, .sh, .sib, .sis, .sisx, .sit, .sitx, .spl, .tar-gz, .xar, .zipx, .zip, .rar, .7z, .tar, .gz, .bz2, .xz, .tgz, .tbz2, .txz, .z, .jar, .war, .ear, .iso, .img |
Audio |
.a52, .adt, .dct, .dss, .dvf, .iklax, .ivs, .rm, .rmvb, .8svx, .amb, .avr, .cdda, .cvs, .cvsd, .cvu, .dts, .dvms, .fap, .fssd, .gsrt, .hcom, .htk, .ima, .ircam, .maud, .nist, .paf, .prc, .pvf, .sd2, .smp, .snd, .sndr, .sndt, .sou, .sph, .spx, .tta, .txw, .vms, .voc, .vox, .w64, .wv, .wve, .ac3, .aob, .asf, .aud, .bin, .bwg, .cdr, .gpx, .ics, .m, .m3u, .mod, .mpp, .msc, .msv, .mts, .nkc, .ps, .sdf, .sib, .sln, .spl, .srt, .temp, .vb, .wave, .wm, .wpd, .xsb, .xwb, .mpc, .aac, .flac, .m4a, .mmf, .mp3, .ogg, .wav, .wma, .mid, .amr, .ape, .au, .caf, .gsm, .oma, .qcp, .vqf, .ra, .aif, .mp2, .m4p, .awb, .m4r, .ram, .asx, .mpga, .aiff, .koz, .m4b, .kar, .iff, .midi, .3ga, .opus, .aup, .xspf, .aifc, .rta, .cda, .m3u8, .mpa, .aa, .aax, .oga, .nfa, .adpcm, .cdo, .flp, .aimppl, .4mp, .mui |
Video |
.drc, .f4a, .f4b, .f4p, .gifv, .mng, .mp2, .mpe, .mpv, .nsv, .roq, .svi, .3gp2, .3gpp2, .asx, .bin, .dat, .drv, .gtp, .moov, .spl, .stl, .vcd, .vid, .wm, .yuv, .hevc, .m2v, .mjpeg, .wtv, .avi, .mpeg, .m4v, .mov, .mp4, .wmv, .mpg, .swf, .3gp, .3g2, .mkv, .ogv, .webm, .asf, .ts, .mxf, .rm, .thp, .mts, .rmvb, .f4v, .mod, .vob, .h264, .flv, .3gpp, .divx, .qt, .amv, .dvsd, .m2ts, .ifo, .mswmm, .srt, .cpi, .wlmp, .vpj, .ced, .vep, .veg, .264, .dav, .pds, .dir, .arf, .mepx, .xesc, .bik, .nfv, .tvs, .imoviemobile, .rcproject, .esp3, .vproj, .aep, .camproj, .camrec, .cmproj, .cmrec, .modd, .mproj, .osp, .trec, .g64, .vro, .braw, .mse, .pz |
Document |
.sxi, .odg, .svg, .vsd, .eps, .cwk, .wp, .ott, .asp, .cdd, .cpp, .dotm, .gpx, .indd, .kdc, .kml, .mdb, .mdf, .mso, .one, .pkg, .pl, .pot, .potm, .potx, .ppsm, .ps, .sdf, .sgml, .sldm, .xar, .xlt, .xltm, .xltx, .pdf, .txt, .doc, .odt, .xps, .chm, .rtf, .sxw, .docx, .wpd, .wps, .docm, .hwp, .pub, .xml, .log, .oxps, .vnt, .dot, .pages, .m3u, .dotx, .shs, .msg, .odm, .pmd, .vmg, .eml, .tex, .wp5, .csk, .fdxt, .adoc, .afpub, .tcr, .acsm, .opf, .mbp, .apnx, .cbt, .vbk, .kfx, .lrf, .snb, .odp, .ppt, .pptx, .pps, .ppsx, .pptm, .key, .flipchart, .epub, .mobi, .azw, .azw3, .fb2, .djvu, .cbz, .cbr, .ibooks, .lit, .pdb, .prc, .tr2, .tr3, .ods, .xls, .xlsx, .csv, .wks, .xlsm, .xlsb, .xlr, .wk3, .numbers |
Image |
.dib, .pdf, .mrw, .icns, .wdp, .fig, .epsf, .cur, .erf, .fts, .heif, .jfif, .jpe, .jps, .mng, .pam, .pbm, .pes, .pfm, .picon, .pnm, .ppm, .ras, .rw2, .sgi, .x3f, .xbm, .xpm, .xwd, .art, .arw, .bmp, .cr2, .crw, .dcm, .dds, .djvu, .dng, .exr, .fpx, .gif, .ico, .jpg, .jp2, .jpeg, .nef, .orf, .pcd, .pcx, .pef, .pgm, .pict, .png, .psd, .raf, .sfw, .tga, .tiff, .wbmp, .xcf, .yuv, .kdc, .pct, .sr2, .tif, .hdr, .webp, .nrw, .plist, .ithmb, .thm, .pspimage, .mac, .heic, .rwl, .flif, .avif, .raw, .pictclipping, .jxr, .emf, .eps, .svg, .wpg, .ai, .svgz, .wmf, .odg, .cdr, .vsd, .std, .pd, .emz, .mix, .otg, .cvs, .gvdesign |
Android executable file |
.apk, .aab, .dex, .so, .jar, .aar, .class, .obb, .odex, .vdex, .vmx, .vmem, .img |
Windows executable file |
.cgi, .ds, .air, .cpp, .gadget, .hta, .jar, .msu, .paf.exe, .pwz, .thm, .vbs, .exe, .msi, .bat, .cmd, .com, .pif, .scr, .vb, .vbe, .js, .jse, .ws, .wsf, .wsh, .ps1, .psm1, .psd1, .ps1xml, .psc1, .scf, .lnk |
Executable file |
.rc, .p, .d, .asc, .bas, .cbl, .vbp, .iwb, .pb, .yml, .pika, .s19, .xt, .suo, .fsproj, .pbj, .pbxuser, .pyw, .xq, .cd, .sb, .sb2, .ise, .kv, .cod, .nib, .pwn, .b, .hpp, .apa, .bet, .bluej, .erb, .fxc, .m4, .owl, .sma, .trx, .vc, .def, .xap, .o, .pas, .qpr, .resources, .vbproj, .vbx, .xib, .md, .ccc, .wwp, .ss, .asf, .asm, .asp, .cfm, .dot, .dtd, .fla, .ged, .gv, .icl, .jse, .lua, .m, .mb, .mdf, .mod, .msp, .obj, .pkg, .po, .pot, .pub, .rss, .sln, .so, .vbe, .vbs, .vc4, .vcproj, .vcxproj, .wsc, .xcodeproj, .xsd, .c, .class, .cpp, .cs, .css, .go, .h, .htaccess, .html, .java, .json, .kml, .sql, .swift, .vb, .yaml, .sh, .bat, .cmd, .ps1, .py, .pl, .rb, .js, .ts, .php, .jsp, .aspx, .cgi, .jar |
Disk image |
.img, .cue, .dsk, .vmdk, .vhd, .vhdx, .tc, .crypt, .dmgpart, .sparsebundle, .xva, .cif, .pqi, .udf, .fvd, .arc, .fcd, .gi, .giz, .ima, .udif, .vdi, .vim, .wim, .b5t, .b6t, .bin, .bwi, .bwt, .ccd, .cdi, .cdr, .dmg, .i00, .i01, .i02, .iso, .isz, .md0, .md1, .md2, .mdf, .mds, .nrg, .pdi, .po, .rom, .sub, .tib, .toast, .vc4, .vcd |
Windows event log |
.evt, .evtx, .log, .txt, .xml |
Windows registry file |
.reg, .dat, .pol, .hiv, .srd |
Font |
.bin, .ps, .sfd, .fnt, .afm, .ttf, .otf, .woff, .woff2, .eot, .svg, .dfont, .pfa, .pfb, .pfm, .fon, .suit, .bdf, .pcf, .snf, .ufo, .lib, .cff |
Database file |
.bup, .csv, .json, .xml, .myi, .sqlplan, .abs, .abx, .ac, .accdb, .accdc, .accde, .accdr, .accdt, .accdw, .accft, .adb, .ade, .adf, .adn, .adp, .alf, .anb, .approj, .aq, .ask, .bacpac, .bak, .btr, .caf, .cat, .cdb, .chck, .ckp, .cma, .cpd, .crypt, .dab, .dacpac, .dad, .daschema, .db, .db-journal, .db-shm, .db-wal, .db2, .db3, .dbc, .dbf, .dbs, .dbt, .dbv, .dbx, .dcb, .dct, .dcx, .ddl, .dlis, .dp1, .dqy, .dsk, .dsn, .dtsx, .dxl, .eco, .ecx, .edb, .epim, .erx, .exb, .fcd, .fdb, .fic, .frm, .ftb, .gdb, .grdb, .gwi, .hdb, .his, .ib, .ibd, .icdb, .idb, .ihx, .ipj, .itdb, .itw, .jet, .jtx, .kdb, .lgc, .lwx, .maf, .maq, .mar, .marshal, .mas, .mav, .maw, .mdb, .mdbhtml, .mdf, .mdn, .mdt, .mfd, .mpd, .mrg, .mud, .mwb, .myd, .ndf, .nnt, .ns2, .ns3, .ns4, .nsf, .nv2, .nwdb, .nyf, .odb, .odl, .oqy, .ora, .orx, .owc, .pan, .pdb, .pdm, .pnz, .pqa, .pvoc, .qry, .qvd, .rbf, .rctd, .realm, .rod, .rsd, .sbf, .scx, .sdb, .sdc, .sdf, .sis, .spq, .sql, .sqlite, .sqlite3, .sqlitedb, .te, .temx, .tmd, .tps, .trc, .trm, .tvdb, .udb, .udl, .vis, .vvv, .wdb, .wmdb, .wrk, .xdb, .xld, .xmlff |
Sending notifications
Users with the Administrator, Senior security officer, or Security officer roles can configure forwarding of notifications to one or multiple email addresses.
You can create notifications about alerts and system health.
Notifications contain a link to the application web interface. Make sure that the name assigned to the Central Node server for use by DNS servers is correct and can be resolved by the DNS server. If the name is incorrect or if the DNS server cannot resolve it, the link to the web interface in the notification will not work.
Users with the Security auditor role can view the list of rules for sending notifications, the properties of a selected rule, and the mail server connection settings, but cannot edit them.
For notifications to be sent to an email address correctly, you must first configure the connection to the mail server. The connection must be configured by the Administrator.
Viewing the table of rules for sending notifications
Rules for sending notifications are displayed in the Settings section, Notifications subsection of the application web interface window.
The table of rules for sending notifications contains the following information:
- Type is the type of rule for sending notifications.
The following types of rules are possible:
- Detections is a rule for sending a notification about detections.
- Component health is a rule for sending a notification about the operation of application components.
- Subject—Subject of the message containing the notification.
- To—Email addresses to which the notifications are sent.
- State—Status of the rule for sending a notification.
Creating a rule for sending notifications about alerts
To create a rule for sending notifications about alerts:
- In the main window of the application web interface, select the Settings section, Notifications subsection.
- Go to the Notification rules tab.
- Click Add.
This opens the New rule window.
- In the To field, enter one or multiple email addresses to which you want to send notifications.
You can enter several email addresses if you separate them with commas.
- In the Subject field, enter the subject of the notification message.
- If you want the application to insert the alert importance into the message subject, add the
%importance%macro to the Subject field. - In the Notification type field, select Detections.
- In the Detection importance drop-down list, select the minimum alert importance for which you want notifications to be sent.
For example, you can configure forwarding of notifications for only alerts that have high importance, or for only those that have medium or high importance.
- In the Source or destination field, enter an IP address and network mask if you want to send notifications about alerts associated with a specific source or destination IP address or subnet address.
- In the Email field, enter an email address if you want to send notifications about alerts associated with a specific email sender or recipient address.
- Under Components, select check boxes next to the names of one or multiple technologies if you want to send notifications about alerts generated by specific technologies.
- Click Add.
The rule for sending notifications about alerts will be added to the list of rules. To send notifications to the specified email address, you must enable the notification rule. Notifications are sent once to each of the email addresses configured for this rule.
Users with the Administrator and Security auditor roles cannot create rules for sending alert notifications.
In distributed solution mode, you must create notifications separately for each subordinate server (Secondary Central Node, SCN).
Creating a rule for sending notifications about the operation of application components
To create a rule for sending notifications about the operation of application components:
- In the main window of the application web interface, select the Settings section, Notifications subsection.
- Go to the Notification rules tab.
- Click Add.
This opens the New rule window.
- In the To field, enter one or multiple email addresses to which you want to send notifications.
You can enter several email addresses if you separate them with commas.
- In the Subject field, enter the subject of the notification message.
- If you want the application to insert the alert importance into the message subject, add the
%importance%macro to the Subject field. - In the Notification type field, select Component health.
- Under Components, select check boxes next to the names of the application's functional areas for which you want to receive notifications.
- Click Add.
The rule for sending notifications about the operation of application components is added to the list of rules. To send notifications to the specified email address, you must enable the notification rule. Notifications are sent once to each of the email addresses configured for this rule.
Users with the Security auditor role cannot create rules for sending notifications about application operation.
In distributed solution mode, notifications are configured separately for each subordinate server (Secondary Central Node, SCN).
Enabling and disabling a rule for sending notifications
To enable or disable a rule for sending notifications about alerts:
- In the main window of the application web interface, select the Settings section, Notifications subsection.
- Go to the Notification rules tab.
- In the State column, enable or disable the rule for sending notifications using the toggle switch next to the rule.
The state of the rule for sending notifications about alerts will be modified.
Users with the Security auditor role cannot enable or disable notification rules.
Modifying a rule for sending notifications
To edit a rule for sending notifications:
- In the main window of the application web interface, select the Settings section, Notifications subsection.
- Go to the Notification rules tab.
- In the list of rules for sending notifications, select the rule that you want to modify.
This opens the Edit rule window.
- Make the relevant changes.
- Click Save.
The rule for sending notifications will be modified.
Users with the Security auditor role cannot edit rules for sending notifications.
Deleting a rule for sending notifications
To delete a rule for sending notifications:
- In the main window of the application web interface, select the Settings section, Notifications subsection.
- Go to the Notification rules tab.
- Select the check box to the left of the name of each rule that you want to delete.
If you want to delete all rules, select the check box above the list.
- Click Delete in the lower part of the window.
- In the confirmation window, click Yes.
The selected rules will be deleted.
Users with the Security auditor role cannot delete rules for sending notifications.
Filtering and searching notification forwarding rules by rule type
To filter or search notification rules by rule type:
- In the main window of the application web interface, select the Settings section, Notifications subsection.
- Go to the Notification rules tab.
- Click the
 icon in the table of rules for sending notifications.
This opens the filter configuration window.
- Select one of the following options:
- All.
- Alerts.
- Component health.
The table of notification forwarding rules will display only rules that match the filter criteria you have set.
You can use multiple filters at the same time.
Filtering and searching notification forwarding rules based on the notification subject
To filter or search for notification rules by notification subject:
- In the main window of the application web interface, select the Settings section, Notifications subsection.
- Go to the Notification rules tab.
- Click the Subject link to open the filter configuration window.
- Enter one or several characters of the notification subject.
- Click Apply.
The filter configuration window closes.
The table of notification forwarding rules will display only rules that match the filter criteria you have set.
You can use multiple filters at the same time.
Filtering and searching notification forwarding rules by email address
To filter or search for notification rules by destination email address:
- In the main window of the application web interface, select the Settings section, Notifications subsection.
- Go to the Notification rules tab.
- Click the To link to open the filter configuration window.
- Enter one or several characters of the email address.
- Click Apply.
The table of notification forwarding rules will display only rules that match the filter criteria you have set.
You can use multiple filters at the same time.
Filtering and searching notification forwarding rules based on their state
To filter or search for notification rules by status:
- In the main window of the application web interface, select the Settings section, Notifications subsection.
- Go to the Notification rules tab.
- Click the State link to open the filter configuration window.
- Select one or several check boxes next to the values of statuses:
- Enabled
- Disabled
- Click Apply.
The filter configuration window closes.
The table of notification forwarding rules will display only rules that match the filter criteria you have set.
You can use multiple filters at the same time.
Clearing a notification forwarding rule filter
To clear the notification rule filter for one or more filtering criteria:
- In the main window of the application web interface, select the Settings section, Notifications subsection.
- Go to the Notification rules tab.
- Click to the right of the header of the column in the notification forwarding rules table for which you want to clear the filter conditions.
If you want to clear several filter conditions, perform the necessary actions to clear each filter condition.
The selected filters are cleared.
The table of notification forwarding rules will display only rules that match the filter criteria you have set.
Managing logs
This section contains information about managing the logs of Kaspersky Anti Targeted Attack Platform.
In the Kaspersky Anti Targeted Attack Platform web interface, you can manage the following logs:
- User activity log. Users with the Administrator role can manage the log. Users with the Security auditor role can download the log.
- User activity log for the NDR functionality. Users with the Administrator role can manage the log. Users with the Security auditor role can view the log.
Managing the activity log
Some user actions in the application web interface can cause errors in the operation of Kaspersky Anti Targeted Attack Platform. You can enable logging of user action information in the application web interface and if necessary, view the information by downloading log files.
Enabling and disabling the recording of information in the activity log
To enable or disable the logging of information about user actions in the Kaspersky Anti Targeted Attack Platform web interface to the activity log:
- Select the Logs section, User activity subsection in the application web interface.
- Do one of the following:
- Set the Event logging toggle switch to the Enabled position if you want to enable the logging of information about user actions in the application web interface.
- Set the Event logging toggle switch to the Disabled position if you want to disable the logging of information about user actions in the application web interface.
This function is enabled by default.
Information about user actions is recorded in the user_actions.log file, which is stored on the Central Node server in the /data/storage/volumes/siem_proxy/log-user-actions/ directory. By default, records in this file are kept for 90 days, after which they are deleted.
To view the activity log records, you need to download the user_actions.log file.
You can configure the logging of information about user activity in the application web interface to a remote log. The remote log is saved on the server on which a SIEM system is installed. The settings of integration with the SIEM system must be configured to write to the remote log.
In distributed solution mode, information about user actions in the application web interface is recorded in the log of the same server for which the users are managing the web interface. Information about the actions of PCN server users that affect the settings of SCN servers is recorded in the PCN server log.
Users with the Security auditor role can only view the settings for logging information to the activity log.
Page top
Downloading the activity log file
To download the activity log file:
- Select the Logs section, User activity subsection in the application web interface.
- Click Download.
The file is saved to your local computer in your browser's downloads folder. The file is downloaded as a ZIP archive.
In distributed solution mode, you can download the log file only for the server for which you are managing the web interface.
Page top
Content and properties of CEF messages about user activity in the web interface
The header of each message contains the following information:
- Format version.
Current version number:
0. Current field value:CEF:0. - Vendor.
Current field value:
AO Kaspersky Lab. - Application name.
Current field value:
Kaspersky Anti Targeted Attack Platform. - Application version
Current field value: 7.0.1-500.
- Event type.
See the table below.
- Event name.
See the table below.
- Event importance.
Current field value:
Low.Example:
CEF:0|AO Kaspersky Lab|Kaspersky Anti Targeted Attack Platform|7.0.1-500|tasks|Managing tasks|Low|
All fields of the CEF message have the "<key>=<value>" format. The keys, as well as their values contained in a message, are presented in the table below.
Event information in CEF messages
Event type |
Event name and description |
Key and description of its value |
|---|---|---|
|
Connecting the Sensor component to the Central Node server, modifying component settings. |
|
|
Connecting the Sandbox component to the Central Node server. |
|
|
Configuring integration with external systems. |
|
|
Configuring participation in Kaspersky Security Network, enabling or disabling the usage of Kaspersky Private Security Network, and configuring integration with Kaspersky Managed Detection and Response. |
|
|
Operations with YARA rules. |
|
|
Operations with IOC rules. |
|
|
Operations with IDS rules. |
|
|
Operations with TAA (IOA) rules. |
|
|
Operations with Sandbox rules. |
|
|
Operations with prevention rules. |
|
|
Operations with scan exclusion rules. |
|
|
Operations with hosts on which the Endpoint Agent component is installed. |
|
|
Operations with tasks. |
|
|
Network isolation of Endpoint Agent hosts. |
|
|
Modifying Central Node server settings. |
|
|
Modifying the settings of Primary Central Node and Secondary Central Node servers in distributed solution and multitenancy mode. |
|
|
Actions on user accounts. |
|
|
Configuring email notifications. |
|
|
Managing the license key. |
|
If an operation is performed on over 30 objects simultaneously, only one entry is logged for this operation. The entry includes the information about the operation and the number of objects on which it was performed.
Page top
Managing the NDR user activity log
This section contains information about managing logs of the NDR functionality.
Users with the Administrator role can manage the log. Users with the Security auditor role can view the log.
Logs are available when using any type of Kaspersky Anti Targeted Attack Platform license key.
Managing log storage settings
You can edit the settings of log record storage in the Central Node database.
To change the log storage settings:
- Log in to the web interface with the application administrator account.
- Select the Sensor servers section.
- Select the card of the Central Node server.
The details area is displayed in the right part of the web interface window.
- Click Edit.
In the details area, tabs are displayed, on which you can manage the settings of the server.
- On the General tab, configure the following settings in the Events, Audit entries, and Application messages sections:
- Use the Max volume setting to set a size limit for stored records. You can select the unit of measure for the value: MB or GB.
When editing this setting, keep in mind the estimated maximum number of records for the specified volume. You also need to take into account that the sum total of all size limits may not exceed the specified maximum storage capacity for the node.
- If necessary, use the Storage time (days) setting to limit the storage duration of records, and specify the duration in days.
- Use the Max volume setting to set a size limit for stored records. You can select the unit of measure for the value: MB or GB.
- Click Save.
Log storage is configured.
Page top
Enabling and disabling user activity audit
You can enable or disable user activity audit for the NDR functionality.
User activity audit is enabled by default.
To enable or disable user activity audit:
- Connect to the Central Node server using the web interface.
- Select the Logs section, Audit subsection.
- Enable or disable user activity audit using the User activity audit switch in the toolbar.
- Wait for the changes to be applied. The switch does not become available again until the transition to the other state is completed.
Viewing user activity audit records
Kaspersky Anti Targeted Attack Platform can save information about actions performed by users of the NDR functionality. Information is saved in the audit log if user activity audit is enabled.
You can view audit records when connecting to the Central Node server using the web interface. If necessary, you can also configure audit records to be sent to third-party systems through connectors.
Only users with the Administrator role can view audit records.
To view audit records:
- Connect to the Central Node server using the web interface.
- Select the Logs section, Audit subsection.
The table displays audit records corresponding to the specified filtering and search conditions.
Audit record settings are displayed in the following columns of the table:
- Date and time.
Date and time when user activity information was recorded.
- Action.
Registered action performed by the user.
- Result.
Result of the registered action (successful or unsuccessful).
- User.
Name of the user that performed the registered action.
- User node.
IP address of the node where the registered action was performed.
- Description.
Additional information about the registered action.
When viewing the table of audit records, you can use the configuration, filtering, searching, and sorting functionality.
Page top
Setting the maximum storage space limit for trace logs
Information about the performance of the NDR functionality is recorded in trace logs. You can limit the storage space occupied by these logs. In this case, when the limit is reached, old trace log files are deleted from the /var/log/kaspersky directory.
Users with the Administrator role can manage log storage. Users with the Security auditor role can view these settings.
To limit the amount of space occupied by trace logs:
- Log in to the web interface with the application administrator account.
- Select the Sensor servers section in the window of the application web interface.
- Click the card of the relevant Sensor component.
- This opens a window with information about the component.
- Click Edit.
- Go to the General tab.
- In the Trace data field, use the Max volume setting to configure the maximum space that the logs can occupy. You can select the unit of measure for the value: MB or GB.
The space occupied by trace logs is limited.
Page top
Setting the maximum storage space limit for trace logs
The statistical logs record metrics of the NDR functionality, such as the number of network packets received. You can limit the storage space occupied by these logs. In this case, when the limit is reached, old statistical log files are deleted from the /var/log/kaspersky directory.
Users with the Administrator role can manage log storage. Users with the Security auditor role can view these settings.
To limit the amount of space occupied by statistical logs:
- Log in to the web interface with the application administrator account.
- Select the Sensor servers section in the window of the application web interface.
- Click the card of the relevant Sensor component.
- This opens a window with information about the component.
- Click Edit.
- Go to the General tab.
- In the Statistical data field, use the Max volume setting to configure the maximum space that the logs can occupy. You can select the unit of measure for the value: MB or GB.
The space occupied by statistical logs is limited.
Page top
Viewing application messages
The message log of the application stores information about errors of the NDR functionality and about operations performed by the system processes of Kaspersky Anti Targeted Attack Platform.
You can view application messages in the web interface. If necessary, you can also configure application messages to be sent to third-party systems through connectors.
Application messages can be viewed by users with the following roles: Administrator, Security auditor, Security officer, or Senior security officer.
To view application messages:
- Log in to the web interface with the application administrator account.
- Select the Settings section, Application messages subsection.
The table displays application messages corresponding to the specified filtering and search conditions.
Application message settings are displayed in the following columns of the table:
- Date and time.
Date and time when the application message was registered.
- Status.
Name of the message status. A message can have one of the following statuses:
- Normal operation for informational messages.
- Unknown, Malfunction for messages about non-critical application errors.
- Moderate malfunction, Critical malfunction, Fatal malfunction for messages about application malfunctions.
- Node.
Name or IP address of the node from which the message arrived.
- System process.
Application process that caused the message to be registered.
- Message.
Numerical identifier and text of the message.
When viewing the table of application messages, you can use the filtering, searching, and sorting functions.
Page top
Viewing information about files that have been sent for scanning to the Kaspersky Anti Targeted Attack Platform
If necessary, you can see if the file has been scanned in Kaspersky Anti Targeted Attack Platform and what the scan result was. To do so, you must get the information about the application's operation using the kata-collect script.
To get the information about the application's operation using the kata-collect script.
- Sign in to the management console of the server for which you want to get information over SSH or through a terminal.
If you are using Kaspersky Anti Targeted Attack Platform in distributed solution and multitenancy mode, you need to perform these steps on each Central Node server. If your organization's infrastructure has separately installed Sensor components, you must also follow these steps on servers that have this component. If the application is deployed as a cluster, you must perform these steps on one of the servers with the 'manager' role in Docker swarm. To view the role of a server, use the
$ docker node lscommand. - When the system prompts you, enter the administrator user name and password that were specified while installing the component.
The application component administrator menu is displayed.
- In the list of sections of the application administrator menu, select the Technical Support Mode section.
- Press Enter.
This opens the Technical Support Mode confirmation window.
- Confirm that you want to manage the application in Technical Support Mode. To do so, select Yes and press Enter.
- Run the script by executing the command:
sudo kata-run.sh kata-collect --output-dir <path>
You can also specify one or multiple parameters for this command (see the table below).
Parameters of the kata-collect utility
Required parameter |
Parameter |
Description |
Yes |
|
Create a directory at the specified path, where <path> is an absolute or relative path of the directory where you want to save the archive with the downloaded data. If no path is specified, the data archive is saved in the /tmp/collect directory by default. |
No |
|
Skip preparing and dumping the prometheus database. This parameter significantly speeds up the script. |
No |
|
Skip downloading the data that is written to the SIEM system. |
No |
|
Download the data written to the SIEM system starting from this date (inclusive). |
No |
|
Download the data written to the SIEM system ending with this date (inclusive). |
Example: Command to get information about the operation of the application with SIEM system data filtered by date and without the prometheus database:
|
When the script finishes, a collect--<archive download date>tar.gz archive is saved to the specified directory. Information about files received for scanning by Kaspersky Anti Targeted Attack Platform is contained in the log, which is located in the /logs/kaspersky/siem/log-history/ directory inside the created archive. If a file was excluded from scanning, information about such a file is also reflected in the log.
You can find any file by its name or MD5 hash.
If the file was obtained by the Sensor component, you can find it by the following fields:
- File source information:
- The source IP address and destination IP address, if the file was obtained from traffic.
- The sender email address and recipient email address, if the file was received by email.
- The IP address and ID of the external system, if the file was received from an external system.
- The IP address and name of the host if the file was received from an Endpoint Agent host.
- The user account name if the file was manually uploaded to Kaspersky Anti Targeted Attack Platform.
- Source type: span, smtp, icap, pop3, external (external system), endpoint (Endpoint Agent host), upload (manually uploaded file).
- For email messages, the Message-ID field is logged.
Special considerations for file information logging
When searching for file information in the log, keep in mind the following special considerations for file information logging:
- File information is logged twice: when the file is obtained from traffic and when the file is scanned. If the Sensor component is installed separately from the Central Node in your infrastructure, the file receipt record goes to the log of the Sensor component, and the file scanning record goes to the log of the Central Node component to which the Sensor is connected. If the Central Node component and the Sensor are installed on the same server, both records are written to the Central Node log.
- For a compound file (for example, an archive or an email message), the hash of the parent file and the name and hash of the child file are logged if the child file was scanned by one of the Kaspersky Anti Targeted Attack Platform technologies.
Examples of apt-history log records for the MD5 hash of a file
Examples of apt-history log records for the MD5 hash of a file are listed in the table below.
Examples of apt-history log records for the MD5 hash of a file
Log record |
Value |
2024-06-11 02:37:03.645586 info apt-history: f0429d4845208857cd303df968ef545e enqueued am, priority: normal |
The file was received for processing using the Anti-Malware Engine technology. |
2024-06-11 02:37:03.647434 info apt-history: external KSMG sensor with ip 10.0.0.0 provide file with name: File_Name 2024/2025, md5: f0429d4845208857cd303df968ef545e, msg_id: <87c13e55e789aa966089b6bf2e8c453b@localhost.localdomain> |
String for objects received for processing in Kaspersky Anti Targeted Attack Platform from Kaspersky Secure Mail Gateway and Kaspersky Security for Linux Mail Server. Information worth paying attention to:
|
2024-06-11 02:37:03.847696 info apt-history: f0429d4845208857cd303df968ef545e engine am result {verdict: CLEAN, bases_version: 202406071010, detect_time: 2024-06-11 02:37:03.841275, rescan_priority: 3, sb_hash: 77f5b6276dd9b1c534b6c9adcff86845, multitask_details: {priority: background, tasks: {pdf: 1}}, scanEngines: [sb]} |
The result of processing the object using the Anti-Malware Engine technology. Includes the status assigned to the object after scanning (CLEAN) and information about the technologies that will be used to additionally scan the object ("scanEngines: [sb]"). Information worth paying attention to:
|
2024-06-11 02:37:03.886784 info apt-history: f0429d4845208857cd303df968ef545e enqueued sb: {pdf: 1}, priority: low, sb_priority: background |
The task was sent to the Sandbox component for processing. Information worth paying attention to:
|
2024-06-11 02:37:04.179597 info apt-history: f0429d4845208857cd303df968ef545e delivered to sb, sb_hash: 77f5b6276dd9b1c534b6c9adcff86845, node: Server_Name, mtask_id: 900 |
The task was sent to the Sandbox component for processing. Information worth paying attention to:
|
2024-06-11 02:38:44.515070 info apt-history: f0429d4845208857cd303df968ef545e sb result received, sb_hash: 77f5b6276dd9b1c534b6c9adcff86845, node: Server_Name, mtask_id: 900, priority: low |
The result of processing the object by the Sandbox component has been received. |
2024-06-11 02:38:44.783370 info apt-history: f0429d4845208857cd303df968ef545e engine sb result {bases_version: 202406102122, detect_time: 2024-06-11 02:38:44.776655, verdict: SILENT, hidden: True, details: [{file: //[From WCR <test@mail.com>][Date 11 Jun 2024 03:51:21][Subj Company_Name 2024/2025]/WCR-form.pdf, images: [{verdicts_info: {ScannerVersion: 1.22.3.34, ...}, hidden: True, verdict: SILENT, sb_id: fb15ec106318b0d54babce2379d956f7, image: Win7_x64, task_id: task0, file: //[From WCR <test@mail.com>][Date 11 Jun 2024 03:51:21][Subj Company_Name 2024/2025]/WCR-form.pdf, file_id: 1, filesize: 445856, md5: 0d87eebc9676214f35046a482150e537, tracing_mode: all_events, store_artifacts: False, bases_version: 202406102122, ids_bases_version: 202406101817, version: 1.22.3.34, suspicious_log: [], network_activity: {http: [], dns: []}}], verdict: SILENT, hidden: True, priority: 150}], md5_list: [], file_list: [], sb_hash: 77f5b6276dd9b1c534b6c9adcff86845, sb_names_map: {0: {md5: , name: }, 1: {md5: 0d87eebc9676214f35046a482150e537, name: //[From WCR <test@mail.com>][Date 11 Jun 2024 03:51:21][Subj Company_Name 2024/2025]/WCR-form.pdf}, 2: {md5: 71072dd9a36d7ce560cebc533ecb3cad, name: }}} |
The result of processing the objects on all virtual machines of the Sandbox component. Information worth paying attention to:
|
2024-06-11 02:38:44.841529 info apt-history: New sb_detect for file alert: {id: 2720, victim: default, state: new, md5: f0429d4845208857cd303df968ef545e} |
Information about the results of processing by the Sandbox component is saved in the application database. Recorded for internal use. This does not indicate that an alert is present in the alerts database of the application. |
Managing Kaspersky Endpoint Agent for Windows
Kaspersky Endpoint Agent is an application that is installed on individual devices in the corporate IT infrastructure. The application continuously monitors processes running on those devices, active network connections, and files that are being modified.
Kaspersky Endpoint Agent enables the interaction of the protected device with other Kaspersky solutions for detection of complex threats, such as targeted attacks.
When the integration of Kaspersky Endpoint Agent with Kaspersky Anti Targeted Attack Platform is configured, the application runs tasks, applies parameters coming from Kaspersky Anti Targeted Attack Platform, and sends telemetry from the protected device to the KATA Central Node server. For more details about what Kaspersky Endpoint Agent can do when integrated with Kaspersky Anti Targeted Attack Platform, see the Operating principle of the application section.
For details about managing Kaspersky Endpoint Agent, see the Online Help of the application:
- Application activation
- Installing and removing the application.
- Managing Kaspersky Endpoint Agent settings using the Kaspersky Security Center Administration Console and the Kaspersky Security Center Web Console:
- Managing policies
- Managing tasks
- Opening the settings window
- Configuring security settings
- Configuring the connection of Kaspersky Endpoint Agent with a proxy server
- Configuring Kaspersky Security Center as a proxy server to activate Kaspersky Endpoint Agent
- Configuring KSN usage in Kaspersky Endpoint Agent
- Configuring storage settings in Kaspersky Endpoint Agent
- Configuring failure diagnostics
- Managing Kaspersky Endpoint Agent using the command line interface:
- Activation management
- Authentication management
- Configuring tracing
- Configuring the creation of dumps of Kaspersky Endpoint Agent processes
- Viewing information about quarantine settings and quarantined objects
- Actions for quarantined objects
- Running Kaspersky Endpoint Agent database and module updates
- Starting, stopping and viewing the current application status
- Password protection of the application
- Protecting application services with the PPL technology
- Managing self-defense settings
- Managing Standard IOC Scan tasks
- Managing file and process scanning in accordance with YARA rules
- Creating a memory dump
- Creating a disk dump
Managing Kaspersky Endpoint Security for Windows
Kaspersky Endpoint Security is an application that is installed on individual devices in the corporate IT infrastructure. The application continuously monitors processes running on those devices, active network connections, and files that are being modified. Information about events on the computer (telemetry) is sent to the Kaspersky Anti Targeted Attack Platform server. Kaspersky Endpoint Security also sends information about threats detected by the application and information about the results of processing these threats to the Kaspersky Anti Targeted Attack Platform server.
When the integration of Kaspersky Endpoint Security with Kaspersky Anti Targeted Attack Platform is configured, the application runs tasks, applies parameters coming from Kaspersky Anti Targeted Attack Platform, and sends telemetry from the protected device to the KATA Central Node server. For more details about what Kaspersky Endpoint Security can do when integrated with Kaspersky Anti Targeted Attack Platform, see the Operating principle of the application section.
For details about managing Kaspersky Endpoint Security, see the Online Help of the application:
- Installing and removing the application.
- Application licensing.
To integrate with Kaspersky Anti Targeted Attack Platform, in addition to the Kaspersky Endpoint Security activation key, you must also add the Kaspersky Endpoint Detection and Response (KATA) Add-on key. For details on application licensing, see Kaspersky Endpoint Security Online Help → Integration with EDR (KATA).
- Integration with EDR (KATA).
- Configuring telemetry.
- Managing the quarantine.
- Commands for managing Detection and Response KATA EDR: Integration with EDR (KATA).
Managing Kaspersky Endpoint Security for Linux
Kaspersky Endpoint Security for Linux is an application that is installed on individual devices running Linux operating systems that are part of the corporate IT infrastructure. The application continuously monitors processes running on those devices, active network connections, and files that are being modified. Information about events on the computer (telemetry) is sent to the Kaspersky Anti Targeted Attack Platform server. Kaspersky Endpoint Security for Linux also sends information about threats detected by the application and information about the results of processing these threats to the Kaspersky Anti Targeted Attack Platform server.
When the integration of Kaspersky Endpoint Security with Kaspersky Anti Targeted Attack Platform is configured, the application runs tasks, applies parameters coming from Kaspersky Anti Targeted Attack Platform, and sends telemetry from the protected device to the KATA Central Node server. For more details about what Kaspersky Endpoint Security can do when integrated with Kaspersky Anti Targeted Attack Platform, see the Operating principle of the application section.
For details about managing Kaspersky Endpoint Security for Linux, see the Online Help of the application:
- Installing, removing, and updating the application.
- Managing the application using the command line:
- License key management: Licensing task (License, ID:9).
- Integration with Kaspersky Anti Targeted Attack Platform: Integration with Kaspersky Endpoint Detection and Response (KATA) task (KATAEDR, ID:24).
- Managing the application using Kaspersky Security Center Web Console and Kaspersky Security Center Cloud Console:
- License key management: for more details, see Managing tasks in Web Console → Creating a task and Task settings → Adding a key.
- Integration with Kaspersky Anti Targeted Attack Platform: for more details, see Managing policies in Web Console → Creating a policy and Policy settings → Integration with Kaspersky Endpoint Detection and Response (KATA).
For integration with Kaspersky Anti Targeted Attack Platform, you do not need to add an additional license key in Kaspersky Endpoint Security for Linux.
Page top
Managing Kaspersky Endpoint Security for Mac
Kaspersky Endpoint Security for Mac is an application that is installed on individual devices running macOS operating systems that are part of the corporate IT infrastructure. The application continuously monitors processes running on those devices, active network connections, and files that are being modified. Information about events on the computer (telemetry) is sent to the Kaspersky Anti Targeted Attack Platform server. Kaspersky Endpoint Security for Mac also sends information about threats detected by the application and information about the results of processing these threats to the Kaspersky Anti Targeted Attack Platform server.
When the integration of Kaspersky Endpoint Security for Mac with Kaspersky Anti Targeted Attack Platform is configured, the application runs tasks, applies parameters coming from Kaspersky Anti Targeted Attack Platform, and sends telemetry from the protected device to the KATA Central Node server. For more details about what Kaspersky Endpoint Security for Mac can do when integrated with Kaspersky Anti Targeted Attack Platform, see the Operating principle of the application section.
For details about managing Kaspersky Endpoint Security for Mac, see the Online Help of the application.
- Installing, removing, and updating the application.
- Application licensing.
To integrate with Kaspersky Anti Targeted Attack Platform, in addition to the Kaspersky Endpoint Security activation key, you must also add the Kaspersky Endpoint Detection and Response (KATA) Add-on key. For more details about application licensing, see Kaspersky Endpoint Security Help → Advanced configuration of the application → Endpoint Detection and Response (KATA).
- Managing the application using the command line:
- Remotely managing the application using Kaspersky Security Center Web Console and Cloud Console:
- For details about license key management, see sections: Create tasks → Configure the Add key task settings.
- For details about integration with Kaspersky Anti Targeted Attack Platform, see sections: Create policies → Configure Detection and Response settings → Configure Endpoint Detection and Response (KATA).
Backing up and restoring data
You can create a backup copy and restore data from it in case of malfunctions or in case you need to reinstall Kaspersky Anti Targeted Attack Platform. You can restore data between Kaspersky Anti Targeted Attack Platform instances based on different operating systems. For example, you can restore data of Ubuntu-based Kaspersky Anti Targeted Attack Platform in Astra Linux-based Kaspersky Anti Targeted Attack Platform, and vice versa.
To create a backup copy of a Central Node server, you can connect to the server over SSH or through a terminal.
The diagram of the process is shown in the figure below.
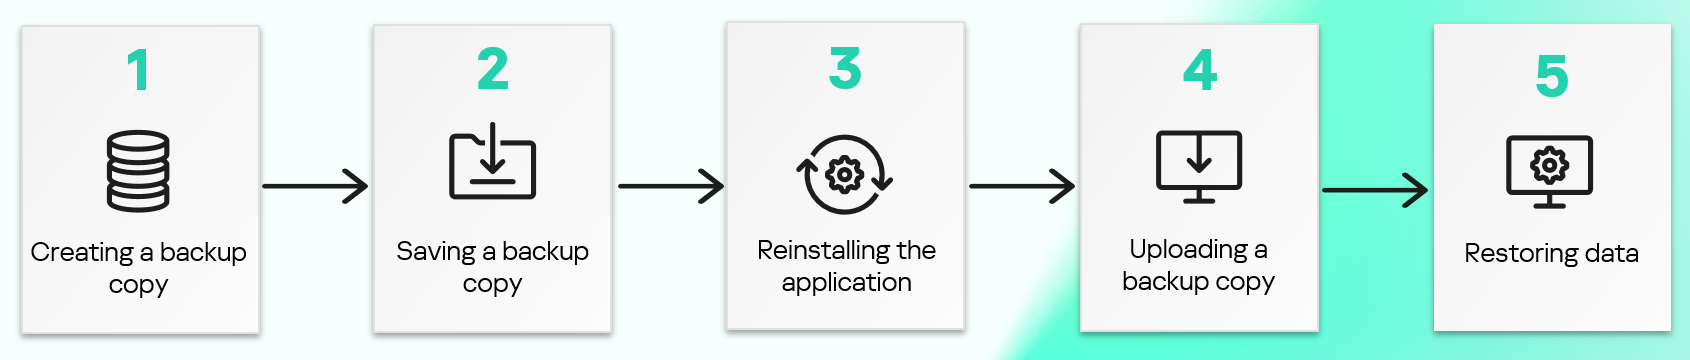
Backing up and restoring data
The version of the application in which data you want to restore data, must be the same as the version of the application on the server where the backup was performed. If the versions of the application do not match, an error message is displayed when restoration is initiated, and the restoration process is terminated.
Backing up and restoring the data of the Central Node server
This scenario describes the procedure for creating and restoring data from backup on a Central Node server.
Backing up and restoring data on the Central Node server involves the following steps:
- Creating a backup copy
You can create a backup copy using the administrator menu or in Technical Support Mode:
- Saving the backup copy to the hard drive
To save the backup copy on the hard drive of your computer, run the following command:
scp <name of the account used for working in the administrator menu and in the server management console>@<IP address of the server>:<name of the backup file of the form: data_kata_<date and time of backup copy creation>.tar>Example:
Command for downloading to the hard drive of your computer a backup copy created on a Central Node server with the IP address 10.0.0.10 under the 'admin' account on April 10, 2020 at 10 hours 00 minutes 00 seconds:
scp admin@10.0.0.10:data_kata_2020_04_10T10_00_00.tarThe backup copy is saved to the current directory on the hard drive of your computer.
- Reinstalling the application
Remove and reinstall Kaspersky Anti Targeted Attack Platform.
- Uploading a backup copy to the server
Upload your backup copy to the Central Node server by running the following command:
scp <name of the backup file of the form: data_kata_<date and time of backup copy creation>.tar> <name of the account used for working in the administrator menu and in the server management console>@<IP address of the server>:Example:
Command for uploading a backup copy created on April 10, 2020 at 10 hours 00 minutes 00 seconds to the Central Node server with the IP address 10.0.0.10 under the 'admin' account:
scp data_kata_2020_04_10T10_00_00.tar admin@10.0.0.10:The backup copy is uploaded to the current directory on the Central Node server.
- Restoring data from a backup copy
You can restore data from a backup copy on the Central Node server using the administrator menu or in Technical Support Mode:
The backup copy of server settings does not contain PCAP files of recorded mirrored network traffic. You can save and restore PCAP files on your own by copying them from the /data/volumes/dumps directory of the connected storage. After restoring data, you must connect your external storage.
If the hardware configuration of the Central Node server on which the backup copy was created differs from the hardware configuration of the server on which you are planning to restore the server settings, you need to reconfigure the application scaling settings after restoring.
Page top
Backing up and restoring the data of the Central Node server deployed as a cluster
This scenario describes the procedure for backing up and restoring data on a Central Node server deployed as a cluster.
Backing up and restoring data on the Central Node server deployed as a cluster involves the following steps:
- Creating a backup copy
You can create a backup copy using the administrator menu or in Technical Support Mode:
- Saving the backup copy to the hard drive
To save the backup copy on the hard drive of your computer, run the following command:
scp <name of the account used for working in the administrator menu and in the server management console>@<IP address of the server>:<name of the backup file of the form: data_kata_<date and time of backup copy creation>.tar>Example:
Command for downloading to the hard drive of your computer a backup copy created on a Central Node server with the IP address 10.0.0.10 under the 'admin' account on April 10, 2020 at 10 hours 00 minutes 00 seconds:
scp admin@10.0.0.10:data_kata_2020_04_10T10_00_00.tarThe backup copy is saved to the current directory on the hard drive of your computer.
- Reinstalling the application
Remove and reinstall Kaspersky Anti Targeted Attack Platform.
- Uploading a backup copy to the server
Upload your backup copy to the Central Node server by running the following command:
scp <name of the backup file of the form: data_kata_<date and time of backup copy creation>.tar> <name of the account used for working in the administrator menu and in the server management console>@<IP address of the server>:Example:
Command for uploading a backup copy created on April 10, 2020 at 10 hours 00 minutes 00 seconds to the Central Node server with the IP address 10.0.0.10 under the 'admin' account:
scp data_kata_2020_04_10T10_00_00.tar admin@10.0.0.10:The backup copy is uploaded to the current directory on the Central Node server.
- Restoring data from a backup copy
You can restore data from a backup copy on the Central Node server using the administrator menu or in Technical Support Mode:
The backup copy of server settings does not contain PCAP files of recorded mirrored network traffic. You can save and restore PCAP files on your own by copying them from the /data/volumes/dumps directory of the connected external storage. After restoring data, you must connect your external storage.
If the hardware configuration of the Central Node server on which the backup copy was created differs from the hardware configuration of the server on which you are planning to restore the server settings, you need to reconfigure the application scaling settings after restoring.
Page top
Backing up and restoring the data of the Central Node server in distributed solution and multitenancy mode
This scenario describes the procedure for backing up and restoring data on Central Node servers deployed in distributed solution or multitenancy mode.
To back up and restore data when using the distributed solution and multitenancy mode, you must connect to each Central Node server in the hierarchy and follow the steps of the instructions below.
Backing up and restoring data on Central Node servers deployed in distributed solution or multitenancy mode involves the following steps:
- Creating a backup copy
You can create a backup copy using the administrator menu or in Technical Support Mode:
- Saving the backup copy to the hard drive
To save the backup copy on the hard drive of your computer, run the following command:
scp <name of the account used for working in the administrator menu and in the server management console>@<IP address of the server>:<name of the backup file of the form: data_kata_<date and time of backup copy creation>.tar>Example:
Command for downloading to the hard drive of your computer a backup copy created on a Central Node server with the IP address 10.0.0.10 under the 'admin' account on April 10, 2020 at 10 hours 00 minutes 00 seconds:
scp admin@10.0.0.10:data_kata_2020_04_10T10_00_00.tarThe backup copy is saved to the current directory on the hard drive of your computer.
- Reinstalling the application
Remove and reinstall Kaspersky Anti Targeted Attack Platform.
Data can be restored from backup only to a server with the Central Node role. If you assign the PCN or SCN role to the server before you begin, the restoration process will fail.
- Uploading a backup copy to the server
Upload your backup copy to the Central Node server by running the following command:
scp <name of the backup file of the form: data_kata_<date and time of backup copy creation>.tar> <name of the account used for working in the administrator menu and in the server management console>@<IP address of the server>:Example:
Command for uploading a backup copy created on April 10, 2020 at 10 hours 00 minutes 00 seconds to the Central Node server with the IP address 10.0.0.10 under the 'admin' account:
scp data_kata_2020_04_10T10_00_00.tar admin@10.0.0.10:The backup copy is uploaded to the current directory on the Central Node server.
- Restoring data from a backup copy
You can restore data from a backup copy on the Central Node server using the administrator menu or in Technical Support Mode:
If the hardware configuration of the Central Node server on which the backup copy was created differs from the hardware configuration of the server on which you are planning to restore the server settings, you need to reconfigure the application scaling settings after restoring.
After restoring the data, you do not need to reconnect the SCNs to the PCN: the PCN connection settings and the list of connected SCNs are restored from the backup copy.
The backup copy of server settings does not contain PCAP files of recorded mirrored network traffic. You can save and restore PCAP files on your own by copying them from the /data/volumes/dumps directory of the connected storage. After restoring data, you must connect your external storage.
Page top
Contents of exported data
Kaspersky Anti Targeted Attack Platform may contain user data and other confidential information. The Kaspersky Anti Targeted Attack Platform administrator must take steps to ensure the security of this data when creating a backup copy, when replacing equipment on which the application is installed, or in other cases when it may be necessary to permanently delete data. The Kaspersky Anti Targeted Attack Platform administrator bears responsibility for access to data stored on application servers.
You can create a backup copy of the following data:
- The application database.
- Objects in Storage.
- Files from alerts generated during a rescan.
- Sandbox artifacts.
- Configuration files.
- Central Node settings.
You can clear the directory before creating a backup copy of the application.
Before restoring data from backup, the following is cleared on the Central Node server on which you are recovering the application:
- The application database.
- Objects in Storage.
- Files from alerts generated during a rescan.
- Sandbox artifacts.
- Configuration files.
- Central Node settings.
Contents and amount of data exported to create a backup copy
Data type
Exported data
Application operation mode
Deployment method
- Central Node settings
- PCN connection settings
- List of connected SCNs
- The application database on Central Node:
- Network traffic events
- Alerts and VIP statuses of alerts
- Tasks and task execution results
- Policies
- User-defined TAA (IOA) rules and exclusions
- IDS exclusions
- IOC files
- Scan exclusion rules
- Information about files in Storage
- Information about quarantined objects
- List of computers with Endpoint Agent
- Inventory of device
- Labels assigned to devices
- List of user accounts registered in the operating systems of the devices
- List of executable files on devices
- Address spaces of devices
- Information about the location of devices on the network interactions map
- General reports and report templates
- NDR reports and report templates
- User account data
- Network session data
- Topology map
- Notifications
Central Node settings, if selected.
Application databases, by default.
Standalone Central Node server.
All deployment methods.
PCN settings.
Custom
Distributed solution and multitenancy mode.
All deployment methods.
SCN settings.
Custom
As for a standalone Central Node server.
Distributed solution and multitenancy mode.
All deployment methods.
Application databases on the PCN:
- Network traffic events
- Alerts and VIP statuses of alerts
- Task execution results
- Policies
- User-defined TAA (IOA) rules and exclusions
- IDS exclusions
- IOC files
- List of data excluded from the scan
- Information about files in Storage
- Information about quarantined objects
- The list of computers with the Endpoint Agent component
- Inventory of device
- Labels assigned to devices
- List of user accounts registered in the operating systems of the devices
- List of executable files on devices
- Address spaces of devices
- Information about the location of devices on the network interactions map
- General reports and report templates
- NDR reports and report templates
- User account data
- Network session data
- Topology map
- Notifications
Default
Distributed solution and multitenancy mode.
All deployment methods.
Configuration files.
Yes
All modes.
All deployment methods.
Backup
Custom
All modes.
Non-high-availability version.
Sandbox artifacts.
Custom
All modes.
Non-high-availability version.
Files from alerts generated during a rescan.
Custom
All modes.
Non-high-availability version.
Events database.
None.
All modes.
All deployment methods.
Files that are in the scan queue when the backup copy of the application is created are not exported.
Page top
Upgrading Kaspersky Anti Targeted Attack Platform
Before installing the application upgrade package, it is recommended to first create a backup of the current state of each Central Node server to be updated and download it to the hard drive from the application administrator menu. If installing an application upgrade package fails, or if you need to reinstall Kaspersky Anti Targeted Attack Platform, you can use the backup copy of the application.
We also also recommend learning about the limitations of the version to which you are upgrading.
You cannot migrate from the non-high-availability version of the application to the high availability version by upgrading it — if you are using the non-high-availability version of the application, you can only install the non-high-availability version during the upgrade, and vice versa.
Upgrading the application involves the following steps:
- Upgrading the Sandbox component.
The application does not have a procedure for upgrading the component. You must install version 7.0.3 of the component.
After installing the component, you need to set the maximum number of simultaneously running virtual machines. The default value is 48.
When installing the component on a VMware ESXi virtual machine, you must set up a configuration described in Calculations for the Sandbox component section.
- Upgrading the Central Node component.
You can upgrade the component in one of the following ways:
- From version 6.1 to version 7.0.3.
In this case, follow one of the following instructions: Upgrading Central Node installed on a server or Upgrading Central Node installed as a cluster.
Versions earlier than 6.1 cannot be upgraded to version 7.0.3. If you are using an older version of the application, you must upgrade Central Node to version 6.1 in the following order: 3.7 → 3.7.1, 3.7.1 → 3.7.2, 3.7.2 → 4.0, 4.0 → 4.1, 4.1 → 5.0, 5.0 → 5.1, 5.1 → 6.0, 6.0 → 6.0.2, 6.0.2 → 6.1.
- If you are using Central Node version 7.0, you need to upgrade it to version 7.0.1 and then to version 7.0.3.
- If you are using version 7.0.1 of the component, you need to upgrade it to version 7.0.3.
The hardware requirements for 7.0, 7.0.1, and 7.0.3 Central Node servers are different from the hardware requirements of version 6.1. We strongly recommend making sure that your server configuration satisfies the requirements listed in the Calculations for the Central Node component section.
- From version 6.1 to version 7.0.3.
- Upgrading the Sensor component installed on a standalone server.
The application does not have a procedure for upgrading the component. You must install version 7.0.3 of the component.
Please note that network traffic dump files saved to external storage by version 7.0.1 of the Sensor component remain in the external storage after you install the Sensor component version 7.0.3, but you cannot view or download them in the application web interface.
- Upgrading the Endpoint Agent component:
- Kaspersky Endpoint Agent for Windows.
If you use the solution together with Kaspersky Security for Windows Server, you can migrate from Kaspersky Security for Windows Server to Kaspersky Endpoint Security for Windows version 12.1 or later that contains the built-in agent. For more information about migration, see the Kaspersky Endpoint Security for Windows Help.
- Kaspersky Endpoint Security for Windows.
- Kaspersky Endpoint Agent for Windows.
Special considerations for updating Kaspersky Anti Targeted Attack Platform from version 6.1 to version 7.0.3
- After upgrading Kaspersky Anti Targeted Attack Platform to version 7.0.3, you must add license keys again.
- A short interruption in the operation of the application is considered acceptable, including for the high availability version of the application.
- If the Kaspersky Secure Mail Gateway solution is used in the role of the Sensor component, the settings for integration with it are saved.
- Sandbox component data is not saved. We recommend deleting custom operating system images before updating Sandbox and uploading them after the update.
- Central Node 7.0.3 is not compatible with Sensor and Sandbox components of earlier versions.
Upgrading Central Node installed on a server from version 6.1 to 7.0.3
Before installing the application upgrade package, it is recommended to first create a backup of the current state of each Central Node server to be updated and download it to the hard drive from the application administrator menu. If installing an application upgrade package fails, or if you need to reinstall Kaspersky Anti Targeted Attack Platform, you can use the backup copy of the application.
We also also recommend learning about the limitations of the version to which you are upgrading.
The hardware requirements for 7.0, 7.0.1, and 7.0.3 Central Node servers are different from the hardware requirements of version 6.1. We strongly recommend making sure that your server configuration satisfies the requirements listed in the Calculations for the Central Node component section.
If you are using the distributed solution and multitenancy mode, you must complete the steps to prepare for installing the upgrade before proceeding with the upgrade.
The upgrade is delivered as an upgrade package. The package is included in the application distribution kit.
All steps described below must be performed on servers in Technical Support Mode, after elevating user privileges using the sudo -i command.
To upgrade Central Node installed on a server:
- Place the application upgrade package on the Central Node server in the
/datadirectory. - Sign in to the management console of the Central Node server where you want to perform the upgrade via SSH or through the terminal.
- Make sure that the /dev/sda2 file system has more than 100 GB of free space.
- If you do not use mirrored traffic processing from SPAN ports (including the application using the KEDR license key), execute the command:
kata-enable-spanIf processing of mirrored traffic from SPAN ports is disabled, the upgrade fails.
- Unpack the update archive:
tar xvf /data/kata-upgrade-7.0.3.520-x86_64_en-ru.tar.gz -C /data/ - Install the upgrade package by running the following commands:
cd /data/upgrade/./run_kata_upgrade.pyThe user name entry window is displayed.
- In the displayed window, in the Username field, enter the name of the user with administrator rights, select the OK button and press Enter.
Default value: admin.
- In the displayed window, in the Password field, enter the password of the user with administrator rights, select the OK button and press Enter.
This opens the window for entering the path to the update archive.
- This opens a window; in that window, in the Data directory field, enter the path to the update archive, select the OK button and press Enter.
Default value: /data/upgrade
- In the displayed window, select the localization language for the NDR functionality.
Parts of the application related to NDR functionality will be displayed in the selected language.
After some time, the console will display a message prompting you to power off the server.
- After the message prompting you to power off the server is displayed, run the following command:
poweroff - Mount the Ubuntu-based iso image of Kaspersky Anti Targeted Attack Platform 7.0.3 (kata-cn-7.0.3.520-inst.x86_64_en-ru.iso). If you are using Kaspersky Anti Targeted Attack Platform based on the Astra Linux operating system, follow these instructions to create an iso image.
- Boot from the device that has the mounted iso image.
- In the GRUB menu, select Upgrade KATA 7.0.
- Follow the remaining steps of the wizard to complete the upgrade on the server.
The Central Node component is upgraded.
After upgrading, you must log in again to the Central Node server management console over SSH or through the terminal.
Embedded Sensor may be missing after upgrading to version 7.0 a Central Node component that had been used in the distributed solution or multitenancy mode.
To remove the limitation:
- Sign in to the management console of the Central Node server on which you want to upgrade the Embedded Sensor over SSH or using a terminal.
- When the system prompts you, enter the administrator user name and the password that was specified during installation of the component.
The application component administrator menu is displayed.
- In the application administrator menu, select Technical Support Mode.
- Press ENTER.
- This opens the Technical Support Mode confirmation window.
- Confirm that you want to manage the application in Technical Support Mode. To do so, select Yes and press ENTER.
- Run the following command:
docker service update --cap-add=CAP_DAC_OVERRIDE --cap-add=CAP_IPC_LOCK --cap-add=CAP_SYS_PTRACE kata_product_main_1_preprocessor_span
The Embedded Sensor is restored.
Page top
Upgrading Central Node installed as a cluster from version 6.1 to version 7.0.3
Before installing the application upgrade package, it is recommended to first create a backup of the current state of each Central Node server to be updated and download it to the hard drive from the application administrator menu. If installing an application upgrade package fails, or if you need to reinstall Kaspersky Anti Targeted Attack Platform, you can use the backup copy of the application.
We also also recommend learning about the limitations of the version to which you are upgrading.
The hardware requirements for 7.0, 7.0.1, and 7.0.3 Central Node servers are different from the hardware requirements of version 6.1. We strongly recommend making sure that your server configuration satisfies the requirements listed in the Calculations for the Central Node component section.
The upgrade is delivered as an upgrade package. The package is included in the application distribution kit.
If you are using the distributed solution and multitenancy mode, you must complete the steps to prepare for installing the upgrade before proceeding with the upgrade.
All steps described below must be performed on servers in Technical Support Mode, after elevating user privileges using the sudo -i command.
To upgrade Central Node installed as a cluster:
- Log in to any of the storage servers in the Central Node cluster and check if the Ceph storage is working. To do so, execute the following command:
ceph -s | grep health:The Ceph storage is healthy if the following value is returned:
health: HEALTH_OKIf the value is different from
health: HEALTH_OK, please contact Technical Support. - Log in to each of the storage servers and restart the kata-osd-starter service:
systemctl restart kata-osd-starter - Make sure the Kafka service is working:
- Find out which servers in the cluster have the 'manager' role in Docker swarm. To do this, run the following command on any of the cluster servers:
docker node lsA list of cluster servers is displayed. Look at the
MANAGER STATUScolumn in the list: if a server hasLeaderorReachablein that column, it means it has the 'manager' role. - Run the following command:
docker service ps kata_product_main_1_schema_registryLook at the value in the
NODEcolumn to determine which server has the Schema Registry. - Log in to the server with the Schema Registry and run the following command:
docker exec -it $(docker ps | grep schema_registry | awk '{ print $1 }') curl http://127.0.0.1:8081/subjectsIf you get a JSON with a list of subjects, it means the Kafka service is working.
- Find out which servers in the cluster have the 'manager' role in Docker swarm. To do this, run the following command on any of the cluster servers:
- If you do not use mirrored traffic processing from SPAN ports (including the application using the KEDR license key), follow these steps:
- Enter the management console of any processing server of the server over SSH or using a terminal.
- Run the following command:
kata-enable-span
If processing of mirrored traffic from SPAN ports is disabled, the upgrade fails.
- Place the application upgrade package on the Central Node cluster server with the manager role in the Docker swarm, in the
/datadirectory. To view the role, use the$ docker node lscommand. - Enter the management console of the relevant server over SSH or through a terminal.
- Make sure that the /dev/sda2 file system on each server of the cluster has more than 100 GB of free space.
- Unpack the update archive:
tar xvf /data/kata-upgrade-7.0.3.520-x86_64_en-ru.tar.gz -C /data/ - Install the upgrade package by running the following commands:
cd /data/upgrade/./run_kata_upgrade.pyThe user name entry window is displayed.
- In the Username field, enter the name of the user with administrator rights, select the OK button and press Enter.
Default value: admin.
- In the Password field, enter the password of the user with administrator rights, select the OK button, and press Enter.
This opens the window for entering the path to the update archive.
- In the Data directory field, enter the path to the update archive, select the OK button, and press Enter.
Default value: /data/upgrade.
- In the displayed window, select the localization language for the NDR functionality.
Parts of the application related to NDR functionality will be displayed in the selected language.
After some time, the console will display a message prompting you to power off the server.
- Connect to the server that you want to power off over SSH or through a terminal.
- Run the
poweroffcommand. - Mount the Ubuntu-based iso image of Kaspersky Anti Targeted Attack Platform 7.0.3 (kata-cn-7.0.3.520-inst.x86_64_en-ru.iso). If you are using Kaspersky Anti Targeted Attack Platform based on the Astra Linux operating system, follow these instructions to create an iso image.
- Boot from the device that has the mounted iso image.
- In the GRUB menu, select Upgrade KATA 7.0.
- Follow the remaining steps of the wizard to complete the upgrade on the server.
- After the upgrade is complete, go to the console of the server you connected to at step 6 and press Enter.
A script is started that completes the upgrade process. After the update is complete, the console displays a message telling you to shut down the next server in the cluster.
- Repeat steps 14 to 20 for each server in the cluster.
The last server to be updated is the server to which you connected at step 6. For that server, step 20 is omitted.
The Central Node component is upgraded.
After updating the component, you must log in again to the Central Node server management console over SSH or through the terminal.
Page top
Preparing to install the upgrade in distributed solution and multitenancy mode
If you are using the distributed solution and multitenancy mode, you need to do the following before upgrading the application from version 6.1 to version 7.0.3:
- Before upgrading the PCN, you must disconnect all SCN servers connected to this PCN. After the application upgrade is complete, the PCN server belongs to the same tenant it belonged to before the upgrade.
- If you want to update the application on an SCN server, disconnect that SCN server from the PCN before updating.
The application is updated on the standalone Central Node server. After upgrading the application, you can assign the SCN role to servers and select the tenant to which the SCN server belongs.
Disconnecting an SCN from the PCN in Kaspersky Anti Targeted Attack Platform version 6.1 is a reversible operation. You can reconnect the SCN to the PCN after upgrading the application to version 7.0.3. Starting with version 7.0, disconnecting an SCN from PCN becomes irreversible and reconnecting an SCN to any PCN server is no longer possible.
After the application update is complete, by default, all users with the Administrator role are granted access to the web interface of the PCN server and all SCN servers.
By default, users with the Senior security officer and Security officer role have access to the web interface of the same servers to which they had access before the upgrade.
Kaspersky Anti Targeted Attack Platform may contain user data and other confidential information. The Kaspersky Anti Targeted Attack Platform administrator must take steps to ensure the security of this data when upgrading the application, or in other cases when it may be necessary to permanently delete data. The Kaspersky Anti Targeted Attack Platform administrator bears responsibility for access to data stored on application servers.
Once the preparatory steps are completed, you can upgrade the PCN and SCN servers by follwing one of the following instructions: Upgrading Central Node installed on a server or Upgrading Central Node installed as a cluster.
Page top
Upgrading Sensor installed on a standalone server
The application does not have a standard upgrade procedure. You need to install the component version 7.0, 7.0.1, or 7.0.3.
Please note that you cannot view or download network traffic dump files saved to external storage during the operation of the Sensor component version 7.0.1 after you install the Sensor component version 7.0.3.
The following recommendations apply to installing the component:
- Save the settings of the Sensor component in a convenient format; for example, you can make screenshots. If you use BPF and Regexp traffic filtering, we recommend saving the filtering rules to a file.
- Install the Sensor component.
- Connect the installed Sensor component to the Central Node component.
- Manually restore your saved settings of the Sensor component.
- Connect the external storage.
In the web interface of version 7.0, 7.0.1, or 7.0.3 of the application, you cannot download traffic dumps that were saved to external storage using the Sensor component version 6.1.
Contents and amount of information kept when upgrading the Kaspersky Anti Targeted Attack Platform
Information about the contents and amount of data kept when upgrading Kaspersky Anti Targeted Attack Platform from version 6.1 to version 7.0 is listed in the following table.
Contents and volume of data saved when upgrading the application from version 6.1 to version 7.0
Data type |
Data saved during upgrade |
|---|---|
|
|
|
|
|
|
|
|
|
|
Updating Kaspersky Anti Targeted Attack Platform from version 7.0 to version 7.0.1
Before installing the application upgrade package, it is recommended to first create a backup of the current state of each Central Node server to be updated and download it to the hard drive from the application administrator menu. If installing an application upgrade package fails, or if you need to reinstall Kaspersky Anti Targeted Attack Platform, you can use the backup copy of the application.
We also also recommend learning about the limitations of the version to which you are upgrading.
If you are using the distributed solution and multitenancy mode, you need to upgrade each Central Node in accordance with the following procedure without disconnecting the SCNs from the PCN.
The disconnection of SCNs from the PCN is irreversible, you cannot reconnect an SCN to any PCN server.
The upgrade is delivered as an upgrade package. The package is included in the application distribution kit.
To update Central Node:
- If Central Node is installed on a server:
- Place the application upgrade package on the Central Node server in the
/datadirectory. - Sign in to the management console of the Central Node server where you want to perform the upgrade via SSH or through the terminal.
- Place the application upgrade package on the Central Node server in the
- If Central Node is installed as a cluster
- Place the application upgrade package on the Central Node cluster server with the manager role in the Docker swarm, in the
/datadirectory. To view the role, use the$ docker node lscommand. - Enter the management console of the relevant server over SSH or through a terminal.
- Place the application upgrade package on the Central Node cluster server with the manager role in the Docker swarm, in the
- Make sure that the /dev/sda2 file system has more than 100 GB of free space.
- Unpack the update archive:
tar xvf /data/kata-upgrade-7.0.1.500-x86_64_en-ru.tar.gz -C /data/ - Install the upgrade package by running the following commands:
cd /data/upgrade/./run_kata_upgrade.py --patch-version 701The user name entry window is displayed.
- In the displayed window, in the Username field, enter the name of the user with administrator rights, select the OK button and press Enter.
Default value: admin.
- In the displayed window, in the Password field, enter the password of the user with administrator rights, select the OK button and press Enter.
This opens the window for entering the path to the update archive.
- This opens a window; in that window, in the Data directory field, enter the path to the update archive, select the OK button and press Enter.
Default value: /data/upgrade
- In the displayed window, select the localization language for the NDR functionality.
Parts of the application related to NDR functionality will be displayed in the selected language.
The Central Node component is upgraded.
After the update is complete, we recommend restarting all updated Central Nodes. If Central Node is installed as a cluster, we recommend restarting all cluster servers one by one.
Page top
Updating Kaspersky Anti Targeted Attack Platform from version 7.0.1 to version 7.0.3
Before installing the application upgrade package, it is recommended to first create a backup of the current state of each Central Node server to be updated and download it to the hard drive from the application administrator menu. If installing an application upgrade package fails, or if you need to reinstall Kaspersky Anti Targeted Attack Platform, you can use the backup copy of the application.
We also also recommend learning about the limitations of the version to which you are upgrading.
If you are using the distributed solution and multitenancy mode, you need to upgrade each Central Node in accordance with the following procedure without disconnecting the SCNs from the PCN.
The disconnection of SCNs from the PCN is irreversible, you cannot reconnect an SCN to any PCN server.
The upgrade is delivered as an upgrade package. The package is included in the application distribution kit.
To update Central Node:
- If Central Node is installed on a server:
- Place the application upgrade package on the Central Node server in the
/datadirectory. - Sign in to the management console of the Central Node server where you want to perform the upgrade via SSH or through the terminal.
- Place the application upgrade package on the Central Node server in the
- If Central Node is installed as a cluster
- Place the application upgrade package on the Central Node cluster server with the manager role in the Docker swarm, in the
/datadirectory. To view the role, use the$ docker node lscommand. - Enter the management console of the relevant server over SSH or through a terminal.
- Place the application upgrade package on the Central Node cluster server with the manager role in the Docker swarm, in the
- Make sure that the /dev/sda2 file system has more than 100 GB of free space.
- Unpack the update archive:
tar xvf /data/kata-upgrade-7.0.3.520-x86_64_en-ru.tar.gz -C /data/ - Install the upgrade package by running the following commands:
cd /data/upgrade/./run_kata_upgrade.py --patch-version 703The user name entry window is displayed.
- In the displayed window, in the Username field, enter the name of the user with administrator rights, select the OK button and press Enter.
Default value: admin.
- In the displayed window, in the Password field, enter the password of the user with administrator rights, select the OK button and press Enter.
This opens the window for entering the path to the update archive.
- This opens a window; in that window, in the Data directory field, enter the path to the update archive, select the OK button and press Enter.
Default value: /data/upgrade
- In the displayed window, select the localization language for the NDR functionality.
Parts of the application related to NDR functionality will be displayed in the selected language.
The Central Node component is upgraded.
After the update is complete, we recommend restarting all updated Central Nodes. If Central Node is installed as a cluster, we recommend restarting all cluster servers one by one.
After upgrading a Central Node cluster, the alert table may not display new alerts generated by the IDS technology. We recommend checking that new alerts are displayed in the table by following the steps of the instructions below.
To see if new alerts are being displayed in the alerts table:
- Log in to the management console of any server in the Central Node cluster over SSH or through a terminal.
- Check if all cluster services are running and stable (have not been restarted within the last 10 minutes) by running the following command:
docker ps --format "table {{.Image}} | {{.Status}}" - If all services of the cluster are stable, generate a test alert by making the following request:
curl "http://eicar.com/counter.php?act=1&uid=1&id=234" - Log in to the application web interface under a Senior security officer user account.
- Select the Alerts section in the window of the application web interface.
This opens the table of alerts.
- Check if the alerts table contains a new alert for a network event with the http://eicar.com/counter.php?act=1&uid=1&id=234 address.
If the alert is missing from the table, follow the steps in the instructions to fix the limitation.
To remove the limitation:
- Over SSH or through a terminal, log in to the management console of that cluster server on which mirrored SPAN traffic processing is enabled.
- Raise the privileges of the user by running the following command:
sudo -i - Run the following command:
docker service update --force kata_product_main_1_ids_alert_syncer - Check if the new alert is present in the alerts table by following steps 3 through 6 of the instructions above.
The limitation is removed.
If the test alert is missing from the table, please contact Technical Support.
Page top
Using Kaspersky Anti Targeted Attack Platform API KATA and KEDR
You can configure the integration of Kaspersky Anti Targeted Attack Platform with external systems to manage Threat Response actions, to scan files that are stored in those systems, and to provide access to information about all alerts and events to the external systems.
API method calls are available only to authorized external systems. For authorization, the application administrator must create a request to integrate the external system with the application. Then the administrator must process the request in the web interface of Kaspersky Anti Targeted Attack Platform.
If you have deployed the Central Node and Sensor components as a cluster, you can configure high availability integration with an external system using one of the following options:
- Using the Round Robin function.
- Configure the external system so that if a timeout occurs, the external system switches between the IP addresses of the cluster servers.
To configure high availability integration with an external system using the Round Robin function:
- Configure Round Robin on the DNS server for the domain name corresponding to the Central Node cluster.
- Specify this domain name in the mail server settings.
Integration with the external system is configured based on the domain name. The external system will communicate with a random server in the cluster. If this server fails, the external system will communicate with another healthy server in the cluster.
Integrating an external system with Kaspersky Anti Targeted Attack Platform
To start working with the API, you need to integrate an external system with Kaspersky Anti Targeted Attack Platform. The external system must complete authorization on the Kaspersky Anti Targeted Attack Platform server.
To integrate an external system with Kaspersky Anti Targeted Attack Platform:
- Generate a unique identifier of the external system for authorization in Kaspersky Anti Targeted Attack Platform –
sensorId. - Generate a certificate for the external system server.
- Create any request containing a
sensorIdfrom the external system in Kaspersky Anti Targeted Attack Platform. For example, you can create a request to scan an object from an external system in Kaspersky Anti Targeted Attack Platform.
The web interface of Kaspersky Anti Targeted Attack Platform will display the request for authorization from the external system. Contact the application administrator to process the request.
If you need to change the external system server certificate, repeat the steps for integrating the external system with Kaspersky Anti Targeted Attack Platform.
Page top
API for scanning objects of external systems
Kaspersky Anti Targeted Attack Platform provides the HTTPS REST interface for scanning objects saved in external systems.
For scanning objects stored in external systems, the following Kaspersky Anti Targeted Attack Platform interaction scenario is recommended:
- Creating a request for scanning objects using the
HTTP POSTmethod - Creating a request for scan results using the HTTP
GETmethodThe API interface is asynchronous, which means that Kaspersky Anti Targeted Attack Platform scans objects in the background instead of immediately upon request of the external system. For this reason, you must periodically send a request from the external system using the HTTP
GETmethod to receive the scan results. The recommended frequency for sending a request is once per minute.You can also configure forwarding of notifications about detected objects in the web interface of Kaspersky Anti Targeted Attack Platform.
- Creating a request to delete scan results using the HTTP method
DELETEYou can delete the results of scanning a specified object or all objects.
Working with a cluster
If the external system consists of several servers that are combined into a cluster, it is recommended to use one ID (sensorId) for all servers. If this is the case, a single integration request will be displayed for the entire system in the web interface of Kaspersky Anti Targeted Attack Platform. If it is necessary to differentiate the receipt of scan results over individual servers, you can assign a unique instance ID (sensorInstanceId) to each server.
Limitations
The maximum allowed number of object scan requests from external systems and the maximum allowed size of a scanned object are set in the Kaspersky Anti Targeted Attack Platform configuration file.
If the maximum allowed number of simultaneous object scan requests is exceeded, Kaspersky Anti Targeted Attack Platform does not process further requests until the number of object scan requests is less than the maximum allowed number. Until this condition is met, the return code 429 is issued. You must try the scan request again later.
If the maximum allowed object size is exceeded, Kaspersky Anti Targeted Attack Platform does not scan the object. Return code 413 is generated when the HTTP POST method is created. You can find out the maximum allowed size of an object by using the GET method to view the list of object scan restrictions.
Request to scan objects
To create a request for scanning objects, the HTTP POST method is used. You can create a request by using the cURL command-line utility, for example.
You can set the parameters for executing a cURL command by using additional switches (see the table below).
Please refer to the cURL documentation for more information about cURL command switches.
Command syntax
curl --cert <path to the TLS certificate file> --key <path to the private key file> -X POST "<URL of the server with the Central Node component>:<port, 443 by default>/kata/scanner/v1/sensors/<sensorId>/scans?sensorInstanceId=<sensorInstanceId>" -F "content=<path to the file that you want to scan>" -F scanId=<scan request ID> -F "objectType=file"
If the request is processed successfully, the OK status will be displayed.
Settings
Setting |
Type |
Description |
|---|---|---|
|
string |
Unique ID of the external system used for authorization in Kaspersky Anti Targeted Attack Platform. |
|
file |
Contents of the scanned object. |
|
string |
Unique ID of the scan request. It must be generated in the external system. It cannot contain spaces or special characters. Do not use file names as a scan request ID. If this parameter is not defined, viewing scan results is not available. |
|
string |
Type of scanned object. Possible value of the parameter: |
|
string |
Unique ID of the external system instance. Servers combined into a cluster are also considered to be instances of an external system. This parameter is optional. |
Returned value
Return code |
Description |
|---|---|
|
Scan completed successfully. |
|
Authorization required. |
|
Number of requests exceeded. Repeat the request later. |
|
Internal server error. Repeat the request later. |
Example of entering a command with switches
|
Request for scan results
To create a request for receiving scan results, the HTTP GET method is used. You can create a request by using the cURL command-line utility, for example.
You can set the parameters for executing a cURL command by using additional switches (see the table below).
Please refer to the cURL documentation for more information about cURL command switches.
Command syntax
curl --cert <path to the TLS certificate file> --key <path to the private key file> -X GET<URL of the server with the Central Node component>:<port, 443 by default>/kata/scanner/v1/sensors/<sensorId>/scans/state?sensorInstanceId=<sensorInstanceId>&state=<one or more scan statuses that you want to display in scan results>"
If the request is sent successfully, a list of requests for scanning objects and the results of scanning these objects will be displayed. The scan results will be filtered by the statuses that you specified in the state parameter. For example, if you specified state=processing,detect in the request for scan results, the application will display only the object scan requests that are being processed or in which the application has detected a threat.
Settings
Setting |
Type |
Description |
|---|---|---|
|
string |
Unique ID of the external system used for authorization in Kaspersky Anti Targeted Attack Platform. |
|
array (string element type) |
Object scan status. When this parameter is defined, the scan results will be filtered by status. Indicate one or more statuses separated by commas. The following parameter values are available:
|
|
string |
Unique ID of the external system instance. Servers combined into a cluster are also considered to be instances of an external system. This parameter is optional. |
Response
HTTP code: 200
Format: JSON
|
Returned value
Return code |
Description |
|---|---|
|
No contents. |
|
No scan results found for the specified ID. |
|
Internal server error. Repeat the request later. |
Example of entering a command with switches if you want to display all object scan statuses in the scan results
|
Request to delete scan results
To create a request to delete the scan results for one or more objects, use the DELETE method. You can create a request by using the cURL command-line utility, for example.
Command syntax
curl --cert <path to the TLS certificate file> --key <path to the private key file> -X DELETE "<URL of the server with the Central Node component>:<port, 443 by default>/kata/scanner/v1/sensors/<sensorId>/scans/<scanId>"
If the request is processed successfully, the object scan results will be deleted. The OK status is displayed.
Settings
Setting |
Type |
Description |
|---|---|---|
|
string |
Unique ID of the external system used for authorization in Kaspersky Anti Targeted Attack Platform. |
|
string |
Unique ID of the object scan request. If this parameter is not defined, the scan results for all objects will be deleted. |
Returned value
Return code |
Description |
|---|---|
|
Scan completed successfully. |
|
Authorization required. |
|
No scan results found for the specified ID. |
|
Internal server error. Repeat the request later. |
Command input example
|
Request to display object scan restrictions
To create a request to display the application's restrictions on scanning objects (for example, by size), the HTTP GET method is used. You can create a request by using the cURL command-line utility, for example.
Command syntax
curl --cert <path to the TLS certificate file> --key <path to the private key file> -X GET "<URL of the server with the Central Node component>:<port, 443 by default>/kata/scanner/v1/sensors/<sensorId>/scans/filters"
If the request is processed successfully, the application's object scan restrictions will be displayed. For example, the maxObjectSize restriction is the maximum allowed size of an object that you can submit for scanning.
Settings
Setting |
Type |
Description |
|---|---|---|
|
string |
Unique ID of the external system used for authorization in Kaspersky Anti Targeted Attack Platform. |
Response
HTTP code: 200
Format: JSON
|
Returned value
Return code |
Description |
|---|---|
|
Authorization required. |
|
Internal server error. Repeat the request later. |
Command input example
|
API that external systems can use to receive information about application alerts
Kaspersky Anti Targeted Attack Platform provides an API that lets external systems access information about all alerts of the application and not just to scan results for objects stored in these external systems.
In order to receive information only for alerts that satisfy certain conditions, you can specify filters in the request parameters.
The application does not automatically send information about new alerts based on prior requests. A new request must be sent to receive up-to-date information.
Special considerations for operation in the distributed solution
If the application runs in distributed solution mode, you must separately configure the integration with the external system for each PCN and SCN server from which you want to receive information about alerts. This limitation is due to the fact that the web interface of the PCN server displays information about all alerts, but the alerts database stores only those alerts that have been registered on that specific server.
Request to display alert information
To create a request to display information about Kaspersky Anti Targeted Attack Platform alerts, the HTTP GET method is used. You can create a request by using the cURL command-line utility, for example.
Command syntax
curl --cert <path to the TLS certificate file> --key <path to the private key file> -X GET "<URL of the server with the Central Node component>:<port, 443 by default>/kata/scanner/v1/sensors/<sensorId>/detects?detect_type=<one or more technologies that were used to generate the alert>&limit=<number of alerts in the response to the request>&token=<request ID>"
If the request is processed successfully, you will see a list of alerts generated by Kaspersky Anti Targeted Attack Platform on the server of the external system.
Settings
Setting |
Type |
Description |
|---|---|---|
|
String |
Unique ID of the external system used for authorization in Kaspersky Anti Targeted Attack Platform. |
|
Array |
The technology that created the alert. You can specify a comma-separated list of technologies. Possible values:
If the parameter is not specified, information about all alerts is provided. |
|
Integer |
Number of objects for which information is provided in response to the request. Allowed values: integers from 1 to 10,000. The default value is |
|
String |
Request ID. If this parameter is specified, a repeated request does not show alert information that was obtained by prior requests. This helps avoid the duplication of information about the same alerts in case of repeated requests. If this parameter is not specified, information about all alerts is provided. |
Response
HTTP code: 200
Format: JSON
|
Returned value
Return code |
Description |
|---|---|
|
Incorrect parameters. |
|
Number of requests exceeded. |
|
Authorization required. |
|
Internal server error. Repeat the request later. |
Example of entering a command with switches
|
Scope of transmitted data
Information that is transmitted for each detection is listed in the following table.
Scope of information transmitted for an alert
Setting |
Value |
Description |
|---|---|---|
|
Integer value. |
Alert ID. |
|
Date and time. |
Event time. |
|
Date and time. |
Time when alert information was recorded in the Kaspersky Anti Targeted Attack Platform database. |
|
One of the following values:
|
Alert importance. |
|
One of the following values:
|
Source of the detected object. |
|
One of the following values:
|
Technology that was used to detect the object. |
|
One of the following values:
|
Type of detected object. |
|
Depends on the type of detected object. |
|
|
Depends on the technology that was used to detect the object. |
|
|
Depends on the source of detected object. |
Data on detected objects
The scope of transmitted data on detected objects depending on the type of the object is listed in the following table.
Data on detected objects
|
Setting |
Data type |
Description |
Example |
|---|---|---|---|---|
|
|
MD5 |
MD5 hash of the file or composite object that was sent for scanning. |
|
|
SHA256 |
SHA256 hash of the file or composite object that was sent for scanning. |
|
|
|
String |
Name of the file or composite object that was sent for scanning. |
|
|
|
String |
Type of the file or composite object that was sent for scanning. |
|
|
|
Integer |
Size of the file or composite object that was sent for scanning, in bytes. |
|
|
|
MD5 |
MD5 hash of the file (simple object or file within a composite object) in which the threat was detected. |
|
|
|
String |
Name of the file (simple object or file within a composite object) in which the threat was detected. |
|
|
|
Integer |
Size of the file (simple object or file within a composite object) in which the threat was detected, in bytes. |
|
|
|
|
String |
URL of the detected object. |
|
|
|
Array |
List of domains to which detected objects belong. For the |
|
Data on detected threats
The scope of transmitted data on detected threats depending on the technology that was used to generate the alert is listed in the table below.
Data on detected threats
Technology |
Setting |
Description |
Data type |
Example |
|---|---|---|---|---|
One of the following technologies:
|
|
List of detected threats. |
Array |
|
|
Version of databases used to scan the file. |
Integer |
|
|
Sandbox |
|
List of detected threats. |
Array |
|
|
Name of the virtual machine image where the file was scanned. |
String |
|
|
|
Database version in the following format: |
Integer |
|
|
URL Reputation |
|
List of URL Reputation categories for the detected object (for objects of type |
Array |
|
Data on the environment of detected objects
The scope of transmitted data on the environment of detected objects depending on the source of the object is listed in the following table.
Data on the environment of detected objects
Object source |
Setting |
Description |
Data type |
Example |
|---|---|---|---|---|
|
|
IP address of the computer that established the connection. |
IP address |
|
|
Name of the computer that established the connection. |
String |
|
|
|
IP address of the computer with which the connection was established. |
IP address |
|
|
|
Port of the computer with which the connection was established. |
Integer |
|
|
|
URL of the web resource that was accessed. IDS technology detections do not have this parameter. For URL technology detections, this parameter has the same value as the |
String |
|
|
|
HTTP request method. |
String |
|
|
|
URL from which the redirect was made. |
String |
|
|
|
|
String |
|
|
|
|
Sender's email address. |
String |
|
|
Comma-separated list of recipient email addresses. |
Array |
|
|
|
Subject of the message. |
String |
|
|
|
Email message ID. |
String |
|
|
|
|
Name of the computer on which the detection was generated. |
String |
|
|
IP address of the computer on which the detection was generated. |
IP address |
|
|
|
|
IP address of the computer which initiated the DNS connection. |
IP address |
|
|
IP address of the computer with which the DNS connection was established (typically, a DNS server). |
IP address |
|
|
|
Port of the computer with which the DNS connection was established (typically, a DNS server). |
Integer |
|
|
|
Type of the DNS message:
|
String |
|
|
|
One of the following DNS request types:
|
String |
|
|
|
Domain name from the DNS request. |
String |
|
API that external systems can use to receive information about application events
Kaspersky Anti Targeted Attack Platform provides an API for external systems that provides access to information about events registered by the application.
To receive information only for events that satisfy certain conditions, you can specify filters in the request parameters.
The application does not automatically send information about new events based on prior requests. A new request must be sent to receive up-to-date information.
Information about new events can be retrieved for no more than two hours after these events appear in the Kaspersky Anti Targeted Attack Platform database.
Special considerations for operation in the distributed solution
If the application runs in distributed solution mode, you must separately configure the integration with the external system for each PCN and SCN server from which you want to receive events. This limitation is due to the fact that the web interface of the PCN server displays information about all events, but the events database stores only those events that have been registered on that specific server.
Page top
Request for querying event information
To create a request for getting information about events, the HTTP GET method is used.
You can set the parameters for executing a cURL command by using additional switches (see the table below).
Please refer to the cURL documentation for more information about cURL command switches.
At the first request, Kaspersky Anti Targeted Attack Platform creates a ContinuationToken (hereinafter also referred to as the "token"). The application sends events available in the system at the time of the token creation. When a new token is created, Kaspersky Anti Targeted Attack Platform sends events available in the system at the time of creation of this token.
The token contains information about which data were transmitted last. If you want to receive events recorded after the last request, you must save the created token and use it in future requests.
Command syntax
For the first request:
curl --cert <path to the TLS certificate file> --key <path to the private key file> -X GET "<URL of the server with the Central Node component>:<port, 443 by default>/kata/events_api/v1/<external_system_id>/events"
If the request is processed successfully, information about requested events and the token value are displayed.
For subsequent requests:
curl --cert <path to the TLS certificate file> --key <path to the private key file> -X GET "<URL of the server with the Central Node component>:<port, 443 by default>/kata/events_api/v1/<external_system_id>/events&continuation_token=<token value received by the first request>"
If the request is processed successfully, information about events received since the last request is displayed.
You can create a request to output information about events by specifying the maximum collection time and number of events, as well as event filtering parameters:
curl --cert <path to the TLS certificate file> --key <path to the private key file> -X GET "<URL of the server with the Central Node component>:<port, 443 by default>/kata/events_api/v1/<external_system_id>/events?filter=<event filter>&max_timeout=<maximum event collection time>&max_events=<maximum number of events>&continuation_token=<token value received by the first request>"
If you specified the value of the filter parameter for the first request, you do not have to specify it during subsequent requests: the filtering parameters are saved from the previous request and are used if no new parameters are passed in subsequent requests. If you do not want to use filtering, do not specify a value for the parameter.
Settings
Setting |
Type |
Description |
|---|---|---|
|
UUID |
Unique ID of the external system used for authorization in Kaspersky Anti Targeted Attack Platform. |
|
string |
Event filtering settings. These are set using the event query language. |
|
int |
Maximum event collection time. Specified in the following format: PT<integer value>S. For example, PT300S. The server sends information about events collected during the specified time. The default value is 5 minutes. This value is used unless otherwise specified in the request. The maximum event collection time may not exceed 5 minutes. If you specify a value greater than 5 minutes, the Central Node server returns an error. The actual total time to wait for events may be increased. |
|
int |
Maximum number of events If no value is specified in the request, Kaspersky Anti Targeted Attack Platform calculates it based on the number of hosts on which the Endpoint Agent component is installed. Examples of values for typical configurations:
The value specified in the request must not exceed these limits. |
|
string |
Value of the token. |
Example of entering commands with parameters
|
|
If parameter values contain special characters, you must use URL encoding or the
--data-urlencode option in requests.
Example of commands with URL-encoded parameters
|
Example of commands with parameters that use the --data-urlencode option
|
Response
HTTP code: 200
Format: JSON
|
Returned value
Return code |
Description |
|---|---|
|
Incorrect parameters. |
|
Authorization required. |
|
Internal server error. Repeat the request later. |
Query language for filtering events
The event filtering query language supports the following functions and operators:
- Functions:
in. - Comparison operators for String or Boolean values:
==!=
- Comparison operators for numbers and variables:
ANDORNOT==!=>>=<<=
You can view the list of fields by which you can filter events in the Fields for filtering events section.
If you want to receive information about events of different types, you must create a separate request for each type of event.
|
Numerical and string constants are supported. String constants must be enclosed in single quotation marks: 'example'. Wildcards * and ? are supported for string constants. If you do not want to use these characters as wildcards, you must escape them: \*, \?. Also, in string constants, you must escape special characters.
Fields for filtering events
The fields for filtering events are listed in the table below.
If field values contain special characters, you must use URL encoding or the
--data-urlencode option in requests.
List of fields for filtering events
Field name |
Type |
Description |
|---|---|---|
hostName |
string |
Host name. |
HostIp |
string |
IP address of the host. |
EventType |
string |
Event type. Possible values:
|
UserName |
string |
User name. |
OsFamily |
string |
Family of the operating system. |
OsVersion |
string |
Version of the operating system being used on the host. |
Ioa.Rules.Id |
string |
TAA (IOA) rule ID. |
Ioa.Rules.Name |
string |
Information about the results of file analysis using the Targeted Attack Analyzer technology: name of the TAA (IOA) rule that was used to create the alert. |
Ioa.Rules.Techniques |
string |
MITRE technique |
Ioa.Rules.Tactics |
string |
MITRE tactic |
Ioa.Severity |
string |
Importance level that is assigned to an event generated using this TAA (IOA) rule. Possible values:
|
Ioa.Confidence |
string |
Level of confidence depending on the likelihood of false alarms caused by the rule. Possible values:
|
FileCreationTime |
integer |
File creation time. |
DllCreationTime |
integer |
DLL creation time. |
DroppedCreationTime |
integer |
Creation time of the modified file. |
InterpretedFileCreationTime |
integer |
Creation time of the interpreted file. |
FileName |
string |
File name. |
DllName |
string |
DLL name. |
DroppedName |
string |
Name of the modified file. |
BlockedName |
string |
Name of the blocked file. |
InterpretedFileName |
string |
Name of the interpreted file. |
FilePath |
string |
Path to the directory where the file is located. |
DllPath |
string |
Path to the directory where the DLL is located. |
DroppedPath |
string |
Path to the directory where the modified file is located. |
BlockedPath |
string |
Path to the directory where the blocked file is located. |
InterpretedFilePath |
string |
Path to the directory where the interpreted file is located. |
FileFullName |
string |
Full path to the file. Includes the path to the directory and the file name. |
DllFullName |
string |
Full path to the DLL. Includes the path to the directory and the file name. |
DroppedFullName |
string |
Full path to the modified file. Includes the path to the directory and the file name. |
BlockedFullName |
string |
Full path to the blocked file. Includes the path to the directory and the file name. |
DetectedName |
string |
Full path to the detected file. Includes the path to the directory and the file name. |
OriginalFileName |
string |
Full path to the original file. Includes the path to the directory and the file name. |
InterpretedFileFullName |
string |
Full path to the interpreted file. Includes the path to the directory and the file name. |
FileModificationTime |
integer |
File modification time. |
DllModificationTime |
integer |
DLL modification time. |
DroppedModificationTime |
integer |
Modification time of the modified time. |
InterpretedFileModificationTime |
integer |
Modification time of the interpreted time. |
FileSize |
integer |
File size. |
DllSize |
integer |
DLL size. |
DroppedSize |
integer |
Size of the modified file. |
InterpretedFileSize |
integer |
Size of the interpreted file. |
Md5 |
string |
MD5 hash of the file. |
DllMd5 |
string |
MD5 hash of the DLL |
DroppedMd5 |
string |
MD5 hash of the modified file. |
InterpretedMd5 |
string |
MD5 hash of the interpreted file. |
DetectedMd5 |
string |
MD5 hash of the detected file. |
Sha256 |
string |
SHA256 hash of the file. |
DllSha256 |
string |
SHA256 hash of the DLL. |
DroppedSha256 |
string |
SHA256 hash of the modified file. |
BlockedSha256 |
string |
SHA256 hash of the blocked file. |
InterpretedSha256 |
string |
SHA256 hash of the interpreted file. |
DetectedSha256 |
string |
SHA256 hash of the detected file. |
HijackingPath |
string |
A malicious DLL placed in a directory on the standard search path to make the operating system load it before the original DLL. |
LogonRemoteHost |
string |
IP address of the host that initiated remote access. |
RealUserName |
string |
Name of the user assigned when the user was registered in the system. |
EffectiveUserName |
string |
User name that was used to log in to the system. |
Environment |
string |
Environment variables. |
ProcessType |
integer |
Process type. Possible values:
|
LinuxOperationResult |
string |
Result of the operation. Possible values:
|
SystemPid. |
integer |
Process ID. |
ParentFileFullName. |
string |
Path to the parent process file. |
ParentMd5 |
string |
MD5 hash of the parent process file. |
ParentSha256 |
string |
SHA256 hash of the parent process file. |
StartupParameters |
string |
Process start options. |
ParentSystemPid |
integer |
Parent process ID. |
ParentStartupParameters |
string |
Parent process startup settings. |
Method. |
string |
HTTP request method. |
Direction. |
string |
Connection direction. Possible values:
|
LocalIp |
string |
IP address of the local computer from which the remote connection attempt was made. |
LocalPort |
integer |
Port of the local computer from which the remote connection attempt was made. |
RemoteHostName |
string |
Name of the computer that was the target of the remote connection attempt. |
RemoteIp |
string |
IP address of the computer that was the target of the remote connection attempt. |
RemotePort |
integer |
Port of the computer that was the target of the remote connection attempt. |
URI |
string |
Address of the resource to which the HTTP request was made. |
KeyName |
string |
Path to the registry key. |
ValueName |
string |
Registry value name. |
ValueData |
string |
Registry value data. |
RegistryOperationType |
integer |
Type of the operation with the registry. Possible values:
|
PreviousKeyName |
string |
Previous path to the registry key. |
PreviousValueData |
string |
Previous name of the registry value. |
System.EventID.value |
string |
Type ID of the security event in the Windows log. |
LinuxEventType |
string |
Event type. Possible values:
|
System.Channel.value |
string |
Log name. |
System.EventRecordID.value |
string |
Entry ID in the log. |
System.Provider.Name.value |
string |
ID of the system that logged the event. |
EventData.Data.TargetDomainName.value |
string |
Domain name of the remote computer. |
EventData.Data.ObjectName.value |
string |
Name of the object that initiated the event. |
EventData.Data.PackageName.value |
string |
Name of the package that initiated the event. |
EventData.Data.ProcessName.value |
string |
Name of the process that initiated the event. |
VerdictName |
string |
Name of the detected object. |
RecordId |
integer |
ID of the triggered rule. |
ProcessingMode |
string |
Scanning mode. Possible values:
|
DetectedName |
string |
Name of the object. |
DetectedObjectType |
string |
Type of the object. Possible values:
|
ThreatStatus |
string |
Discovery mode. Possible values:
|
UntreatedReason |
string |
Object processing status. Possible values:
|
InteractiveInputText |
string |
Interpreter command. |
ObjectContent |
string |
Contents of the script sent to be scanned. |
ObjectContentType |
integer |
Content type of the script. Possible values:
|
FileOperationType |
integer |
Type of the file operation. Possible values:
|
PreviousFileName |
string |
Path to the directory where the file was previously located. |
PreviousFileFullName |
string |
Full name of the file including the path to the directory where the file was previously located and/or the previous file name. |
DroppedFileType |
integer |
Type of the modified file. Possible values:
|
API for managing Threat Response actions
Kaspersky Anti Targeted Attack Platform provides an API for performing Threat Response actions. Commands to carry out operations are received at the Central Node server and then relayed to the Endpoint Agent component.
You can use external systems to perform the following operations on hosts with the Endpoint Agent component:
All of the above operations are available on hosts that use Kaspersky Endpoint Agent for Windows or Kaspersky Endpoint Security for Windows in the role of the Endpoint Agent component.
If Kaspersky Endpoint Security for Linux is used in the role of the Endpoint Agent component, you can manage network isolation and run applications.
Request for getting the list of hosts with the Endpoint Agent component
To create a request for information about hosts with the Endpoint Agent component, the GET HTTP method is used.
Command syntax
GET "<URL of the Central Node server>:<port, 443 by default>/kata/response_api/v1/<external_system_id>/sensors"
If the request is processed successfully, a list of hosts with the Endpoint Agent component is displayed.
You can create a request for information about hosts with filters by IP address, name, or ID of the host. You can specify one, multiple, or all of these filters.
When specifying a host name, you need to keep in mind that the filter is case-sensitive.
GET "<URL of the Central Node server>:<port, 443 by default>/kata/response_api/v1/<external_system_id>/sensors?ip=<IP address of the host>&host=<host name>&sensor_id=<sensor_id>"
If the request is processed successfully, information about the selected host with the Endpoint Agent component is displayed.
Settings
Parameter |
Type |
Description |
|---|---|---|
external_system_id |
UUID |
Unique ID of the external system used for authorization in Kaspersky Anti Targeted Attack Platform. |
sensor_id |
UUID |
Unique ID of the host with the Endpoint Agent component |
ip |
string |
IP address of the host with the Endpoint Agent component. |
host |
string |
Name of the host with the Endpoint Agent component. |
Example of entering commands with parameters
GET "https://10.10.0.22:443/kata/response_api/v1/15301050-0490-4A41-81EA-B0391CF21EF3/sensors" |
GET "https://10.10.0.22:443/kata/response_api/v1/15301050-0490-4A41-81EA-B0391CF21EF3/sensors?ip=10.16.40.243&host=host4&sensor_id=DF64838B-B518-414B-B769-2B8BE341A2F0" |
Response
HTTP code: 200
Format: JSON
|
Returned value
Return code |
Description |
|---|---|
400 |
Authorization required. |
401 |
Incorrect parameters. |
500, 502, 503, 504 |
Internal server error. Repeat the request later. |
Request for information about network isolation and the existence of prevention rules for hosts with the Kaspersky Endpoint Agent component
HTTP method GET is used to create a request to display information about network isolation and the existence of prevention rules for hosts with the Endpoint Agent component.
Command syntax
GET "<URL of the Central Node server>:<port, 443 by default>/kata/response_api/v1/<external_system_id>/settings?sensor_id=<sensor_id>&settings_type=<network_isolation or prevention>"
If the request is processed successfully, the list of hosts with the Endpoint Agent component is displayed, listing hosts that had prevention rules or network isolation rules applied at the moment when the request was processed.
Settings
Parameter |
Type |
Description |
|---|---|---|
|
UUID |
Unique ID of the external system used for authorization in Kaspersky Anti Targeted Attack Platform. |
|
UUID |
Unique ID of the host with the Endpoint Agent component |
|
enum |
Rule type: network_isolation or prevention. |
Example of entering a command with switches
|
Response
HTTP code: 200
Format: JSON
|
Returned value
Return code |
Description |
|---|---|
|
Authorization required. |
|
Incorrect parameters. |
|
Specified hosts with the Endpoint Agent component not found. |
|
Internal error. Repeat the request later. |
Host network isolation management
To isolate a host with the Endpoint Agent component using the API, the following procedure is recommended for interacting with Kaspersky Anti Targeted Attack Platform:
- Creating a request for getting the list of hosts with the Endpoint Agent component
- Creating a request for getting information about hosts that already have network isolation enabled
- Creating a request for one of the following operations with hosts with the Endpoint Agent component:
You can manage the created network isolation rules in the web interface of the application.
Page top
Request to enable network isolation
To enable network isolation for a selected host, you must add a network isolation rule. To create the request, the HTTP POST method is used.
Command settings are passed in the body of the request in JSON format.
Command syntax
curl -k --cert <path to TLS certificate file> --key <path to private key file> -X POST "<URL of Central Node server>:<port, 443 by default>/kata/response_api/v1/<external_system_id>/settings?sensor_id=<sensor_id>&settings_type=network_isolation" -H 'Content-Type: application/json' -d '
{
"settings": {
"autoTurnoffTimeoutInSec": <network isolation time period>}
}
'
If the request is processed successfully, the network isolation rule is added. Network isolation for the selected host becomes active at the moment when the rule is added.
After a period of time specified when the request is created, network isolation becomes inactive. The network isolation rule itself is not deleted. If necessary, you can delete the selected rule.
To disable network isolation, you must create a request to disable the selected rule.
Settings
Parameter |
Type |
Description |
|---|---|---|
|
UUID |
Unique ID of the external system used for authorization in Kaspersky Anti Targeted Attack Platform. |
|
UUID |
Unique ID of the host with the Endpoint Agent component |
|
integer |
Period of time during which the network isolation will be active. Allowed range - 1 to 9999 hours. Network isolation time period is specified in seconds. For example, if you want to enable network isolation of a host for two hours, you must specify 7200 seconds. |
Example of entering a command with switches
|
Response
HTTP code: 200
Format: JSON
|
Returned value
Return code |
Description |
|---|---|
|
Incorrect parameters. |
|
Authorization required. |
|
Specified hosts with the Endpoint Agent component not found. |
|
Internal server error. Repeat the request later. |
If you want to edit the settings of the created network isolation rule, you must create a new request to add the rule with the new settings.
Page top
Request to disable network isolation
To disable network isolation for a selected host, you must create a request to disable the network isolation rule. HTTP method DELETE is used to create the request.
Command syntax
curl -k --cert <path to TLS certificate file> --key <path to private key file> -X DELETE "<URL of Central Node server>:<port, 443 by default>/kata/response_api/v1/<external_system_id>/settings?sensor_id=<sensor_id>&settings_type=network_isolation"
If the request is processed successfully, the network isolation rule is disabled.
Settings
Setting |
Type |
Description |
|---|---|---|
|
UUID |
Unique ID of the external system used for authorization in Kaspersky Anti Targeted Attack Platform. |
|
UUID |
Unique ID of the host with the Endpoint Agent component |
Example of entering a command with the DELETE parameter
|
To verify that network isolation is disabled, make a request for information about a task using the HTTP GET method.
Example of entering a command with the GET parameter
|
If network isolation is disabled, Kaspersky Anti Targeted Attack Platform returns a response to the external system in the following format:
{ "error": "Not Found" } |
Returned value
Return code |
Description |
|---|---|
|
Incorrect parameters. |
|
Authorization required. |
|
Specified hosts with the Endpoint Agent component not found. |
|
Internal server error. Repeat the request later. |
Request to add an exclusion to a network isolation rule
To add an exclusion to a previously created network isolation rule, you must create a request to add an exclusion. To create the request, the HTTP POST method is used.
Command settings are passed in the body of the request in JSON format.
Command syntax
curl -k --cert <path to TLS certificate file> --key <path to private key file> -X POST "<URL of Central Node server>:<port, 443 by default>/kata/response_api/v1/<external_system_id>/settings?sensor_id=<sensor_id>&settings_type=network_isolation" -H 'Content-Type: application/json' -d '
{"settings": {"excludedRules": [{"direction": "<outbound, inbound, or both>","protocol": <number of the IP protocol>,"remoteIpv4Address": "<IP address of the host with the Endpoint Agent component whose traffic must not be blocked>","localPortRange":{"fromPort": <port number>,"toPort": <port number>}},{"direction": "<outbound, inbound, or both>","protocol": <number of the IP protocol>,"remoteIpv4Address": "<IP address of the host with the Endpoint Agent component whose traffic must not be blocked>","remotePortRange":{"fromPort": <port number>,"toPort": <port number>}},{"direction": "<outbound, inbound, or both>","protocol": <number of the IP protocol>,"remoteIpv4Address": "<IP address of the host with the Endpoint Agent component whose traffic must not be blocked>"}],"autoTurnoffTimeoutInSec": <network isolation duration>}}'
If the request is processed successfully, the exclusion from the network isolation rule is added.
Settings
Parameter |
Type |
Description |
|
|
Unique ID of the external system used for authorization in Kaspersky Anti Targeted Attack Platform. |
|
|
Unique ID of the host with the Endpoint Agent component |
|
|
Direction of network traffic that must not be blocked. Possible values:
If you do not specify a value for this parameter, the default value is 'both', which means the application transmits traffic in both directions. |
|
|
IP protocol number assigned by the Internet Assigned Numbers Authority (IANA). If you do not specify a value for this parameter, by default, network isolation is applied to all protocols. |
|
|
IP address of the host with the Endpoint Agent component whose traffic must not be blocked |
|
|
Destination port. You can specify a destination port only if you have selected an outbound direction of network traffic. Port ranges cannot be specified for bidirectional traffic. |
|
|
Port from which the connection is initiated. You can specify a destination port only if you have selected an inbound direction of network traffic. Port ranges cannot be specified for bidirectional traffic. |
|
|
Period of time during which the network isolation will be active. Allowed range - 1 to 9999 hours. Network isolation time period is specified in seconds. For example, if you want to enable network isolation of a host for two hours, you must specify 7200 seconds. |
Example of entering a command with switches
|
Response
HTTP code: 200
Format: JSON
|
Returned value
Return code |
Description |
|---|---|
|
Incorrect parameters. |
|
Authorization required. |
|
Specified hosts with the Endpoint Agent component not found. |
|
Internal server error. Repeat the request later. |
If you want to edit the settings of the created exclusion, you must create a new request to add the exclusion with the new settings.
Page top
Managing prevention rules
You can use prevention rules to prevent files or processes from running on a selected hosts or all hosts with the Endpoint Agent component. For example, you can block certain applications that you consider insecure. The application identifies files based on their hash by using the MD5 and SHA256 hashing algorithms. A prevention rule created through external systems can contain multiple file hashes.
You can use external systems to manage all prevention rules created for a single host or all hosts at the same time. When you create a prevention rule for a selected host through external systems, Kaspersky Anti Targeted Attack Platform replaces all prevention rules applied to this host with a prevention rules with new parameters. For example, if you had added multiple prevention rules for a selected hosts through the application's web interface, and subsequently added a prevention rule through external systems, all prevention rules added in the web interface are replaced with the rule added through external systems.
When the parameters of a prevention rule created through external systems are modified, the application saves only the new parameters. For example, if you have added a prevention rule that contains hashes for multiple files, and want to add another hash to that rule, you must create a request to add a prevention rule and specify all hashes for which you had a prevention previously, plus the new hash.
The described scenario is also relevant for prevention rules applied to all hosts.
To create a prevention rule using the API, the following procedure is recommended for interacting with Kaspersky Anti Targeted Attack Platform:
- Creating a request for getting the list of hosts with the Endpoint Agent component
- Create a request for getting information about hosts that already have prevention rules.
- Create a request for one of the following operations with prevention rules:
Added prevention rules are displayed in the web interface of the application in the Prevention section, Prevention rules subsection.
If you are creating a prevention rule for all hosts through an external system, you must first make sure that no prevention rule for the same file exists on the server or is applied to one or multiple hosts. This prerequisite is also relevant if you want to create a prevention rule through an external system for a selected host: you must make sure that a prevention rule for the same file does not exist on the server and is not applied to all hosts. Otherwise, the server returns an error to the external system with a list of hosts that already have a prevention rule applied.
If the prevention rule created through an external system contains multiple file hashes, the error information mentions only the first file that caused the error. Information about other duplicated prevention rules is not displayed.
To modify a prevention rule previously created through the web interface or external systems, you must create a request to add a prevention rules with updated parameters.
Page top
Request to create a prevention rule
To create the request, the HTTP POST method is used. Command settings are passed in the body of the request in JSON format.
Command syntax
curl -k --cert <path to TLS certificate file> --key <path to private key file> -X POST "<URL of Central Node server>:<port, 443 by default>/kata/response_api/v1/<external_system_id>/settings?sensor_id=<sensor_id or all, if you want to create the prevention rule for all hosts>&settings_type=prevention" -H 'Content-Type: application/json' -d '
{
"settings": {
"objects": [
{
"file": {
"<sha256 or md5>": "<SHA256- or MD5-hash of the file that you want to prevent from starting>"
}
},
{
"file": {
"<sha256 or md5>": "<SHA256- or MD5-hash of the file that you want to prevent from starting>"
}
}
]
}
}
'
If the request is processed successfully, the prevention rule is added. The prevention rule becomes active at the moment when it is added.
If necessary, you can delete the prevention rule.
Settings
Parameter |
Type |
Description |
|---|---|---|
|
UUID |
Unique ID of the external system used for authorization in Kaspersky Anti Targeted Attack Platform. |
|
UUID |
Unique ID of the host with the Endpoint Agent component |
|
string |
Type of the object that you want to prevent from running. Possible value of the parameter: file. |
|
string |
SHA256 or MD5 has of the object that you want to prevent from running. |
Example of entering a command with switches
|
Response
HTTP code: 200
Format: JSON
|
Returned value
Return code |
Description |
|---|---|
|
Incorrect parameters. |
|
Authorization required. |
|
Specified hosts with the Endpoint Agent component not found. |
|
Internal server error. Repeat the request later. |
Request to delete a prevention rule
You can delete a prevention rule using a new request with blank values or a request with the DELETE parameter. POST and DELETE HTTP methods are used to create requests.
Command syntax for a new request
Command settings are passed in the body of the request in JSON format.
curl -k --cert <path to TLS certificate file> --key <path to private key file> -X POST "<URL of Central Node server>:<port, 443 by default>/kata/response_api/v1/<external_system_id>/settings?sensor_id=<sensor_id or all, if you want to delete the prevention rule for all hosts>&settings_type=prevention" -H 'Content-Type: application/json' -d '
{
"settings": {
"objects": []
}
}
'
Command syntax with the DELETE parameter
curl -k --cert <path to TLS certificate file> --key <path to private key file> -X DELETE "<URL of Central Node server>:<port, 443 by default>/kata/response_api/v1/<external_system_id>/settings?sensor_id=<sensor_id or all, if you want to delete the prevention rule for all hosts>&settings_type=prevention"
Settings
Parameter |
Type |
Description |
|---|---|---|
|
UUID |
Unique ID of the external system used for authorization in Kaspersky Anti Targeted Attack Platform. |
|
UUID |
Unique ID of the host with the Endpoint Agent component |
Example of command for a new request
|
Example of entering a command with the DELETE parameter
|
If the request is processed successfully, the prevention rule is deleted.
To verify that the prevention rule is deleted, make a request for information about the prevention rule using the HTTP GET method.
Example of entering a command with the GET parameter
|
If the prevention rule was deleted, Kaspersky Anti Targeted Attack Platform returns a response to the external system in the following format:
{ "error": "Not Found" } |
Returned value
Return code |
Description |
|---|---|
|
Incorrect parameters. |
|
Authorization required. |
|
Specified hosts with the Endpoint Agent component not found. |
|
Internal server error. Repeat the request later. |
Managing the application run task
To manage the application run task using the API, the following procedure is recommended for interacting with Kaspersky Anti Targeted Attack Platform:
- Creating a request for information about settings, creation time, and completion status of the task
- Creating a request for one of the following operations with the task:
Added tasks are displayed in the web interface of the application in the Tasks section.
Page top
Request to obtain information about a task
To create a request for getting information about a task, the HTTP GET method is used.
Command syntax
GET "<URL of the Central Node server>:<port, 443 by default>/kata/response_api/v1/<external_system_id>/tasks/<task_id>?settings=<true or false>"
If the request is processed successfully, information is displayed about settings, creation time, and completion status of the task.
Settings
Settings |
Type |
Description |
|---|---|---|
|
|
Unique ID of the external system used for authorization in Kaspersky Anti Targeted Attack Platform. |
|
|
Unique ID of the host with the Endpoint Agent component |
|
|
Unique ID of the task. |
|
|
Possible values:
|
Example of entering a command with switches
|
Response
HTTP code: 200
Format: JSON
} } }
|
Returned value
Return code |
Description |
|---|---|
|
Incorrect parameters. |
|
Authorization required. |
|
The task with the specified ID was already exists. |
|
Internal server error. Repeat the request later. |
Request to create a task
The HTTP POST method is used for requests to run the Kaspersky Anti Targeted Attack Platform application. Command settings are passed in the body of the request in JSON format.
Command syntax
curl -k --<path to the TLS certificate file> --key <path to private key file> -X POST "<URL of Central Node server>:<port, 443 by default>/kata/response_api/v1/<external_system_id>/tasks/<task_id>?sensor_id=<sensor_id>&task_type=run_process" -H 'Content-Type: application/json' -d '
{
"task": {
"shedule": {"startNow": <true or false>},
"execCommand": "<name of the application that you want to run>",
"cmdLineParameters": "<additional options for running the file or command>",
"workingDirectory": "<working directory>"
}
}
'
If the request is processed successfully, the run application task is created.
Settings
Setting |
Type |
Description |
|---|---|---|
|
UUID |
Unique ID of the external system used for authorization in Kaspersky Anti Targeted Attack Platform. |
|
UUID |
Unique ID of the host with the Endpoint Agent component |
|
UUID |
Unique ID of the task. |
Example of entering a command with switches
|
Response
HTTP code: 200
Format: JSON
} } }
|
Returned value
Return code |
Description |
|---|---|
|
Incorrect parameters. |
|
Authorization required. |
|
The task with the specified ID was not found. |
|
Internal server error. Repeat the request later. |
If you want to edit the settings of the created task, you must create a new request to add the task with the new settings.
Page top
Request to delete a task
To create a request to delete a Kaspersky Anti Targeted Attack Platform task, the HTTP DELETE method is used.
Command syntax
curl -k --<path to TLS certificate file> --key <path to private key file> -X DELETE "<URL of the Central Node server>:<port, 443 by default>/kata/response_api/v1/<external_system_id>/tasks/<task_id>
If the request is processed successfully, the application run task is deleted.
Settings
Setting |
Type |
Description |
|---|---|---|
|
UUID |
Unique ID of the external system used for authorization in Kaspersky Anti Targeted Attack Platform. |
|
UUID |
Unique ID of the task. |
Example of entering a command with the DELETE parameter
|
If the request is processed successfully, the prevention rule is deleted.
To verify that the task is deleted, make a request for information about the task using the HTTP GET method.
Example of entering a command with the GET parameter
|
If the task was deleted, Kaspersky Anti Targeted Attack Platform returns a response to the external system in the following format:
{ "error": "Not Found" } |
Returned value
Return code |
Description |
|---|---|
|
Incorrect parameters. |
|
Authorization required. |
|
The task with the specified ID was not found. |
|
Internal server error. Repeat the request later. |
Using Kaspersky Anti Targeted Attack Platform API NDR
The REST API server, which provides access to the NDR functionality to external systems, runs on the Central Node server and processes requests using the REST (Representational State Transfer) architectural style. Requests to the REST API server are made using HTTPS. You can configure the REST API server under Settings → Connection Servers (including replacing the default self-signed certificate with a trusted certificate).
The JSON format is used to represent data in requests and responses.
The documentation containing descriptions of requests based on the REST architectural style is published as an Online Help Guide on the Kaspersky Online Help page. This documentation is a developer guide in English. The developer guide also provides sample code and detailed descriptions of callable elements that are available in requests sent to the REST API server.
![]() Open the documentation describing requests to the REST API server, version 3
Open the documentation describing requests to the REST API server, version 3
![]() Open the documentation describing requests to the REST API server, version 4
Open the documentation describing requests to the REST API server, version 4
External systems can use Kaspersky Anti Targeted Attack Platform API to:
- Receive information about devices known to the application.
- Add, modify, and delete devices.
- Receive information about registered network traffic events (NDR events).
- Send NDR events to Kaspersky Anti Targeted Attack Platform (the system event type with code 4000005400 is used for registering the events).
- Receive information about detected vulnerabilities.
- Receive application messages and audit records.
- Receive information about allow rules.
- Enable, disable, and delete allow rules.
- Receive information about risks associated with devices.
- Receive information about address spaces.
- Send the network topology map report to Kaspersky Anti Targeted Attack Platform.
- Send, receive, and delete information about users on devices.
- Send and receive information about applications and patches on devices.
- Send and delete information about executable files on devices.
- Send the contents of the device logs.
- Receive the following application data:
- List of servers with application components
- List of monitoring points and their parameters
- List of supported protocol stacks and their parameters
- List of NDR event types and their parameters
- Current state and operating mode of technologies
- Application version and release dates of the installed updates
- Information about the added license key
- Application localization language
All of the listed actions are available when making requests to the REST API server version 4. Some of these actions are not supported when making requests to the REST API server version 3.
External systems using the Kaspersky Anti Targeted Attack Platform API connect to the Central Node component via connectors. Connectors use certificates for a secure connection. For each external system that you want to send requests to the REST API server, you need to create a separate connector in Kaspersky Anti Targeted Attack Platform.
To connect to Kaspersky Anti Targeted Attack Platform, the external system must use an authentication token. Kaspersky Anti Targeted Attack Platform issues an authentication token upon request from the external system and uses the certificates of the connector created for that system for the token. The authentication token remains valid for 10 hours. The external system can renew the authentication token by special request.
Documentation containing a description of queries for authentication token operations is published as an Online Help Guide on the Kaspersky Online Help page. This documentation is a developer guide in English.
![]() Open the documentation describing queries for authentication token operations, version 3.0
Open the documentation describing queries for authentication token operations, version 3.0
![]() Open the documentation describing queries for authentication token operations, version 4
Open the documentation describing queries for authentication token operations, version 4
Kaspersky Anti Targeted Attack Platform API allows interacting with external systems in the following ways:
- Interaction based on the REST architectural style
- Interaction over the WebSocket protocol
External systems can use the WebSocket protocol for interaction in the Kaspersky Anti Targeted Attack Platform API to create subscriptions to modified values received by the application.
Ensuring security when using Kaspersky Anti Targeted Attack Platform API
External systems access the functionality of the application using the Kaspersky Anti Targeted Attack Platform API by establishing encrypted HTTPS connections. Certificates issued by the Central Node component of Kaspersky Anti Targeted Attack Platform are used to secure the connections. This component issues certificates for the connectors that external systems use to connect to the Server.
A separate connector must be created in Kaspersky Anti Targeted Attack Platform for each external system. A connection can be established through a connector only by using the specific certificate that was issued by the Central Node component and saved in the communication data package for that connector. A connection cannot be established if the external system presents a certificate from a different connector, a different Central Node component of Kaspersky Anti Targeted Attack Platform, or a certificate used for other connections (for example, a certificate of the Sensor component).
After establishing an encrypted connection, the external system must request an authentication token for the connector that the external system will use in requests sent to the Central Node REST API server.
An authentication token is valid for 10 hours after it was issued. If a token needs to be used for a longer period, the external system must request a time extension before the token expires.
For information about requests and methods supported by Kaspersky Anti Targeted Attack Platform API, see the documentation for the Kaspersky Anti Targeted Attack Platform API.
When processing requests from external systems, Kaspersky Anti Targeted Attack Platform uses the audit log to record information about attempts to perform the following operations:
- Receive an authentication token.
- Extend the validity period for an authentication token.
- Add a device to the devices table.
- Edit device information.
- Delete a device.
- Query the audit log (when first reading audit entries through the connector after loading the web server).
Creating and using connectors for Kaspersky Anti Targeted Attack Platform API
To enable interaction between an external system and Kaspersky Anti Targeted Attack Platform API, you need to add a connector for that system. When creating a connector, you must indicate the Generic system type for the connector.
When adding a connector and when creating a new communication data package for this connector, the Central Node generates a communication data package that you need to use for the connector to work.
A communication data package is an archive containing the following files:
- The certificates.pfx file contains the encrypted public key of the Central Node certificate and the certificate issued by the Central Node for the connector (with the private key). The contents of the file are encrypted with the password that was set when the connector was added or when a new communication data package was created for this connector.
- The metadata.json file contains the configuration data for the connector. Data is represented in JSON format.
The listed files must be used to connect the external system through the connector. To decrypt the certificates.pfx file and apply the certificate and keys that it contains, you can use the standard methods for handling files of this format (for example, openssl commands). The addresses specified in the metadata.json file are required for the connector to work and for sending requests to the REST API server.
The certificate and configuration data in the communication data package are valid until a new communication data package is created or until the connector is removed from the application.
Page top
Sources of information about the application
Kaspersky Anti Targeted Attack Platform page on the Kaspersky website
On the Kaspersky Anti Targeted Attack Platform page, you can find general information about the application, its capabilities and features.
The Kaspersky Anti Targeted Attack Platform page contains a link to the online store. In the online store, you can buy the application or renew the license.
Kaspersky Anti Targeted Attack Platform page in the Knowledge Base
Knowledge Base is a section on the Technical Support website.
On the Kaspersky Anti Targeted Attack Platform page in the Knowledge Base, you can read articles that provide useful information, recommendations, and answers to frequently asked questions about purchasing, installing, and using the application.
Knowledge Base articles can answer questions related not only to Kaspersky Anti Targeted Attack Platform but also to other Kaspersky applications. Knowledge Base articles may also contain news from Technical Support.
Discussing Kaspersky software on the Forum
If your question does not require an immediate answer, you can discuss it with Kaspersky experts and other users on our Forum.
On the Forum, you can view existing topics, post comments, and create new discussion topics.
Page top
Contacting the Technical Support Service
This section describes the ways to get technical support and the terms on which it is available.
How to obtain Technical Support
If you cannot find a solution to your problem in the program documentation or in one of the sources of information about Kaspersky Anti Targeted Attack Platform, we recommend that you contact Technical Support. Technical Support staff will answer your questions about installing and using Kaspersky Anti Targeted Attack Platform.
Kaspersky provides support of Kaspersky Anti Targeted Attack Platform throughout its life cycle (see the product life cycle page). Before you contact Technical Support, please read the technical support rules.
You can contact Technical Support in one of the following ways:
- Visit the Technical Support website.
- Send a request to Technical Support through the Kaspersky CompanyAccount portal.
Technical Support via Kaspersky CompanyAccount
Kaspersky CompanyAccount is a portal for companies that use Kaspersky software. The Kaspersky CompanyAccount portal is designed to facilitate interaction between users and Kaspersky experts through online requests. The Kaspersky CompanyAccount portal allows monitoring the progress of online request processing by Kaspersky staff and keeping the history of electronic requests.
You can register all of your organization's employees under a single account on Kaspersky CompanyAccount. A single account lets you centrally manage electronic requests from registered employees to Kaspersky and also manage the privileges of these employees via Kaspersky CompanyAccount.
The portal Kaspersky CompanyAccount is available in the following languages:
- English
- Spanish
- Italian
- German
- Polish
- Portuguese
- Russian
- French
- Japanese
To learn more about Kaspersky CompanyAccount, visit the Technical Support website.
Page topGlossary
Advanced persistent threat (APT)
A sophisticated targeted attack against the corporate IT infrastructure that simultaneously uses different methods to infiltrate the network, hide on the network, and gain unobstructed access to confidential data.
Alert
A record of the detection or a set of detections made as a result of scanning the object with Kaspersky Anti Targeted Attack Platform modules and technologies. Displayed in the table of alerts.
Alternate data stream
Data streams of the NTFS file system (alternate data streams) are intended for additional attributes or information on a file.
Each file in the NTFS file system consists of a set of streams. The main stream contains the file contents. The other (alternate) streams are intended for metadata. Streams can be created, deleted, individually saved, renamed, and can even be run as a process.
Alternate streams can be used by hackers for concealed transmission or receipt of data from a computer.
Anti-Malware Engine
Application core. Scans files and objects for viruses and other threats to the corporate IT infrastructure using anti-virus databases.
Backdoor program
A program planted by hackers on a compromised computer in order to be able to access this computer in the future.
Central Node
Application component. Scans data, analyzes the behavior of objects, and publishes analysis results in the web interface of the application.
Communication channel bandwidth
The highest possible speed of information transfer in the specific communication channel.
CSRF attack
Cross-Site Request Forgery (also referred to as an "XSRF attack"). Attack on website users by exploiting vulnerabilities of the HTTP protocol. The attack enables actions to be performed under the guise of an authorized user of a vulnerable website. For example, under the guise of an authorized user of a vulnerable website, a hacker can covertly send a request to the server of an external payment system to transfer money to the hacker's account.
Detection
The result of an object being scanned by an individual module or component of the application.
Distributed solution
Two-level hierarchy of servers with Central Node components installed. This hierarchy allocates a primary control server (Primary Central Node (PCN)) and secondary servers (Secondary Central Nodes (SCN)).
Dump
Contents of the working memory of a process or the entire RAM of the system at a specified moment of time.
End User License Agreement
Binding agreement between you and AO Kaspersky Lab, stipulating the terms on which you may use the application.
Endpoint Agent component
Application component. Installed on workstations and servers of the corporate IT infrastructure that run Microsoft Windows, Linux and macOS operating systems. Continuously monitors processes running on those computers, active network connections, and files that are modified.
ICAP client
The system through which Kaspersky Anti Targeted Attack Platform receives traffic.
ICAP data
Data received by the ICAP protocol (Internet Content Adaptation Protocol). This protocol allows filtering and modifying data of HTTP requests and HTTP responses. For example, it allows scanning data for viruses, blocking spam, and denying access to personal resources. The ICAP client is normally a proxy server that interacts with the ICAP server by the ICAP protocol. Kaspersky Anti Targeted Attack Platform receives data from the proxy server of your organization after this data was processed on the ICAP server.
Intrusion Detection System
Application module. Scans the Internet traffic for signs of intrusions into the corporate IT infrastructure.
IOA
Indicator of Attack. Description of suspicious behavior of objects within a corporate IT infrastructure that may indicate a targeted attack on that organization.
IOC
Indicator of Compromise. A set of data about a malicious object or malicious activity.
IOC file
IOC files contain a set of indicators that are compared to the indicators of an event. If the compared indicators match, the application considers the event to be a detection and creates an alert. The likelihood of an alert may increase if a scan detects exact matches between the data of an object and several IOC files.
Kaspersky Anti Targeted Attack Platform
Solution designed for the protection of a corporate IT infrastructure and timely detection of threats such as zero-day attacks, targeted attacks, and complex targeted attacks known as advanced persistent threats (hereinafter also referred to as "APT").
Kaspersky Private Security Network
A solution that allows users of Kaspersky anti-virus applications to access Kaspersky Security Network databases without sending data from their computers to Kaspersky Security Network servers.
Kaspersky Secure Mail Gateway
A solution designed for protection of incoming and outgoing email against malicious objects and spam, and for content filtering of messages. The solution lets you deploy a virtual mail gateway and integrate it into the existing corporate mail infrastructure. An operating system, mail server, and Kaspersky anti-virus application are preinstalled on the virtual mail gateway.
Kaspersky Security Network (KSN)
An infrastructure of cloud services that provides access to the online Knowledge Base of Kaspersky which contains information about the reputation of files, web resources, and software. The use of data from Kaspersky Security Network ensures faster responses by Kaspersky applications to threats, improves the performance of some protection components, and reduces the likelihood of false alarms.
Kaspersky Threat Intelligence Portal
Kaspersky information system Contains and displays reputation information for files and URL addresses.
KATA
Kaspersky Anti Targeted Attack. Functional block of Kaspersky Anti Targeted Attack Platform which detects threats on the perimeter of the enterprise IT infrastructure.
KEDR
Kaspersky Endpoint Detection and Response. Functional block of Kaspersky Anti Targeted Attack Platform which provides protection for the local area network of the organization.
Kerberos authentication
A mechanism for mutual authentication of client and server before a connection is established between them, which allows communication over unprotected networks. The mechanism is based on using a ticket, which is issued to the user by a trusted authentication center.
Keytab file
A file containing pairs of unique names (principals) of clients that are allowed to use Kerberos authentication and encrypted keys derived from the user password. Systems that support Kerberos use keytab files to authenticate users without entering a password.
Local reputation database of KPSN
Database of the reputations of objects (files or URLs) that is stored on the Kaspersky Private Security Network server but not on Kaspersky Security Network servers. Local reputation databases are managed by the KPSN administrator.
Malicious web addresses
URLs of resources distributing malicious software.
MIB (Management Information Base)
Virtual database used to manage objects that are transmitted over the SNMP protocol.
Mirrored traffic
A copy of traffic redirected from one switch port to another port of the same switch (local mirroring) or to a remote switch (remote mirroring). The network administrator can configure which part of traffic should be mirrored for transmission to Kaspersky Anti Targeted Attack Platform.
Kaspersky Anti Targeted Attack Platform supports receiving mirrored traffic from aggregating devices: a network packet broker or a network tap. If filtering is to be applied to traffic coming from aggregating devices, the hardware requirements of Kaspersky Anti Targeted Attack Platform must be adjusted. To determine the actual hardware requirements of the solution, we recommend doing a pilot deployment first.
MITM attack
Man in The Middle. An attack on the IT infrastructure of an organization in which a hacker hijacks the communication link between two access points, relays it, and modifies the connection between these access points if necessary.
MITRE technique
The MITRE ATT&CK (Adversarial Tactics, Techniques & Common Knowledge) database contains descriptions of hacker behavior based on the analysis of real attacks. It is a structured list of known hacker techniques represented as a table.
Multitenancy
Operation mode in which Kaspersky Anti Targeted Attack Platform is used to protect the infrastructure of multiple organizations or branch offices of the same organization simultaneously.
New generation threats
Corporate IT infrastructure threats capable of overwriting, altering, encrypting, or distorting their code to a point where matches against signatures can no longer be detected by a security system.
NTP server
Precision time server using the Network Time Protocol.
OpenIOC
An open, XML-based standard for describing indicators of compromise containing over 500 different indicators of compromise.
Phishing URL addresses
URL addresses of resources designed to obtain unauthorized access to confidential data of users. Phishing is usually aimed at stealing various financial data.
Sandbox
Application component. Starts virtual images of operating systems. Starts files in these operating systems and tracks the behavior of files in each operating system to detect malicious activity and signs of targeted attacks to the corporate IT infrastructure.
Sensor
Application component. Receives data.
Service principal name (SPN)
Unique ID of the service on the network for Kerberos authentication.
SIEM system
Security Information and Event Management System. Solution for managing information and events in an organization's security system.
Signature
Code in information protection databases that contains a description of known threats.
SPAN
Switch Port Analyzer. Technology for mirroring traffic from one port to another.
Syslog
The standard for sending and recording messages about events occurring in the system employed on UNIX and GNU/Linux platforms.
TAA (IOA) rule
One sign of suspicious behavior of an object in the corporate IT infrastructure that causes Kaspersky Anti Targeted Attack Platform to consider an event to be a detection and creates an alert. A TAA (IOA) rule contains a description of a sign of an attack and recommended countermeasures.
Targeted attack
Attack that targets a specific person or organization. Unlike mass attacks by computer viruses designed to infect as many computers as possible, targeted attacks can be aimed at infecting the network of a specific organization or even a separate server within the corporate IT infrastructure. A dedicated Trojan program can be written to stage each targeted attack.
Targeted Attack Analyzer
Application module. Analyzes and monitors network activity of software installed on computers of the corporate LAN using TAA (IOA) rules. Searches for signs of network activity that the user of Kaspersky Anti Targeted Attack Platform is advised to direct his/her attention, as well as signs of targeted attacks to the corporate IT infrastructure.
Tenant
An individual organization or branch office of an organization to which the Kaspersky Anti Targeted Attack Platform solution is being provided.
TLS encryption
Encryption of connection between two servers, which ensures secure transmission of data between servers on the Internet.
Tracing
The application is run in debugging mode; after each command is executed, the application is stopped and the result of this step is displayed.
VIP status
Status of detections with special access permissions. For example, alerts with the VIP status cannot be viewed by users with the Security officer role.
YARA
Application module. Scans files and objects for signs of targeted attacks on the corporate IT infrastructure using YARA Rules databases created by users of Kaspersky Anti Targeted Attack Platform.
YARA rules
A publicly available classification of malware, which contains signatures of signs of targeted attacks and intrusions into the corporate IT infrastructure, which is used by Kaspersky Anti Targeted Attack Platform to scan files and objects.
Zero-day attack
An attack targeting the corporate IT infrastructure by exploiting zero-day vulnerabilities in software. These are software vulnerabilities that hackers find and exploit before the software vendor has a chance to release a patch.
Zero-day vulnerability
A software vulnerability that hackers find and exploit before the software vendor has a chance to release a patch with fixed program code.
Page top
Information about third-party code
Information about third-party code is contained in the file legal_notices.txt, in the program installation directory.
Page top
Trademark notices
Registered trademarks and service marks are the property of their respective owners.
Adobe, Flash are registered trademarks or trademarks of the Adobe company in the United States and/or other countries.
AMD is a trademark or registered trademark of Advanced Micro Devices, Inc.
Apple, Mac, Macintosh, macOS, and Safari are trademarks of Apple Inc.
Ubuntu is a registered trademark of Canonical Ltd.
Cisco and Snort are trademarks or registered trademarks of Cisco Systems, Inc. and/or its affiliates in the USA and elsewhere.
Citrix is a registered trademark or trademark of the Cloud Software Group, Inc. and / or its subsidiaries in the United States and / or other countries.
Docker and the Docker logo are trademarks or registered trademarks of Docker, Inc. in the United States and/or other countries. Docker, Inc. and other parties may also have rights to trademarks described in other terms used herein.
Google, Google Chrome, Android are trademarks of Google LLC.
Intel, Core, and Xeon are trademarks of Intel Corporation or its subsidiaries.
Linux is the registered trademark of Linus Torvalds in the United States and other countries.
Microsoft, Active Directory, Excel, Internet Explorer, Microsoft Edge, PowerPoint, PowerShell, Win32, Windows, Windows PowerShell, Windows Server, and Windows XP are trademarks of the Microsoft group of companies.
Mozilla and Firefox are trademarks of the Mozilla Foundation in the United States and other countries.
NVIDIA is a registered trademark of the NVIDIA Corporation.
OpenSSL is a trademark of the OpenSSL Software Foundation.
Java is a registered trademark of Oracle and/or its affiliates.
Python is a trademark or registered trademark of the Python Software Foundation.
CentOS is a trademark or registered trademark of Red Hat, Inc. or its subsidiaries in the United States and other countries.
Debian is a registered trademark of Software in the Public Interest, Inc.
VMware, VMware ESXi are registered trademarks and/or trademarks of VMware, Inc. in the United States and other countries.
UNIX is a registered trademark in the United States and other countries, licensed exclusively through X/Open Company Limited.
Page top