Contents
Viewing information on Kaspersky dashboard
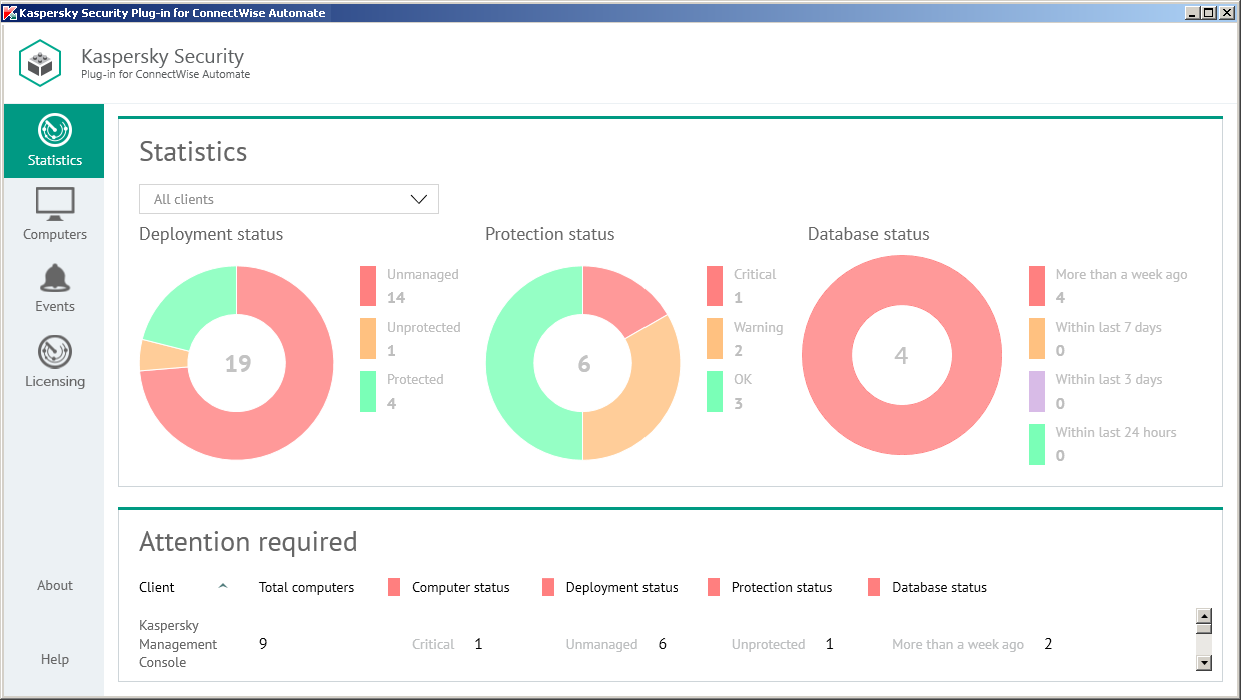
Kaspersky Security Plug-in for ConnectWise Automate adds the Kaspersky icon to the ConnectWise Automate Control Center toolbar. When you click this icon, the Kaspersky Security Plug-in for ConnectWise Automate window opens. This window contains a set of dashboards where you can view Kaspersky Lab-related information about the computers in your network.
When you open the Kaspersky Security Plug-in for ConnectWise Automate window, the Statistics tab is displayed, showing a set of charts with information about the protection status of the computers on the network.
In the left vertical pane of the Kaspersky Security Plug-in for ConnectWise Automate, window you can shift between the following tabs:
- Statistics—Click this tab to view high-level information about computer protection, deployment, and database status in graphical format.
- Computers—Click this tab to view detailed information about the computers.
- Events—Click this tab to view information about events registered by the Kaspersky Lab solution that is integrated with ConnectWise Automate.
- Licensing—Click this tab to view information about the Kaspersky Lab keys used by all managed devices on the network.
Viewing protection information
This section describes the Statistics tab and explains how to use it to view aggregated protection information about the computers of all your client companies.
About the Statistics tab
On the Statistics tab, you can view aggregated protection information, represented as a set of charts, about the computers of all your clients. The charts help you to manage the state of your network by allowing you to observe statistical information about the computers. You can monitor protection statuses of computers on the network by viewing information provided by Kaspersky Security Plug-in for ConnectWise Automate. For example, you can immediately detect how many computers on the network are in the critical state or have outdated anti-virus databases.
Viewing protection information
The following pie charts provide snapshots of several aspects of computer protection:
You can filter information displayed in the charts by client and location.
To filter information displayed,
In the Clients drop-down list, select a client or location you want to view.
In the Attention required section below the charts, you can also view statistics on clients that have computers requiring your attention. This section shows information on the number of computers on the network of client companies that require your attention. These are the computers with the following statuses:
- Critical protection status.
- Unmanaged and Unprotected deployment status.
- Anti-virus databases were issued more than a week ago database status.
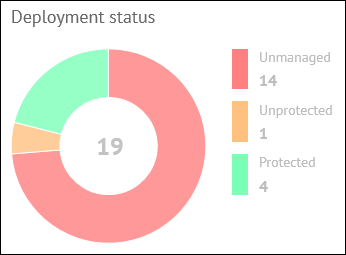
Deployment status chart
The Deployment status chart displays the total number of computers managed by ConnectWise Automate, which have the deployment statuses below.
Deployment status chart
- Unmanaged—Kaspersky Security Center Network Agent is not installed (computers are not managed by Kaspersky Security Center or Kaspersky Endpoint Security Cloud).
- Unprotected—Kaspersky Security Center Network Agent is installed (computers are managed by Kaspersky Security Center or Kaspersky Endpoint Security Cloud) but no real-time protection solution by Kaspersky Lab is installed.
- Protected—Both Kaspersky Security Center Network Agent and a real-time protection solution by Kaspersky Lab are installed.
In the middle of the pie chart, the total number of computers is displayed. To the right of the chart, the legend shows details on how many computers, with each status, are on the network.
When you click any deployment status color icon in the chart legend or any chart sector, a window appears, showing details on the computers with the selected deployment status.
The following information is displayed for each computer:
- Computer—Name of the computer. The computer name can be different in ConnectWise Automate and in the Kaspersky Lab solution. The computer name for ConnectWise Automate is displayed above and the name for Kaspersky Security Center / Kaspersky Endpoint Security Cloud is displayed below. When you click the computer name, the Computer Management screen of ConnectWise Automate Control Center is displayed for this computer.
Computer names
- Client / Location—Name of the ConnectWise Automate client and location that the computer belongs to.
- Workspace—If you use Kaspersky Endpoint Security Cloud, this field shows the name of the workspace to which the selected computer belongs. When you click the workspace name, the corresponding Kaspersky Endpoint Security Cloud workspace opens in your browser window.
Protection status chart
Protection status chart displays the total number of computers, managed by Kaspersky Security Center or Kaspersky Endpoint Security Cloud (depending on the solution you use), which take the following protection statuses: Critical, Warning, or OK.
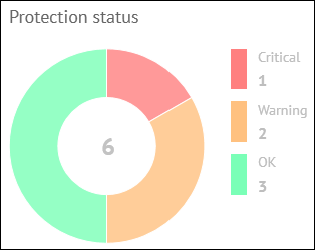
Protection status chart
In the middle of the chart, the total number of managed computers is displayed. To the right of the chart, the legend shows the number of computers with each status. This allows you to instantly know the number of critical or warning computers on the network.
When you click any computer status color icon in the chart legend, or any chart sector, a window appears, showing details on the computers with the selected status.
The following information is displayed for each computer:
- Computer—Name of the computer. The computer name can be different in ConnectWise Automate and in the Kaspersky Lab solution. The computer name for ConnectWise Automate is displayed above and the name for Kaspersky Security Center / Kaspersky Endpoint Security Cloud is displayed below. When you click the computer name, the Computer Management screen of ConnectWise Automate Control Center is displayed for this computer.
Computer names
- Client / Location—Name of the ConnectWise Automate client and location that the computer belongs to.
- Status description—Detailed description of the problems detected on the computer, if the computer status differs from OK.
- Workspace—If you use Kaspersky Endpoint Security Cloud, this field shows the name of the workspace to which the selected computer belongs. When you click the workspace name, the corresponding Kaspersky Endpoint Security Cloud workspace opens in your browser window.
Database status chart
The Database status chart displays the total number of computers (managed by Kaspersky Security Center or Kaspersky Endpoint Security Cloud) on which a real-time protection solution by Kaspersky Lab is installed, categorized according to the time since the anti-virus databases being used were issued.
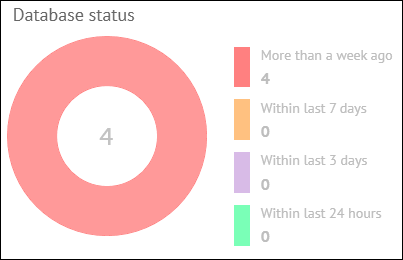
Database status chart
In the middle of the pie chart, the total number of protected computers is displayed. To the right of the chart, the legend shows the number of computers in each group. This allows you to see the number of computers that use anti-virus databases issued a long time ago.
When you click any database status color icon in the chart legend or in any color sector of the pie chart, a window opens showing details about the computers with the selected database status.
The following information is displayed for each computer:
- Computer—Name of the computer. The computer name can be different in ConnectWise Automate and in the Kaspersky Lab solution. The computer name for ConnectWise Automate is displayed above and the name for Kaspersky Security Center / Kaspersky Endpoint Security Cloud is displayed below. When you click the computer name, the Computer Management screen of ConnectWise Automate Control Center is displayed for this computer.
Computer names
- Client / Location—Name of the ConnectWise Automate client and location that the computer belongs to.
- Workspace—If you use Kaspersky Endpoint Security Cloud, this field shows the name of the workspace to which the selected computer belongs. When you click the workspace name, the corresponding Kaspersky Endpoint Security Cloud workspace opens in your browser window.
Viewing computer information
This section describes the Computers tab and explains how to use it to view information about managed computers on your network.
About the Computers tab
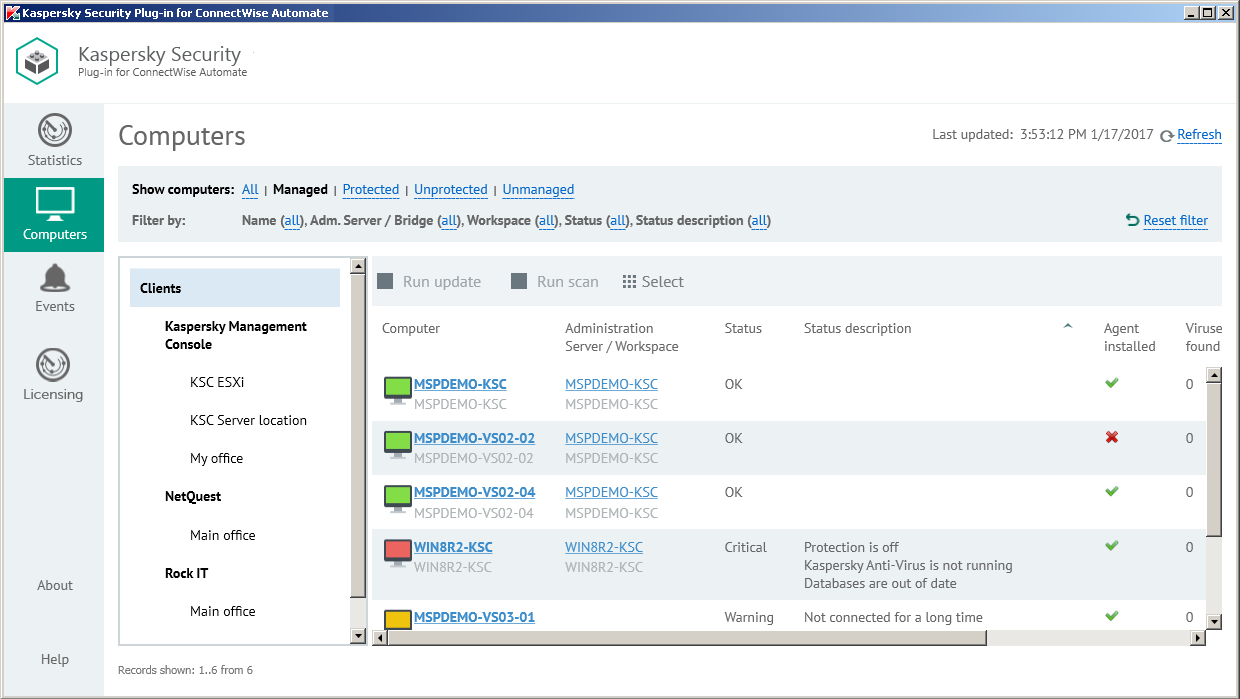
The Computers tab displays a list of all computers managed by ConnectWise Automate.
Viewing computer information
Click the Computers tab to view information, provided by the Kaspersky Lab solution, about protection of the computers in your network. You can use the left navigation tree and the set of filters to quickly find required computers, for example, those installed in a specific location or with a specific protection status.
Filters in the top pane allow convenient searching of computers. You can filter the computers by management and protection states, name, and status. To restrict your computer selection and to view only the computers with selected properties, apply several filters at the same time. Every time you open the Computers tab, the previously used filter settings are restored—there is no need to set up filters again.
Use the navigation tree to display the computers of a specific client or location. Do one of the following:
- Click the Clients node to display all the computers.
- Click the name of a specific client to display the computers of this client.
- Click the name of a specific location to display the computers in this location.
Information about the computers is displayed as a table. You can sort information in the table by any of the table columns by clicking the column header. For each computer you can find the following information:
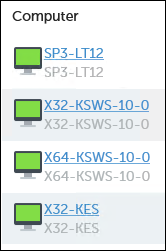
- Computer—Name of the computer. The computer name can be different in ConnectWise Automate and in the Kaspersky Lab solution. The computer name for ConnectWise Automate is displayed above and the name for Kaspersky Security Center / Kaspersky Endpoint Security Cloud is displayed below. When you click the computer name, the Computer Management screen of ConnectWise Automate Control Center is displayed for this computer.
Computer names
- Administration Server / Workspace—The content of this field depends on which Kaspersky Lab solution you use:
- If you use Kaspersky Security Center, this field shows the computer name of the Administration Server that manages the selected computer. The Administration Server computer name can be different in ConnectWise Automate and in Kaspersky Security Center. The Administration Server computer name for ConnectWise Automate is displayed on the first line of the entry and the name for Kaspersky Security Center on the second line. When you click the computer name, the Computer Management screen of ConnectWise Automate Control Center is displayed for this computer.
- If you use Kaspersky Endpoint Security Cloud, this field shows the name of the Kaspersky Endpoint Security Cloud workspace to which the selected computer belongs.
- Status—Current protection status of the managed computer. If the computer is not managed by Kaspersky Security Center or Kaspersky Endpoint Security Cloud, this field is blank.
- Status description—Detailed description of the problems detected on the selected computer, if the computer status differs from OK. If the computer is not managed by Kaspersky Security Center or Kaspersky Endpoint Security Cloud, this field is blank.
- Agent installed—Yes, if Kaspersky Security Center Network Agent is installed on the selected computer; otherwise, No.
- Viruses found—Number of viruses found on the selected computer. If the computer is not managed by Kaspersky Security Center or Kaspersky Endpoint Security Cloud, this field is blank.
- Last scan—Date and time when a scan of the selected computer was last performed. If the computer is not managed by Kaspersky Security Center or Kaspersky Endpoint Security Cloud, this field is blank.
- Database issued—Date and time when anti-virus databases on the selected computer were issued. If the computer is not managed by Kaspersky Security Center or Kaspersky Endpoint Security Cloud, this field is blank.
- Last information update—Date and time when information on a computer was last updated in Kaspersky Security Center or Kaspersky Endpoint Security Cloud. If more than five days passed since the date when information on a computer was last updated, this computer is deleted from the ConnectWise Automate database and is no longer displayed in the computer list.
When you select a computer or a group of computers in the table, its properties are displayed in the Statistics and commands pane on the right side of the screen. You can run a virus scan and anti-virus database update task in the Statistics and commands pane for the selected computer or group.
In addition to the properties in the table, the following computer properties and actions are displayed in the Statistics and commands pane:
- Commands—Click one of the links in this group to scan the computer for viruses or update the anti-virus databases on the computer.
- Client—Name of the ConnectWise Automate client that the computer belongs to.
- Location—Name of the ConnectWise Automate location that the computer belongs to.
You can view which problems on the computers require your attention. For this purpose, select the computers you are interested in. The problems detected on these computers are displayed in the Detected problems field in the Statistics and commands pane, accompanied by the total number of computers selected.
Sorting the list of computers
Sorting the list of computers is useful if you want, for example, to view computers with a specific status or computers with the most time since the last virus scan at the top of the list.
You can sort both filtered and unfiltered list of computers.
To sort the list of computers:
- Click the Computers tab.
- Click the name of the column you want to sort by. You can sort by any column of the list.
The list of computers is sorted by the columns you select.
When you click the column name for the first time, the values are sorted in ascending order. When you click the column name again, the values are sorted in descending order. The arrow next to the column name shows the sort direction.
Filtering computers by management and protection status
Filtering the list of computers by management and protection status is useful if, for example, you want to view only computers that are not managed and then move them into Kaspersky Security Center or Kaspersky Endpoint Security Cloud management or if you want to view only computers that are not protected and then install Kaspersky Anti-Virus on them.
To filter the computers by management and protection status:
- Click the Computers tab.
- Click one of the following links in the Show computers section:
Link
Action
All
Displays all the computers managed by ConnectWise Automate.
Managed
Displays the computers on which Network Agent is installed; these computers are managed by Kaspersky Security Center or Kaspersky Endpoint Security Cloud.
Unmanaged
Displays the computers on which Network Agent is not installed; these computers are not managed by Kaspersky Security Center or Kaspersky Endpoint Security Cloud.
Protected
Displays the managed computers on which Kaspersky Anti-Virus is installed.
Unprotected
Displays the managed computers on which Kaspersky Anti-Virus is not installed.
Only the selected computers are displayed.
- Click Reset filter to display all the computers.
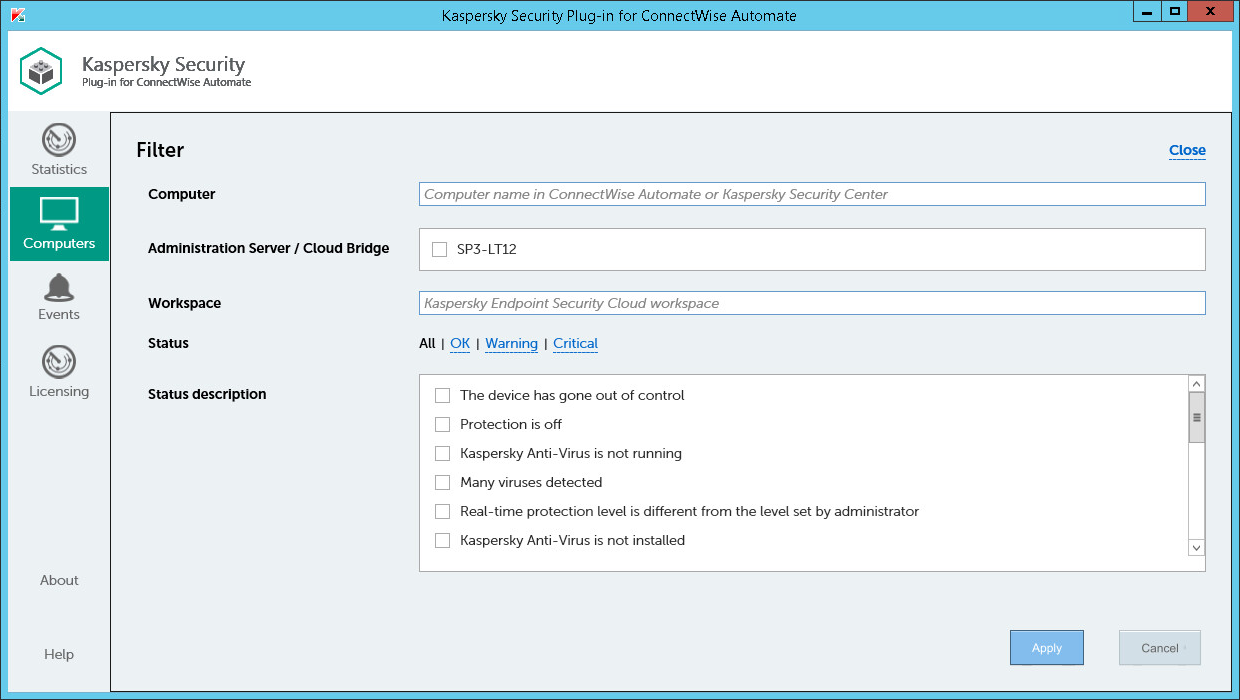
Advanced filter of computers
Advanced filter enables you to filter the list of computers and to search for computers that match specific criteria. For example, you can view only computers with a specific name or part of a name, or with a specific protection status.
Advanced filter for computers
To apply advanced filter to the list of computers:
- Click the Computers tab.
- Click the value within the parentheses next to one of the field names in the Filter by section.
- In the Filter window specify the following criteria:
Field
How to set up a filter
Computer
To filter the list of computers by name, type any part of the computer name in this field; either the ConnectWise Automate computer name or a computer name in Kaspersky Security Center or Kaspersky Endpoint Security Cloud can be used.
Administration Server / Cloud Bridge
To filter the list of computers by Administration Server (if you use Kaspersky Security Center) or by Cloud Bridge (if you use Kaspersky Endpoint Security Cloud), select the check boxes next to the required Administration Servers or Cloud Bridges.
Workspace
To filter the list of computers by workspace (if you use Kaspersky Endpoint Security Cloud), type any part of the workspace name in this field.
Status
To filter the list of computers by protection status, click the required status. Click All to display the computers with all statuses.
Description
To filter the list of computers by protection status description, select one or more of the standard protection status descriptions.
- Click Apply.
Only the selected computers are displayed.
- On the Computers tab, click Reset filter to display all the computers.
Viewing event information
This section describes the Events tab and explains how to use it to view information about events that occur on managed computers.
About the Events tab
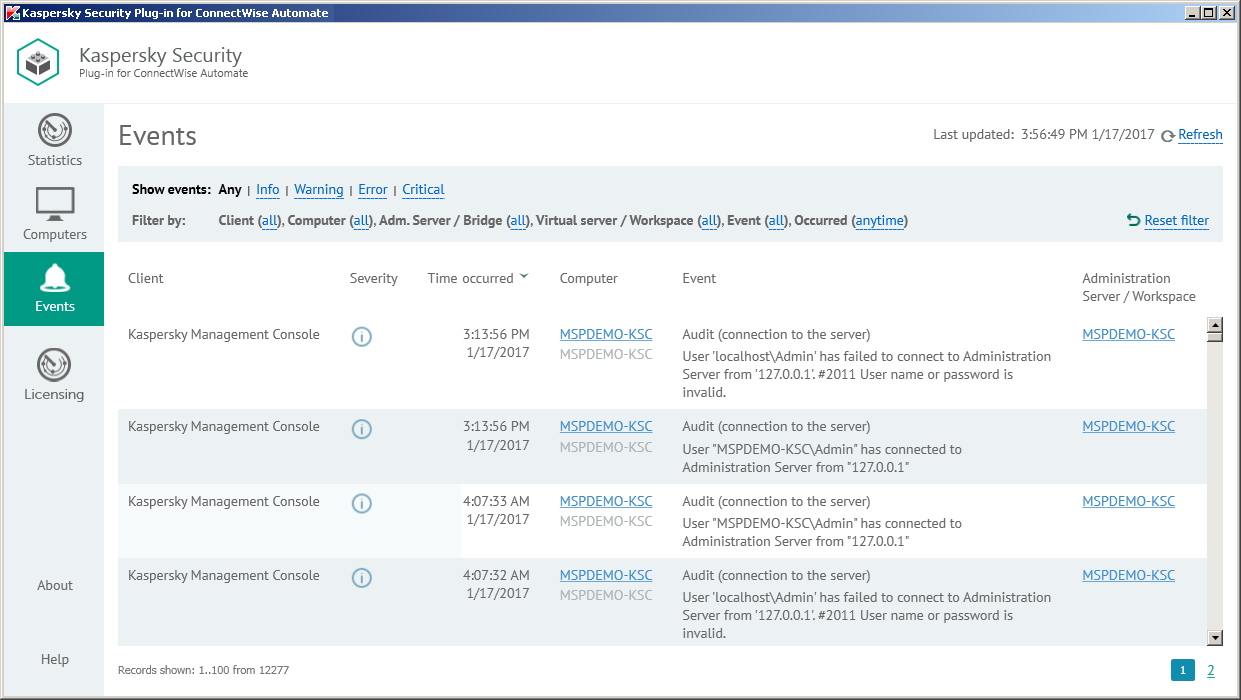
The Events tab displays a list of events that occurred on the managed computers.
Viewing event information
Click the Events tab to view additional information, obtained from the Kaspersky Lab solution, about the security issues detected on a particular computer or group of computers.
In the top pane, you can configure filters to view only the events with selected properties. You can filter events by severity level, client, computer, or time of occurrence. To restrict your event selection and view only those events with selected properties, apply several filters at the same time. Every time you open the Events tab, the previously used filter settings are restored—there is no need to set up filters again.
Information on the events is displayed as a table. You can sort information in the table by any of the table columns by clicking the column header. For each event, you can view the following information:
- Client—Name of a ConnectWise Automate client company. The computer on which the event occurred belongs to this client. This field is applicable if you use Kaspersky Security Center; it is blank if you use Kaspersky Endpoint Security Cloud.
- Severity—Severity level of the event according to Kaspersky Security Center or Kaspersky Endpoint Security Cloud.
- Time occurred—Time when the event occurred.
- Computer—Name of the computer on which the event occurred. The computer name can be different in ConnectWise Automate and in the Kaspersky Lab solution. The computer name for ConnectWise Automate is displayed on the first line of the entry and the name for Kaspersky Security Center / Kaspersky Endpoint Security Cloud on the second line. When you click the computer name, the Computer Management screen of ConnectWise Automate Control Center is displayed for this computer.
- Event—Name and description of the event.
- Administration Server / Workspace—The content of this field depends on the Kaspersky Lab solution you use:
- If you use Kaspersky Security Center, this field shows the computer name of the Administration Server that manages the computer on which the event occurred. The Administration Server computer name can be different in ConnectWise Automate and in Kaspersky Security Center. The Administration Server computer name for ConnectWise Automate is displayed on the first line of the entry and the name for Kaspersky Security Center on the second line. When you click the computer name, the Computer Management screen of ConnectWise Automate Control Center is displayed for this computer.
- If you use Kaspersky Endpoint Security Cloud, this field shows the name of the workspace, to which the computer on which the event occurred belongs.
When you select an event in the table, its properties are displayed in the pane on the right side of the screen. In addition to those in the table, the following event properties are displayed:
- Location—Name of the ConnectWise Automate location. The computer on which the event occurred belongs to this location. This field is displayed if you use Kaspersky Security Center; it is not displayed if you use Kaspersky Endpoint Security Cloud.
- Virtual Server—Name of the Kaspersky Security Center virtual server. The computer on which the event occurred is located on this server. This field is displayed if you use Kaspersky Security Center; it is not displayed if you use Kaspersky Endpoint Security Cloud.
- Kaspersky Security Center group—Name of a Kaspersky Security Center group. The computer on which the event occurred belongs to this group. This field is displayed if you use Kaspersky Security Center; it is not displayed if you use Kaspersky Endpoint Security Cloud.
- Application—Name of the application that the event is related to.
- Version—Version the application that the event is related to.
- Task—Name of the task that the event is related to. This field is displayed if you use Kaspersky Security Center; it is not displayed if you use Kaspersky Endpoint Security Cloud.
Sorting the list of events
Sorting the list of events is useful if, for example, you want to view events that have a specific severity level or that most recently appeared at the top of the list.
You can sort both filtered and unfiltered list of events.
To sort the list of events:
- Click the Events tab.
- Click the name of the column that you want to sort by. You can sort by any column of the list.
The list of events is sorted by the selected columns.
When you click the column name the first time, the values are sorted in ascending order. When you click the column name again, the values are sorted in descending order. The arrow next to the column name shows the sort direction.
Filtering events by severity level
Filtering the list of events by severity level is useful if, for example, you want to view only critical events in order to immediately respond to and solve a problem.
To filter the events by severity level:
- Click the Events tab.
- Click one of the following links in the Show events section:
Link
Action
Any
Displays all the events.
Info
Displays the events with Info severity level.
Warning
Displays the events with Warning severity level.
Error
Displays the events with Error severity level.
Critical
Displays the events with Critical severity level.
Only the events with the selected severity level are displayed.
- Click Reset filter to display all the events.
Advanced filter of events
Advanced filter enables you to filter the list of events and to search for events that match specific criteria. For example, you can view only events that occurred during the last day, or events that occurred on a particular computer, or that occurred at a particular client company.
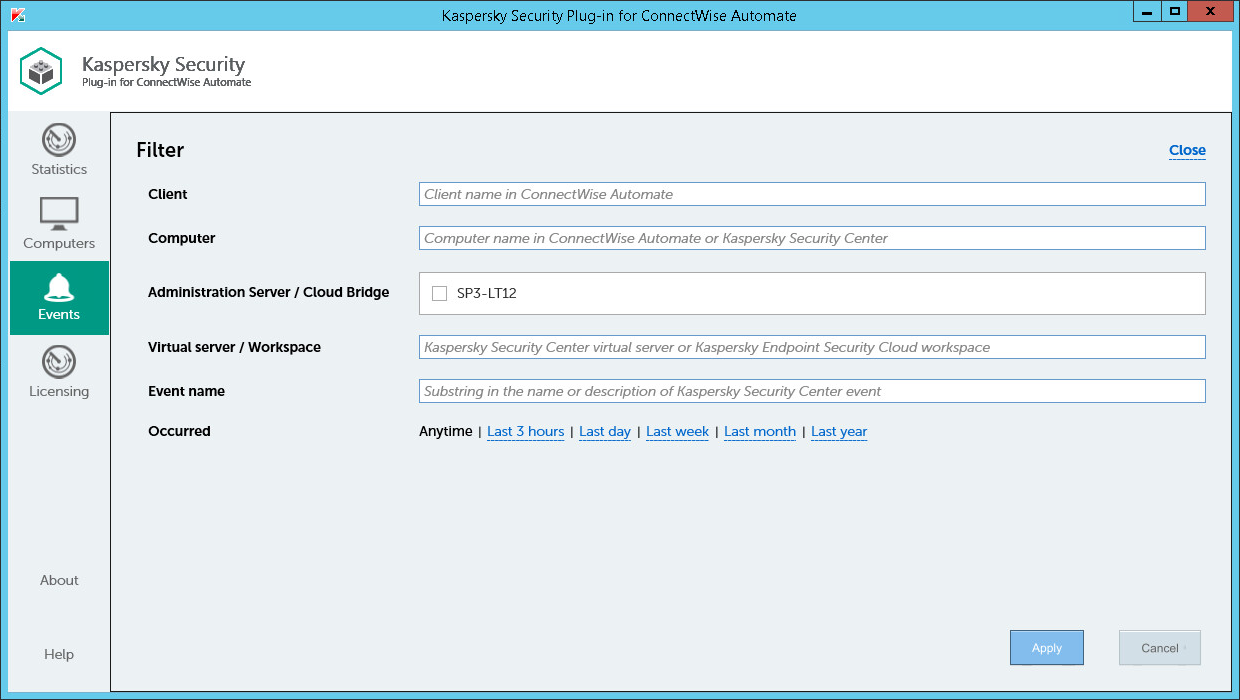
Advanced filter for events
To apply advanced filter to the list of events:
- Click the Events tab.
- Click the value within the parentheses next to one of the field names in the Filter by section.
- In the Filter window specify the following criteria:
Field
How to set up a filter
Client
To filter the list of events by client, type any part of the client name in this field.
Computer
To filter the list of events by computer name, type any part of the computer name in this field; either the ConnectWise Automate computer name or a computer name in Kaspersky Security Center or Kaspersky Endpoint Security Cloud can be used.
Administration Server / Cloud Bridge
To filter the list of events by Administration Server (if you use Kaspersky Security Center), or by Cloud Bridge (if you use Kaspersky Endpoint Security Cloud), select the check boxes next to the required Administration Servers or Cloud Bridges.
Virtual server / Workspace
To filter the list of events by virtual server (if you use Kaspersky Security Center), or the workspace (if you use Kaspersky Endpoint Security Cloud), type any part of the virtual server or workspace name in this field.
Event name
To filter the list of events by name, type any part of the event name or description in this field.
Occurred
To filter the list of events by occurrence time, click one of the occurrence intervals. Click Anytime to display all the events.
- Click Apply.
Only the selected events are displayed.
- On the Events tab, click Reset filter to display all the events.
Viewing licensing information
This section describes the Licenses tab and explains how to use it to view information about keys used on devices integrated with ConnectWise Automate.
About the Licensing tab
The Licensing tab displays information on all the keys used on devices—managed by any Administration Server or connected to any Kaspersky Endpoint Security Cloud workspace—that are integrated with ConnectWise Automate.
Key usage statistics are aggregated and displayed on the chart. The chart helps you to find out which keys are used on the managed computers in your network. The chart also helps you to manage the state of licensing on your network by allowing you to check how many of the keys have exceeded limits or are used over 90%. A key exceeds limits if the number of computers that use the key divided by the number of computers to which the key can be assigned is greater than 1. A key is used over 90% if the number of computers that use the key divided by the number of computers to which the key can be assigned is greater than 0.9.
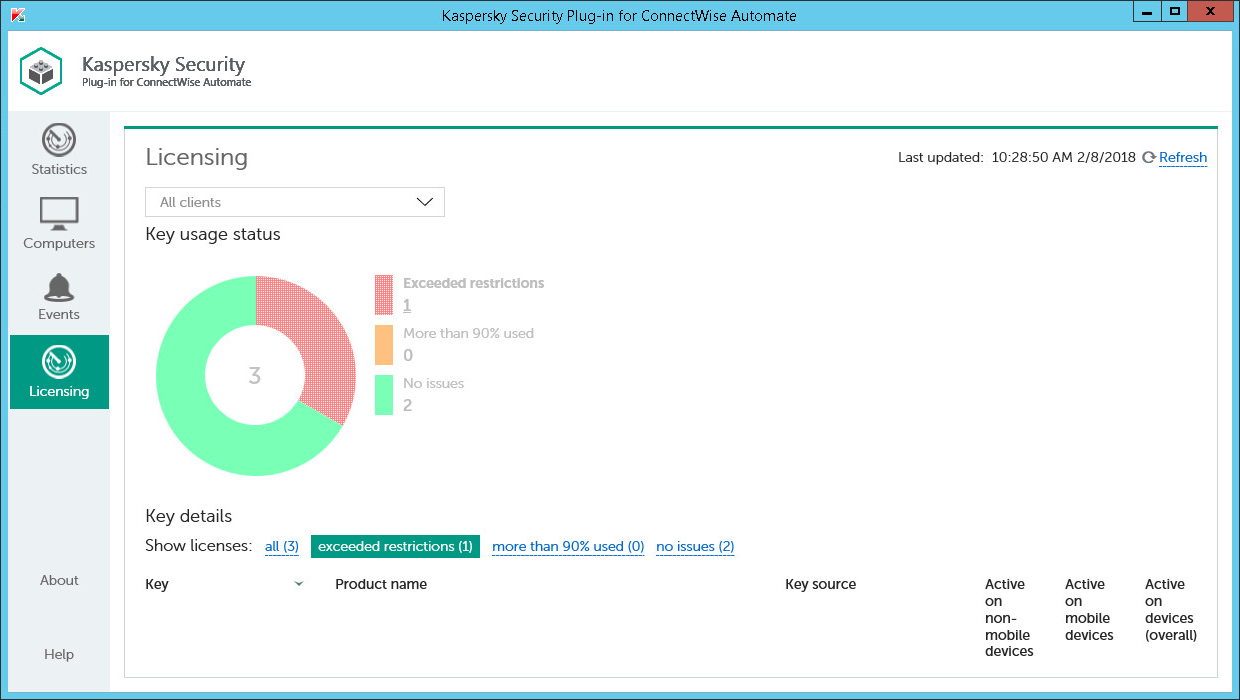
Viewing licensing information
The Key details section displays information, provided by Kaspersky Security Center or Kaspersky Endpoint Security Cloud, about the keys used on the devices in your network, or stored in the main or virtual Administration Server storage or at the workspace. You can use filters to quickly find information about the required keys, for example, those used on devices installed at a specific client company or in a specific location, or keys with a specific status. You can apply several filters at the same time. Every time you open the Licensing tab, the previously used filter settings are restored—there is no need to set up filters again.
Information about the keys is displayed as a table. You can sort information in the table by any of the table columns by clicking the column header. For each key you can find the following information:
- Key—Serial number of the key. Click the key number to view information on the devices, where this key is used as active.
- Product name—Name of the product that uses this key. This column also may show additional information on the key, such as product version and validity period.
- Key source—Source that the key was received from. Kaspersky Security Plug-in for ConnectWise Automate may receive the key from the Administration Server, from a virtual server, or from a Kaspersky Endpoint Security Cloud workspace. If several managed devises use the same key, each of them may receive this key from a different source. This column displays the first few key sources. To view all key sources for the selected key, click the Show details link.
- Active on non-mobile devices—Number of non-mobile devices on which this key is active.
- Active on mobile devices—Number of mobile devices on which this key is active.
- Active on devices (overall)—Total number of devices on which this key is active.
- Expiration date—Date when the key expires.
You can filter information displayed in the charts by client and location.
To filter information displayed,
In the All clients drop-down list, select a client or location to view only licenses that are used on the computers for this particular client or location.
Viewing key details
One key can be used by multiple managed devices. This window shows detailed information on all the devices, where the selected key is active.
- Show only devices managed by ConnectWise Automate—Select this check box to view key usage information only for devices managed by ConnectWise Automate. If this check box is cleared, all the devices that use this key are displayed, including those not managed by ConnectWise Automate.
- Client—Name of the ConnectWise Automate client that the device belongs to.
- Device—Name of the device that uses this key. When you click a device name, the Computer Management screen of ConnectWise Automate Control Center is displayed for the device.
- Application name—Name of the application that uses this key.
- Application version—Version of the application that uses this key.
Sorting the list of keys
Sorting the list of keys is useful if, for example, you want to view the keys for a specific application or keys with the nearest expiration date at the top of the list.
You can sort both filtered and unfiltered list of keys.
To sort the list of keys:
- Click the Licensing tab.
- Click the name of the column you want to sort by. You can sort by any column of the list.
The list of keys is sorted by the columns you select.
When you click a column name for the first time, the values are sorted in ascending order. When you click the column name again, the values are sorted in descending order. The arrow next to the column name shows the sort direction.
Filtering keys by status
Filtering the list of keys by status is useful if, for example, you want to view only keys that have exceeded restrictions in order to respond immediately and solve a problem.
To filter the keys by status:
- Click the Licensing tab.
- Click one of the following links in the Show keys section:
Link
Action
All
Displays all the keys.
Exceeded restrictions
Displays the keys with Exceeded restrictions status.
A key exceeds restrictions if the number of computers that use the key divided by the number of computers to which the key can be assigned is greater than 1.
More than 90% used
Displays the keys with More than 90% used status.
A key is used over 90% if the number of computers that use the key divided by the number of computers to which the key can be assigned is greater than 0.9.
OK
Displays the keys with OK status.
Only keys with the selected status are displayed.
- Click Reset filter to display all the keys.