Contents
- User guide
- KUMA resources
- Operations with resources
- Destinations
- Working with events
- Filtering and searching events
- Selecting Storage
- Generating an SQL query using a builder
- Manually creating an SQL query
- Filtering events by period
- Displaying names instead of IDs
- Presets
- Limiting the complexity of queries in alert investigation mode
- Saving and selecting events filter configuration
- Deleting event filter configurations
- Supported ClickHouse functions
- Viewing event detail areas
- Exporting events
- Configuring the table of events
- Refreshing events table
- Getting events table statistics
- Viewing correlation event details
- Filtering and searching events
- Normalizers
- Aggregation rules
- Enrichment rules
- Correlation rules
- Filters
- Active lists
- Viewing the table of active lists
- Adding active list
- Viewing the settings of an active list
- Changing the settings of an active list
- Duplicating the settings of an active list
- Deleting an active list
- Viewing records in the active list
- Searching for records in the active list
- Adding a record to an active list
- Duplicating records in the active list
- Changing a record in the active list
- Deleting records from the active list
- Import data to an active list
- Exporting data from the active list
- Predefined active lists
- Dictionaries
- Response rules
- Notification templates
- Connectors
- Secrets
- Segmentation rules
- Example of incident investigation with KUMA
- Incident conditions
- Step 1. Preliminary steps
- Step 2. Assigning an alert to a user
- Step 3. Check if the triggered correlation rule matches the data of the alert events
- Step 4. Analyzing alert information
- Step 5. False positive check
- Step 6. Determining alert severity
- Step 7. Incident creation
- Step 8. Investigation
- Step 9. Searching for related assets
- Step 10. Searching for related events
- Step 11. Recording the causes of the incident
- Step 12. Incident response
- Step 13. Restoring assets operability
- Step 14. Closing the incident
- Analytics
- Dashboard
- Reports
- Widgets
- Working with alerts
- Working with incidents
- About the incidents table
- Saving and selecting incident filter configuration
- Deleting incident filter configurations
- Viewing information about an incident
- Incident creation
- Incident processing
- Changing incidents
- Automatic linking of alerts to incidents
- Categories and types of incidents
- Interaction with RuCERT
- Special consideration for successful export from the KUMA hierarchical structure to RuCERT
- Exporting data to RuCERT
- Supplementing incident data on request
- Sending files to RuCERT
- Sending incidents involving personal information leaks to RuCERT
- Communication with RuCERT experts
- Supported categories and types of RuCERT incidents
- Notifications about the incident status change in RuCERT
- Retroscan
- KUMA resources
KUMA resources
Resources are KUMA components that contain parameters for implementing various functions: for example, establishing a connection with a given web address or converting data according to certain rules. Like parts of an erector set, these components are assembled into resource sets for services that are then used as the basis for creating KUMA services.
Resources are contained in the Resources section, Resources block of KUMA web interface. The following resource types are available:
- Correlation rules—resources of this type contain rules for identifying event patterns that indicate threats. If the conditions specified in these resources are met, a correlation event is generated.
- Normalizers—resources of this type contain rules for converting incoming events into the format used by KUMA. After processing in the normalizer, the "raw" event becomes normalized and can be processed by other KUMA resources and services.
- Connectors—resources of this type contain settings for establishing network connections.
- Aggregation rules—resources of this type contain rules for combining several basic events of the same type into one aggregation event.
- Enrichment rules—resources of this type contain rules for supplementing events with information from third-party sources.
- Destinations—resources of this type contain settings for forwarding events to a destination for further processing or storage.
- Filters—resources of this type contain conditions for rejecting or selecting individual events from the stream of events.
- Response rules—resources of this type are used in correlators to, for example, execute scripts or launch Kaspersky Security Center tasks when certain conditions are met.
- Notification templates—resources of this type are used when sending notifications about new alerts.
- Active lists—resources of this type are used by correlators for dynamic data processing when analyzing events according to correlation rules.
- Dictionaries—resources of this type are used to store keys and their values, which may be required by other KUMA resources and services.
- Proxies—resources of this type contain settings for using proxy servers.
- Secrets—resources of this type are used to securely store confidential information (such as credentials) that KUMA needs to interact with external services.
When you click on a resource type, a window opens displaying a table with the available resources of this type. The resource table contains the following columns:
- Name—the name of a resource. Can be used to search for resources and sort them.
- Updated—the date and time of the last update of a resource. Can be used to sort resources.
- Created by—the name of the user who created a resource.
- Description—the description of a resource.
The maximum table size is not limited. If you want to select all resources, scroll to the end of the table and select the Select all check box, which selects all available resources in the table.
Resources can be organized into folders. The folder structure is displayed in the left part of the window: root folders correspond to tenants and contain a list of all resources of the tenant. All other folders nested within the root folder display the resources of an individual folder. When a folder is selected, the resources it contains are displayed as a table in the right pane of the window.
Resources can be created, edited, copied, moved from one folder to another, and deleted. Resources can also be exported and imported.
KUMA comes with a set of predefined resources, which can be identified by the "[OOTB]<resource_name>" name. OOTB resources are protected from editing.
If you want to adapt a predefined OOTB resource to your organization's infrastructure:
- In the Resources-<resource type> section, select the OOTB resource that you want to edit.
- In the upper part of the KUMA web interface, click Duplicate, then click Save.
- A new resource named "[OOTB]<resource_name> - copy" is displayed in the web interface.
- Edit the copy of the predefined resource as necessary and save your changes.
The adapted resource is available for use.
Operations with resources
To manage KUMA resources, you can create, move, copy, edit, delete, import, and export them. These operations are available for all resources, regardless of the resource type.
KUMA resources reside in folders. You can add, rename, move, or delete resource folders.
Creating, renaming, moving, and deleting resource folders
Resources can be organized into folders. The folder structure is displayed in the left part of the window: root folders correspond to tenants and contain a list of all resources of the tenant. All other folders nested within the root folder display the resources of an individual folder. When a folder is selected, the resources it contains are displayed as a table in the right pane of the window.
You can create, rename, move and delete folders.
To create a folder:
- Select the folder in the tree where the new folder is required.
- Click the Add folder button.
The folder will be created.
To rename a folder:
- Locate required folder in the folder structure.
- Hover over the name of the folder.
The
 icon will appear near the name of the folder.
 - Open the drop-down list and select Rename.
The folder name will become active for editing.
- Enter the new folder name and press ENTER.
The folder name cannot be empty.
The folder will be renamed.
To move a folder,
Drag and drop the folder to a required place in folder structure by clicking its name.
Folders cannot be dragged from one tenant to another.
To delete a folder:
- Locate required folder in the folder structure.
- Hover over the name of the folder.
The
icon will appear near the name of the folder. - Open the drop-down list and select Delete.
The conformation window appears.
- Click OK.
The folder will be deleted.
The program does not delete folders that contain files or subfolders.
Page topCreating, duplicating, moving, editing, and deleting resources
You can create, move, copy, edit, and delete resources.
To create the resource:
- In the Resources → <resource type> section, select or create a folder where you want to add the new resource.
Root folders correspond to tenants. For a resource to be available to a specific tenant, it must be created in the folder of that tenant.
- Click the Add <resource type> button.
The window for configuring the selected resource type opens. The available configuration parameters depend on the resource type.
- Enter a unique resource name in the Name field.
- Specify the required parameters (marked with a red asterisk).
- If necessary, specify the optional parameters (not required).
- Click Save.
The resource will be created and available for use in services and other resources.
To move the resource to a new folder:
- In the Resources → <resource type> section, find the required resource in the folder structure.
- Select the check box near the resource you want to move. You can select multiple resources.
The
 icon appears near the selected resources.
 - Use the icon to drag and drop resources to the required folder.
The resources will be moved to the new folders.
You can only move resources to folders of the tenant in which the resources were created. Resources cannot be moved to another tenant's folders.
To copy the resource:
- In the Resources → <resource type> section, find the required resource in the folder structure.
- Select the check box next to the resource that you want to copy and click Duplicate.
A window opens with the settings of the resource that you have selected for copying. The available configuration parameters depend on the resource type.
The
<selected resource name> - copyvalue is displayed in the Name field. - Make the necessary changes to the parameters.
- Enter a unique name in the Name field.
- Click Save.
The copy of the resource will be created.
To edit the resource:
- In the Resources → <resource type> section, find the required resource in the folder structure.
- Select the resource.
A window with the settings of the selected resource opens. The available configuration parameters depend on the resource type.
- Make the necessary changes to the parameters.
- Click Save.
The resource will be updated. If this resource is used in a service, restart the service to apply the new settings.
To delete the resource:
- In the Resources → <resource type> section, find the required resource in the folder structure.
- Select the check box next to the resource that you want to delete and click Delete.
A confirmation window opens.
- Click OK.
The resource will be deleted.
Page topUpdating resources
Kaspersky regularly releases packages with resources that can be imported from the repository. You can specify an email address in the settings of the Repository update task. After the first execution of the task, KUMA starts sending notifications about the packages available for update to the specified address. You can update the repository, analyze the contents of each update, and decide if to import and deploy the new resources in the operating infrastructure. KUMA supports updates from Kaspersky servers and from custom sources, including offline update using the update mirror mechanism. If you have other Kaspersky products in the infrastructure, you can connect KUMA to existing update mirrors. The update subsystem expands KUMA capabilities to respond to the changes in the threat landscape and the infrastructure. The capability to use it without direct Internet access ensures the privacy of the data processed by the system.
To update resources, perform the following steps:
- Update the repository to deliver the resource packages to the repository. The repository update is available in two modes:
- Automatic update
- Manual update
- Import the resource packages from the updated repository into the tenant.
For the service to start using the resources, make sure that the updated resources are mapped after performing the import. If necessary, link the resources to collectors, correlators, or agents, and update the settings.
To enable automatic update:
- In the Settings → Repository update section, configure the Data refresh interval in hours. The default value is 24 hours.
- Specify the Update source. The following options are available:
- .
You can view the list of servers in the Knowledge Base, article 15998.
- Custom source:
- The URL to the shared folder on the HTTP server.
- The full path to the local folder on the host where the KUMA Core is installed.
If a local folder is used, the kuma system user must have read access to this folder and its contents.
- .
- Specify the Emails for notification by clicking the Add button. The notifications that new packages or new versions of the packages imported into the tenant are available in the repository are sent to the specified email addresses.
If you specify the email address of a KUMA user, the Receive email notifications check box must be selected in the user profile. For emails that do not belong to any KUMA user, the messages are received without additional settings. The settings for connecting to the SMTP server must be specified in all cases.
- Click Save. The update task starts shortly. Then the task restarts according to the schedule.

To manually start the repository update:
- To disable automatic updates, in the Settings → Repository update section, select the Disable automatic update check box. This check box is cleared by default. You can also start a manual repository update without disabling automatic update. Starting an update manually does not affect the automatic update schedule.
- Specify the Update source. The following options are available:
- Kaspersky update servers.
- Custom source:
- The URL to the shared folder on the HTTP server.
- The full path to the local folder on the host with the KUMA Core
If a local folder is used, the kuma user must have access to this folder and its contents.
- Specify the Emails for notification by clicking the Add button. The notifications that new packages or new versions of the packages imported into the tenant are available in the repository are sent to the specified email addresses.
If you specify the email address of a KUMA user, the Receive email notifications check box must be selected in the user profile. For emails that do not belong to any KUMA user, the messages are received without additional settings. The settings for connecting to the SMTP server must be specified in all cases.
- Click Run update. Thus, you simultaneously save the settings and manually start the Repository update task.
Configuring a custom source using Kaspersky Update Utility
You can update resources without Internet access by using a custom update source via the Kaspersky Update Utility.
Configuration consists of the following steps:
- Configuring a custom source using Kaspersky Update Utility:
- Installing and configuring Kaspersky Update Utility on one of the computers in the corporate LAN.
- Configuring copying of updates to a shared folder in Kaspersky Update Utility settings.
- Configuring update of the KUMA repository from a custom source.
Configuring a custom source using Kaspersky Update Utility:
You can download the Kaspersky Update Utility distribution kit from the Kaspersky Technical Support website.
- In Kaspersky Update Utility, enable the download of updates for KUMA 2.1:
- Under Applications – Perimeter control, select the check box next to KUMA 2.1 to enable the update capability.
- If you work with Kaspersky Update Utility using the command line, add the following line to the [ComponentSettings] section of the updater.ini configuration file or specify the
truevalue for an existing line:KasperskyUnifiedMonitoringAndAnalysisPlatform_2_1=true
- In the Downloads section, specify the update source. By default, Kaspersky update servers are used as the update source.
- In the Downloads section, in the Update folders group of settings, specify the shared folder for Kaspersky Update Utility to download updates to. The following options are available:
- Specify the local folder on the host where Kaspersky Update Utility is installed. Deploy the HTTP server for distributing updates and publish the local folder on it. In KUMA, in the Settings → Repository update → Custom source section, specify the URL of the local folder published on the HTTP server.
- Specify the local folder on the host where Kaspersky Update Utility is installed. Make this local folder available over the network. Mount the network-accessible local folder on the host where KUMA is installed. In KUMA, in the Settings → Repository update → Custom source section, specify the full path to the local folder.
For detailed information about working with Kaspersky Update Utility, refer to the Kaspersky Knowledge Base.
Page topExporting resources
If shared resources are hidden for a user, the user cannot export shared resources or resources that use shared resources.
To export resources:
- In the Resources section, click Export resources.
The Export resources window opens with the tree of all available resources.
- In the Password field enter the password that must be used to protect exported data.
- In the Tenant drop-down list, select the tenant whose resources you want to export.
- Check boxes near the resources you want to export.
If selected resources are linked to other resources, linked resources will be exported, too.
- Click the Export button.
The resources in a password-protected file are saved on your computer using your browser settings. The Secret resources are exported blank.
Page topImporting resources
To import resources:
- In the Resources section, click Import resources.
The Resource import window opens.
- In the Tenant drop-down list, select the tenant to assign the imported resources to.
- In the Import source drop-down list, select one of the following options:
- File
If you select this option, enter the password and click the Import button.
- Repository
If you select this option, a list of packages available for import is displayed. We recommend starting the import with the "OOTB resources for KUMA 2.1" package and then importing the packages one by one. If you receive a "Database error" error when importing packages, try importing the package mentioned in the error message again, selecting only the specified package for import. You can also configure automatic updates.
You can select one or more packages to import and click the Import button.
The imported resources can only be deleted. To rename, edit or move an imported resource, make a copy of the resource using the Duplicate button and perform the desired actions with the resource copy. When importing future versions of the package, the duplicate is not updated because it is a separate object.
- File
- Resolve the conflicts between the resources imported from the file and the existing resources if they occur. Read more about resource conflicts below.
- If the name, type, and guid of an imported resource fully match the name, type, and guid of an existing resource, the Conflicts window opens with the table displaying the type and the name of the conflicting resources. Resolve displayed conflicts:
- To replace the existing resource with a new one, click Replace.
To replace all conflicting resources, click Replace all.
- To leave the existing resource, click Skip.
To keep all existing resources, click Skip all.
- To replace the existing resource with a new one, click Replace.
- Click the Resolve button.
The resources are imported to KUMA. The Secret resources are imported blank.
- If the name, type, and guid of an imported resource fully match the name, type, and guid of an existing resource, the Conflicts window opens with the table displaying the type and the name of the conflicting resources. Resolve displayed conflicts:
About conflict resolving
When resources are imported into KUMA from a file, they are compared with existing resources; the following parameters are compared:
- Name and kind. If an imported resource's name and kind parameters match those of the existing one, the imported resource's name is automatically changed.
- ID. If identifiers of two resources match, a conflict appears that must be resolved by the user. This could happen when you import resources to the same KUMA server from which they were exported.
When resolving a conflict you can choose either to replace existing resource with the imported one or to keep exiting resource, skipping the imported one.
Some resources are linked: for example, in some types of connectors, the connector secret must be specified. The secrets are also imported if they are linked to a connector. Such linked resources are exported and imported together.
Special considerations of import:
- Resources are imported to the selected tenant.
- Starting with version 2.1.3, if a linked resource is in the Shared tenant, it ends up in the Shared tenant when imported.
- In version 2.1.3 and later, in the Conflicts window, the Parent column always displays the top-most parent resource among those that were selected during import.
- In version 2.1.3 and later, if a conflict occurs during import and you choose to replace existing resource with a new one, it would mean that all the other resources linked to the one being replaced are automatically replaced with the imported resources.
Known bugs in version 2.1.3:
- The linked resource ends up in the tenant specified during the import, and not in the Shared tenant, as indicated in the Conflicts window, under the following conditions:
- The associated resource is initially in the Shared tenant.
- In the Conflicts window, you select Skip for all parent objects of the linked resource from the Shared tenant.
- You leave the linked resource from the Shared tenant for replacement.
- After importing, the categories do not have a tenant specified in the filter under the following conditions:
- The filter contains linked asset categories from different tenants.
- Asset category names are the same.
- You are importing this filter with linked asset categories to a new server.
- In Tenant 1, the name of the asset category is duplicated under the following conditions:
- in Tenant 1, you have a filter with linked asset categories from Tenant 1 and the Shared tenant.
- The names of the linked asset categories are the same.
- You are importing such a filter from Tenant 1 to the Shared tenant.
- You cannot import conflicting resources into the same tenant.
The error "Unable to import conflicting resources into the same tenant" means that the imported package contains conflicting resources from different tenants and cannot be imported into the Shared tenant.
Solution: Select a tenant other than Shared to import the package. In this case, during the import, resources originally located in the Shared tenant are imported into the Shared tenant, and resources from the other tenant are imported into the tenant selected during import.
- Only the general administrator can import categories into the Shared tenant.
The error "Only the general administrator can import categories into the Shared tenant" means that the imported package contains resources with linked shared asset categories. You can see the categories or resources with linked shared asset categories in the KUMA Core log. Path to the Core log:
/opt/kaspersky/kuma/core/log/core
Solution. Choose one of the following options:
- Do not import resources to which shared categories are linked: clear the check boxes next to the relevant resources.
- Perform the import under a General administrator account.
- Only the general administrator can import resources into the Shared tenant.
The error "Only the general administrator can import resources into the Shared tenant" means that the imported package contains resources with linked shared resources. You can see the resources with linked shared resources in the KUMA Core log. Path to the Core log:
/opt/kaspersky/kuma/core/log/core
Solution. Choose one of the following options:
- Do not import resources that have linked resources from the Shared tenant, and the shared resources themselves: clear the check boxes next to the relevant resources.
- Perform the import under a General administrator account.
Destinations
Destinations define network settings for sending normalized events. Collectors and correlators use destinations to describe where to send processed events. Typically, the destination points are the correlator and storage.
The settings of destinations are configured on two tabs: Basic settings and Advanced settings. The available settings depend on the selected type of destination:
- nats-jetstream—used for NATS communications.
- tcp—used for communications over TCP.
- http—used for HTTP communications.
- diode—used to transmit events using a data diode.
- kafka—used for Kafka communications.
- file—used for writing to a file.
- storage—used to transmit data to the storage.
- correlator—used to transmit data to the correlator.
Nats type
The nats-jetstream type is used for NATS communications.
Basic settings tab
Setting |
Description |
|---|---|
Name |
Required setting. Unique name of the resource. Must contain 1 to 128 Unicode characters. |
Tenant |
Required setting. The name of the tenant that owns the resource. |
Disabled switch |
Used when events must not be sent to the destination. By default, sending events is enabled. |
Type |
Required setting. Destination type, nats-jetstream. |
URL |
Required setting. URL that you want to connect to. |
Topic |
Required setting. The topic of NATS messages. Must contain Unicode characters. |
Delimiter |
Specify a character that defines where one event ends and the other begins. By default, |
Authorization |
Type of authorization when connecting to the specified URL Possible values:
|
Description |
Resource description: up to 4,000 Unicode characters. |
Advanced settings tab
Setting |
Description |
|---|---|
Compression |
You can use Snappy compression. By default, compression is disabled. |
Buffer size |
Sets the size of the buffer. The default value is 1 KB, and the maximum value is 64 MB. |
Timeout |
The time (in seconds) to wait for a response from another service or component. The default value is |
Disk buffer size limit |
Size of the disk buffer in bytes. The default value is 10 GB. |
Cluster ID |
ID of the NATS cluster. |
TLS mode |
Use of TLS encryption. Available values:
|
Delimiter |
In the drop-down list, you can select the character to mark the boundary between events. By default, |
Buffer flush interval |
Time (in seconds) between sending batches of data to the destination. The default value is |
Workers |
This field is used to set the number of services processing the queue. By default, this value is equal to the number of vCPUs of the KUMA Core server. |
Debug |
A drop-down list in which you can specify whether resource logging must be enabled. The default value is Disabled. |
Disk buffer disabled |
Drop-down list that lets you enable or disable the disk buffer. By default, the disk buffer is enabled. The disk buffer is used if the collector cannot send normalized events to the destination. The amount of allocated disk space is limited by the value of the Disk buffer size limit setting. If the disk space allocated for the disk buffer is exhausted, events are rotated as follows: new events replace the oldest events written to the buffer. |
Filter |
In the Filter section, you can specify the criteria for identifying events that must be processed by the resource. You can select an existing filter from the drop-down list or create a new filter. Creating a filter in resources
|
Tcp type
The tcp type is used for TCP communications.
Basic settings tab
Setting |
Description |
|---|---|
Name |
Required setting. Unique name of the resource. Must contain 1 to 128 Unicode characters. |
Tenant |
Required setting. The name of the tenant that owns the resource. |
Disabled switch |
Used when events must not be sent to the destination. By default, sending events is enabled. |
Type |
Required setting. Destination type, tcp. |
URL |
Required setting. URL that you want to connect to. Available formats: IPv6 addresses are also supported. When using IPv6 addresses, you must also specify the interface in the For example, |
Description |
Resource description: up to 4,000 Unicode characters. |
Advanced settings tab
Setting |
Description |
|---|---|
Compression |
You can use Snappy compression. By default, compression is disabled. |
Buffer size |
Sets the size of the buffer. The default value is 1 KB, and the maximum value is 64 MB. |
Timeout |
The time (in seconds) to wait for a response from another service or component. The default value is |
Disk buffer size limit |
Size of the disk buffer in bytes. The default value is 10 GB. |
TLS mode |
TLS encryption mode using certificates in pem x509 format. Available values:
When using TLS, it is impossible to specify an IP address as a URL. |
Delimiter |
In the drop-down list, you can select the character to mark the boundary between events. By default, |
Buffer flush interval |
Time (in seconds) between sending batches of data to the destination. The default value is |
Workers |
This field is used to set the number of services processing the queue. By default, this value is equal to the number of vCPUs of the KUMA Core server. |
Debug |
A drop-down list in which you can specify whether resource logging must be enabled. The default value is Disabled. |
Disk buffer disabled |
Drop-down list that lets you enable or disable the disk buffer. By default, the disk buffer is enabled. The disk buffer is used if the collector cannot send normalized events to the destination. The amount of allocated disk space is limited by the value of the Disk buffer size limit setting. If the disk space allocated for the disk buffer is exhausted, events are rotated as follows: new events replace the oldest events written to the buffer. |
Filter |
In this section, you can specify the criteria for identifying events that must be processed by the resource. You can select an existing filter from the drop-down list or create a new filter. Creating a filter in resources
|
Http type
The http type is used for HTTP communications.
Basic settings tab
Setting |
Description |
|---|---|
Name |
Required setting. Unique name of the resource. Must contain 1 to 128 Unicode characters. |
Tenant |
Required setting. The name of the tenant that owns the resource. |
Disabled switch |
Used when events must not be sent to the destination. By default, sending events is enabled. |
Type |
Required setting. Destination type, http. |
URL |
Required setting. URL that you want to connect to. Available formats: IPv6 addresses are also supported, however, when you use them, you must specify the interface as well: |
Authorization |
Type of authorization when connecting to the specified URL Possible values:
|
Description |
Resource description: up to 4,000 Unicode characters. |
Advanced settings tab
Setting |
Description |
|---|---|
Compression |
You can use Snappy compression. By default, compression is disabled. |
Buffer size |
Sets the size of the buffer. The default value is 1 KB, and the maximum value is 64 MB. |
Timeout |
The time (in seconds) to wait for a response from another service or component. The default value is |
Disk buffer size limit |
Size of the disk buffer in bytes. The default value is 10 GB. |
TLS mode |
Use of TLS encryption. Available values:
|
URL selection policy |
From the drop-down list, you can select the method of deciding which URL to send events to if multiple URLs are specified. Available values:
|
Delimiter |
In the drop-down list, you can select the character to mark the boundary between events. By default, \n is used. |
Path |
The path that must be added for the URL request. For example, if you specify the path |
Buffer flush interval |
Time (in seconds) between sending batches of data to the destination. The default value is |
Workers |
The number of services that are processing the queue. By default, this value is equal to the number of vCPUs of the KUMA Core server. |
Health check path |
The URL for sending requests to obtain health information about the system that the destination resource is connecting to. |
Health check timeout |
Frequency of the health check in seconds. |
Health Check Disabled |
Check box that disables the health check. |
Debug |
A drop-down list in which you can specify whether resource logging must be enabled. The default value is Disabled. |
Disk buffer disabled |
Drop-down list that lets you enable or disable the disk buffer. By default, the disk buffer is enabled. The disk buffer is used if the collector cannot send normalized events to the destination. The amount of allocated disk space is limited by the value of the Disk buffer size limit setting. If the disk space allocated for the disk buffer is exhausted, events are rotated as follows: new events replace the oldest events written to the buffer. |
Filter |
In the Filter section, you can specify the criteria for identifying events that must be processed by the resource. You can select an existing filter from the drop-down list or create a new filter. Creating a filter in resources
|
Diode type
The diode type is used to transmit events using a data diode.
Basic settings tab
Setting |
Description |
|---|---|
Name |
Required setting. Unique name of the resource. Must contain 1 to 128 Unicode characters. |
Tenant |
Required setting. The name of the tenant that owns the resource. |
Disabled switch |
Used when events must not be sent to the destination. By default, sending events is enabled. |
Type |
Required setting. Destination type, diode. |
Data diode source directory |
Required setting. The directory from which the data diode moves events. The path can contain up to 255 Unicode characters. |
Temporary directory |
Directory in which events are prepared for transmission to the data diode. Events are collected in a file when a timeout (10 seconds by default) or a buffer overflow occurs. The prepared file is moved to the directory specified in the Data diode source directory field. The checksum (SHA-256) of the file contents is used as the name of the file containing events. The temporary directory must be different from the data diode source directory. |
Description |
Resource description: up to 4,000 Unicode characters. |
Advanced settings tab
Setting |
Description |
|---|---|
Compression |
You can use Snappy compression. By default, compression is disabled. This setting must match for the connector and destination resources used to relay events from an isolated network segment via the data diode. |
Buffer size |
Sets the size of the buffer. The default value is 1 KB, and the maximum value is 64 MB. |
Delimiter |
In the drop-down list, you can select the character to mark the boundary between events. By default, This setting must match for the connector and destination resources used to relay events from an isolated network segment via the data diode. |
Buffer flush interval |
Time (in seconds) between sending batches of data to the destination. The default value is |
Workers |
This field is used to set the number of services processing the queue. By default, this value is equal to the number of vCPUs of the KUMA Core server. |
Debug |
A drop-down list in which you can specify whether resource logging must be enabled. The default value is Disabled. |
Filter |
In the Filter section, you can specify the criteria for identifying events that must be processed by the resource. You can select an existing filter from the drop-down list or create a new filter. Creating a filter in resources
|
Kafka type
The kafka type is used for Kafka communications.
Basic settings tab
Setting |
Description |
|---|---|
Name |
Required setting. Unique name of the resource. Must contain 1 to 128 Unicode characters. |
Tenant |
Required setting. The name of the tenant that owns the resource. |
Disabled switch |
Used when events must not be sent to the destination. By default, sending events is enabled. |
Type |
Required setting. Destination type, kafka. |
URL |
Required setting. URL that you want to connect to. Available formats: You can add multiple addresses using the URL button. |
Topic |
Required setting. Subject of Kafka messages. Must contain from 1 to 255 of the following characters: a–z, A–Z, 0–9, ".", "_", "-". |
Delimiter |
Specify a character that defines where one event ends and the other begins. By default, |
Authorization |
Type of authorization when connecting to the specified URL Possible values:
|
Description |
Resource description: up to 4,000 Unicode characters. |
Advanced settings tab
Setting |
Description |
|---|---|
Buffer size |
Sets the size of the buffer. The default value is 1 KB, and the maximum value is 64 MB. |
Timeout |
The time (in seconds) to wait for a response from another service or component. The default value is |
Disk buffer size limit |
Size of the disk buffer in bytes. The default value is 10 GB. |
TLS mode |
Use of TLS encryption. Available values:
|
Delimiter |
In the drop-down list, you can select the character to mark the boundary between events. By default, |
Buffer flush interval |
Time (in seconds) between sending batches of data to the destination. The default value is |
Workers |
This field is used to set the number of services processing the queue. By default, this value is equal to the number of vCPUs of the KUMA Core server. |
Debug |
A drop-down list in which you can specify whether resource logging must be enabled. The default value is Disabled. |
Disk buffer disabled |
Drop-down list that lets you enable or disable the disk buffer. By default, the disk buffer is enabled. The disk buffer is used if the collector cannot send normalized events to the destination. The amount of allocated disk space is limited by the value of the Disk buffer size limit setting. If the disk space allocated for the disk buffer is exhausted, events are rotated as follows: new events replace the oldest events written to the buffer. |
Filter |
In this section, you can specify the criteria for identifying events that must be processed by the resource. You can select an existing filter from the drop-down list or create a new filter. Creating a filter in resources
|
File type
The file type is used for writing data to a file.
If you delete a destination of the 'file' type used in a service, that service must be restarted.
Basic settings tab
Setting |
Description |
|---|---|
Name |
Required setting. Unique name of the resource. Must contain 1 to 128 Unicode characters. |
Tenant |
Required setting. The name of the tenant that owns the resource. |
Disabled switch |
Used when events must not be sent to the destination. By default, sending events is enabled. |
Type |
Required setting. Destination type, file. |
URL |
Required setting. Path to the file to which the events must be written. |
Description |
Resource description: up to 4,000 Unicode characters. |
Advanced settings tab
Setting |
Description |
|---|---|
Buffer size |
Sets the size of the buffer. The default value is 1 KB, and the maximum value is 64 MB. |
Disk buffer size limit |
Size of the disk buffer in bytes. The default value is 10 GB. |
Delimiter |
In the drop-down list, you can select the character to mark the boundary between events. \n is used by default. |
Buffer flush interval |
Time (in seconds) between sending batches of data to the destination. The default value is |
Number of handlers |
This field is used to set the number of services processing the queue. By default, this value is equal to the number of vCPUs of the KUMA Core server. |
Debug |
A drop-down list in which you can specify whether resource logging must be enabled. The default value is Disabled. |
Disk buffer disabled |
Drop-down list that lets you enable or disable the disk buffer. By default, the disk buffer is enabled. The disk buffer is used if the collector cannot send normalized events to the destination. The amount of allocated disk space is limited by the value of the Disk buffer size limit setting. If the disk space allocated for the disk buffer is exhausted, events are rotated as follows: new events replace the oldest events written to the buffer. |
Filter |
In the Filter section, you can specify the criteria for identifying events that must be processed by the resource. You can select an existing filter from the drop-down list or create a new filter. Creating a filter in resources
|
Storage type
The storage type is used to transmit data to the storage.
Basic settings tab
Setting |
Description |
|---|---|
Name |
Required setting. Unique name of the resource. Must contain 1 to 128 Unicode characters. |
Tenant |
Required setting. The name of the tenant that owns the resource. |
Disabled switch |
Used when events must not be sent to the destination. By default, sending events is enabled. |
Type |
Required setting. Destination type, storage. |
URL |
Required setting. URL that you want to connect to. Available formats: You can add multiple addresses using the URL button. The URL field supports search for services by FQDN, IP address, and name. Search string formats:
|
Description |
Resource description: up to 4,000 Unicode characters. |
Advanced settings tab
Setting |
Description |
|---|---|
Proxy server |
Drop-down list for selecting a proxy server. |
Buffer size |
Sets the size of the buffer. The default value is 1 KB, and the maximum value is 64 MB. |
Timeout |
The time (in seconds) to wait for a response from another service or component. The default value is |
Disk buffer size limit |
Size of the disk buffer in bytes. The default value is 10 GB. |
URL selection policy |
Drop-down list in which you can select a method for determining which URL to send events to if several URLs have been specified:
|
Buffer flush interval |
Time (in seconds) between sending batches of data to the destination. The default value is |
Workers |
This field is used to set the number of services processing the queue. By default, this value is equal to the number of vCPUs of the KUMA Core server. |
Health check timeout |
Frequency of the health check in seconds. |
Debug |
A drop-down list in which you can specify whether resource logging must be enabled. The default value is Disabled. |
Disk buffer disabled |
Drop-down list that lets you enable or disable the disk buffer. By default, the disk buffer is enabled. The disk buffer is used if the collector cannot send normalized events to the destination. The amount of allocated disk space is limited by the value of the Disk buffer size limit setting. If the disk space allocated for the disk buffer is exhausted, events are rotated as follows: new events replace the oldest events written to the buffer. |
Filter |
In this section, you can specify the criteria for identifying events that must be processed by the resource. You can select an existing filter from the drop-down list or create a new filter. Creating a filter in resources
|
Correlator type
The correlator type is used to transmit data to the correlator.
Basic settings tab
Setting |
Description |
|---|---|
Name |
Required setting. Unique name of the resource. Must contain 1 to 128 Unicode characters. |
Tenant |
Required setting. The name of the tenant that owns the resource. |
Disabled switch |
Used when events must not be sent to the destination. By default, sending events is enabled. |
Type |
Required setting. Destination type, correlator. |
URL |
Required setting. URL that you want to connect to. Available formats: You can add multiple addresses using the URL button. The URL field supports search for services by FQDN, IP address, and name. Search string formats:
|
Description |
Resource description: up to 4,000 Unicode characters. |
Advanced settings tab
Setting |
Description |
|---|---|
Proxy server |
Drop-down list for selecting a proxy server. |
Buffer size |
Sets the size of the buffer. The default value is 1 KB, and the maximum value is 64 MB. |
Timeout |
The time (in seconds) to wait for a response from another service or component. The default value is |
Disk buffer size limit |
Size of the disk buffer in bytes. The default value is 10 GB. |
URL selection policy |
Drop-down list in which you can select a method for determining which URL to send events to if several URLs have been specified:
|
Buffer flush interval |
Time (in seconds) between sending batches of data to the destination. The default value is |
Workers |
This field is used to set the number of services processing the queue. By default, this value is equal to the number of vCPUs of the KUMA Core server. |
Health check timeout |
Frequency of the health check in seconds. |
Debug |
A drop-down list in which you can specify whether resource logging must be enabled. The default value is Disabled. |
Disk buffer disabled |
Drop-down list that lets you enable or disable the disk buffer. By default, the disk buffer is enabled. The disk buffer is used if the collector cannot send normalized events to the destination. The amount of allocated disk space is limited by the value of the Disk buffer size limit setting. If the disk space allocated for the disk buffer is exhausted, events are rotated as follows: new events replace the oldest events written to the buffer. |
Filter |
In the Filter section, you can specify the criteria for identifying events that must be processed by the resource. You can select an existing filter from the drop-down list or create a new filter. Creating a filter in resources
|
Predefined destinations
Destinations listed in the table below are included in the KUMA distribution kit.
Predefined destinations
Destination name |
Description |
[OOTB] Correlator |
Sends events to a correlator. |
[OOTB] Storage |
Sends events to storage. |
Working with events
In the Events section of the KUMA web interface, you can inspect events received by the program to investigate security threats or create correlation rules. The events table displays the data received after the SQL query is executed.
Events can be sent to the correlator for a retroscan.
The event date format depends on the localization language selected in the application settings. Possible date format options:
- English localization: YYYY-MM-DD.
- Russian localization: DD.MM.YYYY.
Filtering and searching events
The Events section of the KUMA web interface does not show any data by default. To view events, you need to define an SQL query in the search field and click the  button. The SQL query can be entered manually or it can be generated using a query builder.
Data aggregation and grouping is supported in SQL queries.
You can add filter conditions to an already generated SQL query in the window for viewing statistics, the events table, and the event details area:
- Changing a query from the Statistics window
To change the filtering settings in the Statistics window:
- Open Statistics details area by using one of the following methods:
- In the
 drop-down list in the top right corner of the events table select Statistics.
 - In the events table click any value and in the opened context menu select Statistics.
The Statistics details area appears in the right part of the web interface window.
- In the
- Open the drop-down list of the relevant parameter and hover your mouse cursor over the necessary value.
- Use the plus and minus signs to change the filter settings by doing one of the following:
- If you want the events selection to include only events with the selected value, click the
 icon.
icon. - If you want the events selection to exclude all events with the selected value, click the
 icon.
icon.
- If you want the events selection to include only events with the selected value, click the
As a result, the filter settings and the events table will be updated, and the new search query will be displayed in the upper part of the screen.
- Open Statistics details area by using one of the following methods:
- Changing a query from the events table
- Changing a query from the Event details area
To change the filter settings in the event details area:
- In the Events section of the KUMA web interface, click the relevant event.
The Event details area appears in the right part of the window.
- Change the filter settings by using the plus or minus icons next to the relevant settings:
- If you want the events selection to include only events with the selected value, click the icon.
- If you want the events selection to exclude all events with the selected value, click the icon.
- If you want the events selection to include only events with the selected value, click the
As a result, the filter settings and the events table will be updated, and the new search query will be displayed in the upper part of the screen.
- In the Events section of the KUMA web interface, click the relevant event.
After modifying a query, all query parameters, including the added filter conditions, are transferred to the query builder and the search field.
When you switch to the query builder, the parameters of a query entered manually in the search field are not transferred to the builder, so you will need to create your query again. Also, the query created in the builder does not overwrite the query that was entered into the search string until you click the Apply button in the builder window.
In the SQL query input field, you can enable the display of control characters.
You can also filter events by time period. Search results can be automatically updated.
The filter configuration can be saved. Existing filter configurations can be deleted.
Filter functions are available for users regardless of their roles.
When accessing certain event fields with IDs, KUMA returns the corresponding names.
For more details on SQL, refer to the ClickHouse documentation. See also KUMA operator usage and supported functions.
Selecting Storage
Events that are displayed in the Events section of the KUMA web interface are retrieved from storage (from the ClickHouse cluster). Depending on the demands of your company, you may have more than one Storage. However, you can only receive events from one Storage at a time, so you must specify which one you want to use.
To select the Storage you want to receive events from,
In the Events section of the KUMA web interface, open the  drop-down list and select the relevant storage cluster.
Now events from the selected storage are displayed in the events table. The name of the selected storage is displayed in the drop-down list.
The drop-down list displays only the clusters of tenants available to the user, and the cluster of the main tenant.
Generating an SQL query using a builder
In KUMA, you can use a query builder to generate an SQL query for filtering events.
To generate an SQL query using a builder:
- In the Events section of the KUMA web interface, click the
 button.
The filter constructor window opens.
- Generate a search query by providing data in the following parameter blocks:
SELECT—event fields that should be returned. The * value is selected by default, which means that all available event fields must be returned. To make viewing the search results easier, select the necessary fields in the drop-down list. In this case, the data only for the selected fields is displayed in the table. Note that Select * increases the duration of the request execution, but eliminates the need to manually indicate the fields in the request.
When selecting an event field, you can use the field on the right of the drop-down list to specify an alias for the column of displayed data, and you can use the right-most drop-down list to select the operation to perform on the data: count, max, min, avg, sum.
If you are using aggregation functions in a query, you cannot customize the events table display, sort events in ascending or descending order, or receive statistics.
When filtering by alert-related events in alert investigation mode, you cannot perform operations on the data of event fields or assign names to the columns of displayed data.
- FROM—data source. Select the events value.
- WHERE—conditions for filtering events.
Conditions and groups of conditions can be added by using the Add condition and Add group buttons. The AND operator value is selected by default in a group of conditions, but the operator can be changed by clicking on this value. Available values: AND, OR, NOT. The structure of conditions and condition groups can be changed by using the
icon to drag and drop expressions.Adding filter conditions:
- In the drop-down list on the left, select the event field that you want to use for filtering.
- Select the necessary operator from the middle drop-down list. The available operators depend on the type of value of the selected event field.
- Enter the value of the condition. Depending on the selected type of field, you may have to manually enter the value, select it from the drop-down list, or select it on the calendar.
Filter conditions can be deleted by using the
 button. Group conditions are deleted using the Delete group button.
 - GROUP BY—event fields or aliases to be used for grouping the returned data.
If you are using data grouping in a query, you cannot customize the events table display, sort events in ascending or descending order, receive statistics, or perform a retroscan.
When filtering by alert-related events in alert investigation mode, you cannot group the returned data.
- ORDER BY—columns used as the basis for sorting the returned data. In the drop-down list on the right, you can select the necessary order: DESC—descending, ASC—ascending.
- LIMIT—number of strings displayed in the table.
The default value is 250.
If you are filtering events by user-defined period and the number of strings in the search results exceeds the defined value, you can click the Show next records button to display additional strings in the table. This button is not displayed when filtering events by the standard period.
- Click Apply.
The current SQL query will be overwritten. The generated SQL query is displayed in the search field.
If you want to reset the builder settings, click the Default query button.
If you want to close the builder without overwriting the existing query, click the
button. - Click the button to display the data in the table.
The table will display the search results based on the generated SQL query.
When switching to another section of the web interface, the query generated in the builder is not preserved. If you return to the Events section from another section, the builder will display the default query.
For more details on SQL, refer to the ClickHouse documentation. See also KUMA operator usage and supported functions.
Manually creating an SQL query
You can use the search string to manually create SQL queries of any complexity for filtering events.
To manually generate an SQL query:
- Go to the Events section of the KUMA web interface.
An input form opens.
- Enter your SQL query into the input field.
- Click the button.
You will see a table of events that satisfy the criteria of your query. If necessary, you can filter events by period.
Supported functions and operators
SELECT—event fields that should be returned.For
SELECTfields, the program supports the following functions and operators:- Aggregation functions:
count, avg, max, min, sum. - Arithmetic operators:
+, -, *, /, <, >, =, !=, >=, <=.You can combine these functions and operators.
If you are using aggregation functions in a query, you cannot customize the events table display, sort events in ascending or descending order, or receive statistics.
- Aggregation functions:
DISTINCT–removes duplicates from the result of a SELECT statement. You must use the following notation: SELECT DISTINCT SourceAddress as Addresses FROM <rest of the query>.FROM—data source.When creating a query, you need to specify the events value as the data source.
WHERE—conditions for filtering events.AND, OR, NOT, =, !=, >, >=, <, <=INBETWEENLIKEILIKEinSubnetmatch(the re2 syntax of regular expressions is used in queries, special characters must be shielded with "\")
GROUP BY—event fields or aliases to be used for grouping the returned data.If you are using data grouping in a query, you cannot customize the events table display, sort events in ascending or descending order, receive statistics, or perform a retroscan.
ORDER BY—columns used as the basis for sorting the returned data.Possible values:
DESC—descending order.ASC—ascending order.
OFFSET—skip the indicated number of lines before printing the query results output.LIMIT—number of strings displayed in the table.The default value is 250.
If you are filtering events by user-defined period and the number of strings in the search results exceeds the defined value, you can click the Show next records button to display additional strings in the table. This button is not displayed when filtering events by the standard period.
Example queries:
SELECT * FROM `events` WHERE Type IN ('Base', 'Audit') ORDER BY Timestamp DESC LIMIT 250In the events table, all events with the Base and Audit type are sorted by the Timestamp column in descending order. The number of strings that can be displayed in the table is 250.
SELECT * FROM `events` WHERE BytesIn BETWEEN 1000 AND 2000 ORDER BY Timestamp ASC LIMIT 250All events of the events table for which the BytesIn field contains a value of received traffic in the range from 1,000 to 2,000 bytes are sorted by the Timestamp column in ascending order. The number of strings that can be displayed in the table is 250.
SELECT * FROM `events` WHERE Message LIKE '%ssh:%' ORDER BY Timestamp DESC LIMIT 250In the events table, all events whose Message field contains data corresponding to the defined
%ssh:%template in lowercase are sorted by the Timestamp column in descending order. The number of strings that can be displayed in the table is 250.SELECT * FROM `events` WHERE inSubnet(DeviceAddress, '00.0.0.0/00') ORDER BY Timestamp DESC LIMIT 250In the events table, all events for the hosts that are in the 00.0.0.0/00 subnet are sorted by the Timestamp column in descending order. The number of strings that can be displayed in the table is 250.
SELECT * FROM `events` WHERE match(Message, 'ssh.*') ORDER BY Timestamp DESC LIMIT 250In the events table, all events whose Message field contains text corresponding to the
ssh.*template are sorted by the Timestamp column in descending order. The number of strings that can be displayed in the table is 250.SELECT max(BytesOut) / 1024 FROM `events`Maximum amount of outbound traffic (KB) for the selected time period.
SELECT count(ID) AS "Count", SourcePort AS "Port" FROM `events` GROUP BY SourcePort ORDER BY Port ASC LIMIT 250Number of events and port number. Events are grouped by port number and sorted by the Port column in ascending order. The number of strings that can be displayed in the table is 250.
The ID column in the events table is named Count, and the SourcePort column is named Port.
If you want to use a special character in a query, you need to escape this character by placing a backslash (\) character in front of it.
Example:
In the events table, all events whose Message field contains text corresponding to the |
When creating a normalizer for events, you can choose whether to retain the field values of the raw event. The data is stored in the Extra event field. This field is searched for events by using the LIKE operator.
Example:
In the events table, all events for hosts with the IP address 00.00.00.000 where the example process is running are sorted by the Timestamp column in descending order. The number of strings that can be displayed in the table is 250. |
When switching to the query builder, the query parameters that were manually entered into the search string are not transferred to the builder so you will need to create your query again. Also, the query created in the builder does not overwrite the query that was entered into the search string until you click the Apply button in the builder window.
Aliases must not contain spaces.
For more details on SQL, refer to the ClickHouse documentation. See also the supported ClickHouse functions.
Filtering events by period
In KUMA, you can specify the time period to display events from.
To filter events by period:
- In the Events section of the KUMA web interface, open the Period drop-down list in the upper part of the window.
- If you want to filter events based on a standard period, select one of the following:
- 5 minutes
- 15 minutes
- 1 hour
- 24 hours
- In period
If you select this option, use the opened calendar to select the start and end dates of the period and click Apply Filter. The date and time format depends on your operating system's settings. You can also manually change the date values if necessary.
- Click the button.
When the period filter is set, only events registered during the specified time interval will be displayed. The period will be displayed in the upper part of the window.
You can also configure the display of events by using the events histogram that is displayed when you click the  button in the upper part of the Events section. Events are displayed if you click the relevant data series or select the relevant time period and click the Show events button.
Displaying names instead of IDs
When accessing certain event fields with IDs, KUMA returns the corresponding names rather than IDs. This helps make the information more readable. For example, if you access the TenantID event field (which stores the tenant ID), you get the value of the TenantName event field (which stores the tenant name).
When exporting events, values of both fields are written to the file, the ID as well as the name.
The table below lists the fields that are substituted when accessed:
Requested field |
Returned field |
|
|
|
|
|
|
|
|
|
|
|
|
|
|
Substitution does not occur if an alias is assigned to the field in the SQL query. Examples:
SELECT TenantID FROM `events` LIMIT 250— in the search result, the name of the tenant is displayed in the TenantID field.SELECT TenantID AS Tenant_name FROM `events` LIMIT 250— in the search result, the tenant ID will be displayed in the Tenant_name field.
Presets
You can use
to simplify work with queries if you regularly view data for a specific set of event fields. In the line with the SQL query, you can typeSelect * and select a saved preset; in that case, the output is limited only to the fields specified in the preset. This method slows down performance but eliminates the need to write a query manually every time. Presets are saved on the KUMA Core server and are available to all KUMA users of the specified tenant.
To create a preset:
- In the Events section, click the
 icon.
icon. - In the window that opens, on the Event field columns tab, select the required fields.
To simplify your search, you can start typing the field name in the Search area.
- To save the selected fields, click Save current preset.
The New preset window opens.
- In the window that opens, specify the Name of the preset, and in the drop-down list, select the Tenant.
- Click Save.
The preset is created and saved.
To apply a preset:
- In the query entry field, enter Select *.
- In the Events section of the KUMA web interface, click the
 icon.
icon. - In the opened window, use the Presets tab to select the relevant preset and click the
 button.
The fields from the selected preset are added to the SQL query field, and the columns are added to the table. No changes are made in Builder.
- Click to execute the query.
After the query execution completes, the columns are filled in.
Limiting the complexity of queries in alert investigation mode
When investigating an alert, the complexity of SQL queries for event filtering is limited if the Related to alert option is selected in the  drop-down list. If this is the case, only the functions and operators listed below are available for event filtering.
If the All events option is selected from the drop-down list, these limitations are not applied.
SELECT- The
*character is used as a wildcard to represent any number of characters.
- The
WHEREAND,OR,NOT,=,!=,>,>=,<,<=INBETWEENLIKEinSubnet
Examples:
WHERE Type IN ('Base', 'Correlated')WHERE BytesIn BETWEEN 1000 AND 2000WHERE Message LIKE '%ssh:%'WHERE inSubnet(DeviceAddress, '10.0.0.1/24')
ORDER BYSorting can be done by column.
OFFSETSkip the indicated number of lines before printing the query results output.
LIMITThe default value is 250.
If you are filtering events by user-defined period and the number of strings in the search results exceeds the defined value, you can click the Show next records button to display additional strings in the table. This button is not displayed when filtering events by the standard period.
When filtering by alert-related events in alert investigation mode, you cannot group the returned data. When filtering by alert-related events in alert investigation mode, you cannot perform operations on the data of event fields or assign names to the columns of displayed data.
Page topSaving and selecting events filter configuration
In KUMA, you can save a filter configuration and use it in the future. Other users can also use the saved filters if they have the appropriate access rights. When saving a filter, you are saving the configured settings of all the active filters at the same time, including the time-based filter, query builder, and the events table settings. Search queries are saved on the KUMA Core server and are available to all KUMA users of the selected tenant.
To save the current settings of the filter, query, and period:
- In the Events section of the KUMA web interface, click the
 icon next to the filter expression and select Save current filter.
 - In the window that opens, enter the name of the filter configuration in the Name field. The name can contain up to 128 Unicode characters.
- In the Tenant drop-down list, select the tenant that will own the created filter.
- Click Save.
The filter configuration is now saved.
To select a previously saved filter configuration:
In the Events section of the KUMA web interface, click the icon next to the filter expression and select the relevant filter.
The selected configuration is active, which means that the search field is displaying the search query, and the upper part of the window is showing the configured settings for the period and frequency of updating the search results. Click the button to submit the search query.
You can click the  icon near the filter configuration name to make it a default filter.
Deleting event filter configurations
To delete a previously saved filter configuration:
- In the Events section of the KUMA web interface, click the icon next to the filter search query and click the
 icon next to the configuration that you need to delete.
 - Click OK.
The filter configuration is now deleted for all KUMA users.
Page topSupported ClickHouse functions
The following ClickHouse functions are supported in KUMA:
- Arithmetic functions.
- Arrays—all functions except:
- has
- range
- functions in which higher-order functions must be used (lambda expressions (->))
- Comparison functions: all operators except == and less.
- Logical functions: "not" function only.
- Type conversion functions.
- Date/time functions: all except date_add and date_sub.
- String functions.
- String search functions—all functions except:
- position
- multiSearchAllPositions, multiSearchAllPositionsUTF8, multiSearchFirstPosition, multiSearchFirstIndex, multiSearchAny
- like and ilike
- Conditional functions: simple if operator only (ternary if and miltif operators are not supported).
- Mathematical functions.
- Rounding functions.
- Functions for splitting and merging strings and arrays.
- Bit functions.
- Functions for working with UUIDs.
- Functions for working with URLs.
- Functions for working with IP addresses.
- Functions for working with Nullable arguments.
- Functions for working with geographic coordinates.
In KUMA 2.1.3, errors with the operation of the DISTINCT operator have been fixed. In this case, you must use the following notation: SELECT DISTINCT SourceAddress as Addresses FROM <rest of the query>.
In KUMA 2.1.1, the SELECT DISTINCT SourceAddress / SELECT DISTINCT(SourceAddress) / SELECT DISTINCT ON (SourceAddress) operators work incorrectly.
Search and replace functions in strings, and functions from other sections are not supported.
For more details on SQL, refer to the ClickHouse documentation.
Page topViewing event detail areas
To view information about an event:
- In the program web interface window, select the Events section.
- Search for events by using the query builder or by entering a query in the search field.
The event table is displayed.
- Select the event whose information you want to view.
The event details window opens.
The Event details area appears in the right part of the web interface window and contains a list of the event's parameters with values. In this area you can:
- Include the selected field in the search or exclude it from the search by clicking or next to the setting value.
- Clicking a file hash in the FileHash field opens a list in which you can select one of the following actions:
- Show info from Threat Lookup.
This is available when integrated with Kaspersky Threat Intelligence Portal.
- Add to Internal TI of CyberTrace.
- This is available when integrated with Kaspersky CyberTrace.
- Show info from Threat Lookup.
- Open a window containing information about the asset if it is mentioned in the event fields and registered in the program.
- You can click the link containing the collector name in the Service field to view the settings of the service that registered the event.
You can also link an event to an alert if the program is in alert investigation mode and open the Correlation event details window if the selected event is a correlation event.
In the Event details area, the name of the described object is shown instead of its ID in the values of the following settings. At the same time, if you change the filtering of events by this setting (for example, by clicking ) to exclude events with a certain setting-value combination from search results), the object's ID, and not its name, is added to the SQL query:
- TenantID
- SeriviceID
- DeviceAssetID
- SourceAssetID
- DestinationAssetID
- SourceAccountID
- DestinationAccountID
Exporting events
In KUMA, you can export information about events to a TSV file. The selection of events that will be exported to a TSV file depends on filter settings. The information is exported from the columns that are currently displayed in the events table. The columns in the exported file are populated with the available data even if they did not display in the events table in the KUMA web interface due to the special features of the SQL query.
To export information about events:
- In the Events section of the KUMA web interface, open the drop-down list and choose Export TSV.
The new export TSV file task is created in the Task manager section.
- Find the task you created in the Task manager section.
When the file is ready to download, the
 icon will appear in the Status column of the task.
 - Click the task type name and select Upload from the drop-down list.
The TSV file will be downloaded using your browser's settings. By default, the file name is event-export-<date>_<time>.tsv.
The file is saved based on your web browser's settings.
Page topConfiguring the table of events
Responses to user SQL queries are presented as a table in the Events section. The fields selected in the custom query appear at the end of the table, after the default columns. This table can be updated.
The following columns are displayed in the events table by default:
- Tenant.
- Timestamp.
- Name.
- DeviceProduct.
- DeviceVendor.
- DestinationAddress.
- DestinationUserName.
In KUMA, you can customize the displayed set of event fields and their display order. The selected configuration can be saved.
When using SQL queries with data grouping and aggregation for filtering events, statistics are not available and the order of displayed columns depends on the specific SQL query.
In the events table, in the event details area, in the alert window, and in the widgets, the names of assets, accounts, and services are displayed instead of the IDs as the values of the SourceAssetID, DestinationAssetID, DeviceAssetID, SourceAccountID, DestinationAccountID, and ServiceID fields. When exporting events to a file, the IDs are saved, but columns with names are added to the file. The IDs are also displayed when you point the mouse over the names of assets, accounts, or services.
Searching for fields with IDs is only possible using IDs.
To configure the fields displayed in the events table:
- Click the
 icon in the top right corner of the events table.
You will see a window for selecting the event fields that should be displayed in the events table.
- Select the check boxes opposite the fields that you want to view in the table. You can search for relevant fields by using the Search field.
You can configure the table to display any event field from the KUMA event data model. The Timestamp and Name parameters are always displayed in the table. Click the Default button to display only default event parameters in the events table.
When you select a check box, the events table is updated and a new column is added. When a check box is cleared, the column disappears.
You can also remove columns from the events table by clicking the column title and selecting Hide column from the drop-down list.
- If necessary, change the display order of the columns by dragging the column headers in the event tables.
- If you want to sort the events by a specific column, click its title and in the drop-down list select one of the available options: Ascending or Descending.
The selected event fields will be displayed as columns in the table of the Events section in the order you specified.
Page topRefreshing events table
You can update the displayed event selection with the most recent entries by refreshing the web browser page. You can also refresh the events table automatically and set the frequency of updates. Automatic refresh is disabled by default.
To enable automatic refresh,
select the update frequency in the  drop-down list:
- 5 seconds
- 15 seconds
- 30 seconds
- 1 minute
- 5 minutes
- 15 minutes
The events table now refreshes automatically.
To disable automatic refresh:
Select No refresh in the drop-down list:
Getting events table statistics
You can get statistics for the current events selection displayed in the events table. The selected events depend on the filter settings.
To obtain statistics:
Select Statistics from the drop-down list in the upper-right corner of the events table, or click on any value in the events table and select Statistics from the opened context menu.
The Statistics details area appears with the list of parameters from the current event selection. The numbers near each parameter indicate the number of events with that parameter in the selection. If a parameter is expanded, you can also see its five most frequently occurring values. Relevant parameters can be found by using the Search field.
In a fault-tolerant configuration, for all event fields that contain the FQDN of the Core, the Statistics section displays "core" instead of the FQDN.
The Statistics window allows you to modify the events filter.
When using SQL queries with data grouping and aggregation for filtering events, statistics are not available.
Page topViewing correlation event details
You can view the details of a correlation event in the Correlation event details window.
To view information about a correlation event:
- In the Events section of the KUMA web interface, click a correlation event.
You can use filters to find correlation events by assigning the
correlatedvalue to theTypeparameter.The details area of the selected event will open. If the selected event is a correlation event, the Detailed view button will be displayed at the bottom of the details area.
- Click the Detailed view button.
The correlation event window will open. The event name is displayed in the upper left corner of the window.
The Correlation event details section of the correlation event window contains the following data:
- Correlation event severity—the importance of the correlation event.
- Correlation rule—the name of the correlation rule that triggered the creation of this correlation event. The rule name is represented as a link that can be used to open the settings of this correlation rule.
- Correlation rule severity—the importance of the correlation rule that triggered the correlation event.
- Correlation rule ID—the identifier of the correlation rule that triggered the creation of this correlation event.
- Tenant—the name of the tenant that owns the correlation event.
The Related events section of the correlation event window contains the table of events related to the correlation event. These are base events that actually triggered the creation of the correlation event. When an event is selected, the details area opens in the right part of the web interface window.
The Find in events link to the right of the section header is used for alert investigation.
The Related endpoints section of the correlation event window contains the table of hosts related to the correlation event. This information comes from the base events related to the correlation event. Clicking the name of the asset opens the Asset details window.
The Related users section of the correlation event window contains the table of users related to the correlation event. This information comes from the base events related to the correlation event.
Normalizers
Normalizers are used for converting raw events that come from various sources in different formats to the KUMA event data model. Normalized events become available for processing by other KUMA resources and services.
A normalizer consists of the main event parsing rule and optional additional event parsing rules. By creating a main parsing rule and a set of additional parsing rules, you can implement complex event processing logic. Data is passed along the tree of parsing rules depending on the conditions specified in the
Extra normalization conditions setting. The sequence in which parsing rules are created is significant: the event is processed sequentially and the processing sequence is indicated by arrows.
A normalizer is created in several steps:
- Preparing to create a normalizer
A normalizer can be created in the KUMA web interface:
- In the Resources → Normalizers section.
- When creating a collector, at the Event parsing step.
Then parsing rules must be created in the normalizer.
- Creating the main parsing rule for an event
The main parsing rule is created using the Add event parsing button. This opens the Event parsing window, where you can specify the settings of the main parsing rule:
- Specify event parsing settings.
- Specify event enrichment settings.
The main parsing rule for an event is displayed in the normalizer as a dark circle. You can view or modify the settings of the main parsing rule by clicking this circle. When you hover the mouse over the circle, a plus sign is displayed. Click it to add the parsing rules.
The name of the main parsing rule is used in KUMA as the normalizer name.
- Creating additional event parsing rules
Clicking the plus icon that is displayed when you hover the mouse over the circle or the block corresponding to the normalizer opens the Additional event parsing window where you can specify the settings of the additional parsing rule:
- Specify the conditions for sending data to the new normalizer.
- Specify event parsing settings.
- Specify event enrichment settings.
The additional event parsing rule is displayed in the normalizer as a dark block. The block displays the triggering conditions for the additional parsing rule, the name of the additional parsing rule, and the event field. When this event field is available, the data is passed to the normalizer. Click the block of the additional parsing rule to view or modify its settings.
If you hover the mouse over the additional normalizer, a plus button appears. You can use this button to create a new additional event parsing rule. To delete a normalizer, use the button with the trash icon.
- Completing the creation of the normalizer
To finish the creation of the normalizer, click Save.
In the upper right corner, in the search field, you can search for additional parsing rules by name.
For normalizer resources, you can enable the display of control characters in all input fields except the Description field.
If, when changing the settings of a collector resource set, you change or delete conversions in a normalizer connected to it, the edits will not be saved, and the normalizer itself may be corrupted. If you need to modify conversions in a normalizer that is already part of a service, the changes must be made directly to the normalizer under Resources → Normalizers in the web interface.
Event parsing settings
You can configure the rules for converting incoming events to the KUMA format when creating event parsing rules in the normalizer settings window, on the Normalization scheme tab.
Available settings:
- Name (required)—name of the parsing rules. Must contain 1 to 128 Unicode characters. The name of the main parsing rule is used as the name of the normalizer.
- Tenant (required)—name of the tenant that owns the resource.
This setting is not available for extra parsing rules.
- Parsing method (required)—drop-down list for selecting the type of incoming events. Depending on your choice, you can use the preconfigured rules for matching event fields or set your own rules. When you select some parsing methods, additional parameter fields required for filling in may become available.
Available parsing methods:
- json
- cef
- regexp
This parsing method is used to create custom rules for processing data in a format using regular expressions.
In the Normalization parameter block field, add a regular expression (RE2 syntax) with named capture groups. The name of a group and its value will be interpreted as the field and the value of the raw event, which can be converted into an event field in KUMA format.
To add event handling rules:
- Copy an example of the data you want to process to the Event examples field. This is an optional but recommended step.
- In the Normalization parameter block field add a regular expression with named capture groups in RE2 syntax, for example "(?P<name>regexp)". The regular expression added to the Normalization parameter must exactly match the event. Also, when developing the regular expression, it is recommended to use special characters that match the starting and ending positions of the text: ^, $.
You can add multiple regular expressions by using the Add regular expression button. If you need to remove the regular expression, use the
button. - Click the Copy field names to the mapping table button.
Capture group names are displayed in the KUMA field column of the Mapping table. Now you can select the corresponding KUMA field in the column next to each capture group. Otherwise, if you named the capture groups in accordance with the CEF format, you can use the automatic CEF mapping by selecting the Use CEF syntax for normalization check box.
Event handling rules were added.
- syslog
- csv
- kv
- xml
This parsing method is used to process XML data in which each object, including its nested objects, occupies a single line in a file. Files are processed line by line.
When this method is selected in the parameter block XML attributes you can specify the key attributes to be extracted from tags. If an XML structure has several attributes with different values in the same tag, you can indicate the necessary value by specifying its key in the Source column of the Mapping table.
To add key XML attributes,
Click the Add field button, and in the window that appears, specify the path to the required attribute.
You can add more than one attribute. Attributes can be removed one at a time using the cross icon or all at once using the Reset button.
If XML key attributes are not specified, then in the course of field mapping the unique path to the XML value will be represented by a sequence of tags.
Tag numbering
Tag numbering is available as of KUMA 2.1.3. This functionality allows automatically numbering tags in XML events, which lets you parse an event with identical tags or unnamed tags, such as <Data>.
As an example, we will use the Tag numbering functionality to number the tags of the EventData attribute of Microsoft Windows PowerShell event ID 800.
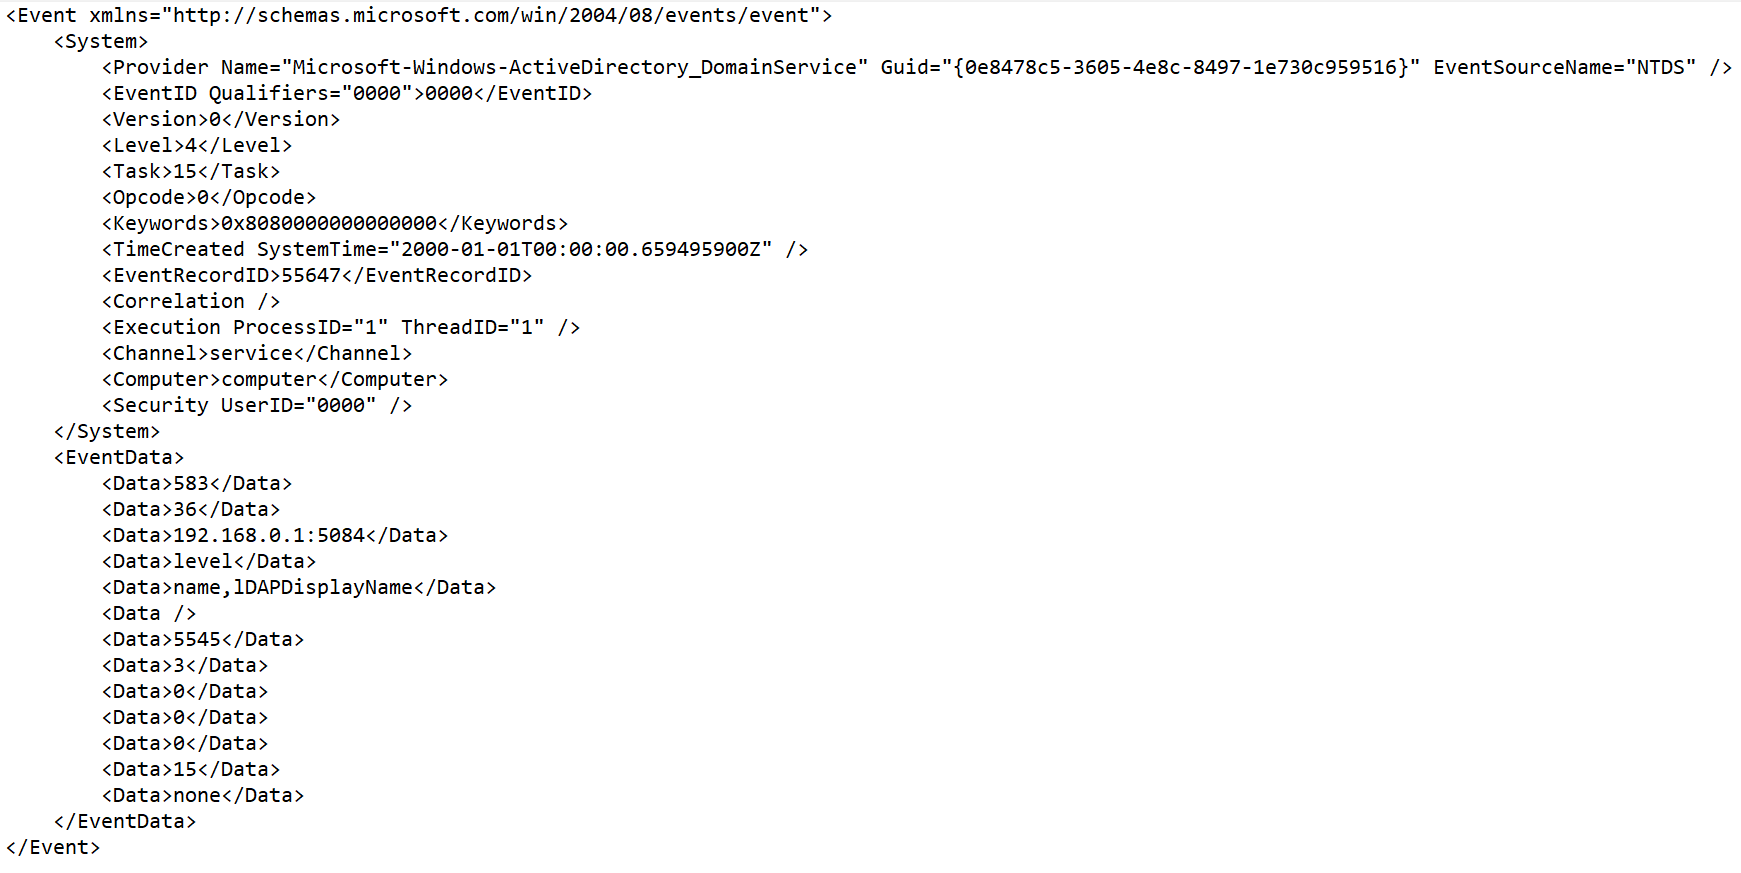
To parse such events, you must:
- Configure tag numbering.
- Configure data mapping for numbered tags with KUMA event fields.
Simultaneous use of XML attributes and Tag numbering leads to incorrect operation of the normalizer. If an attribute contains unnamed tags or the identical tags, we recommend using the Tag numbering functionality. If the attribute contains only named tags, use XML attributes.
To configure parsing of events with identically named or unnamed tags:
- Create a new normalizer or open an existing normalizer for editing.
- In the Basic event parsing window of the normalizer, in the Parsing method drop-down list, select 'xml' and in the Tag numbering field, click Add field.
In the displayed field, enter the full path to the tag to whose elements you want to assign a number. For example, Event.EventData.Data. The first number to be assigned to a tag is 0. If the tag is empty, for example, <Data />, it is also assigned a number.
- To configure data mapping, under Mapping, click Add row and do the following:
- In the new row, in the Source field, enter the full path to the tag and its index. For the Microsoft Windows event from the example above, the full path with indices look like this:
- Event.EventData.Data.0
- Event.EventData.Data.1
- Event.EventData.Data.2 and so on
- In the KUMA field drop-down list, select the field in the KUMA event that will receive the value from the numbered tag after parsing.
- In the new row, in the Source field, enter the full path to the tag and its index. For the Microsoft Windows event from the example above, the full path with indices look like this:
- To save changes:
- If you created a new normalizer, click Save.
- If you edited an existing normalizer, click Update configuration in the collector to which the normalizer is linked.
Parsing is configured.
- netflow5
- netflow9
- sflow5
- ipfix
- sql
- Keep raw event (required)—in this drop-down list, indicate whether you need to store the raw event in the newly created normalized event. Available values:
- Don't save—do not save the raw event. This is the default setting.
- Only errors—save the raw event in the
Rawfield of the normalized event if errors occurred when parsing it. This value is convenient to use when debugging a service. In this case, every time an event has a non-emptyRawfield, you know there was a problem.If fields containing the names
*Addressor*Date*do not comply with normalization rules, these fields are ignored. No normalization error occurs in this case, and the values of the fields are not displayed in theRawfield of the normalized event even if the Keep raw event → Only errors option was selected. - Always—always save the raw event in the
Rawfield of the normalized event.
This setting is not available for extra parsing rules.
- Keep extra fields (required)—in this drop-down list, you can choose whether you want to save fields and their values if no mapping rules have been configured for them (see below). This data is saved as an array in the
Extraevent field. Normalized events can be searched and filtered based on the data stored in theExtrafield.Filtering based on data from the Extra event field
By default, no extra fields are saved.
- Description—resource description: up to 4,000 Unicode characters.
This setting is not available for extra parsing rules.
- Event examples—in this field, you can provide an example of data that you want to process.
This setting is not available for the following parsing methods: netflow5, netflow9, sflow5, ipfix, sql.
The Event examples field is populated with data obtained from the raw event if the event was successfully parsed and the type of data obtained from the raw event matches the type of the KUMA field.
For example, the value "192.168.0.1" enclosed in quotation marks is not displayed in the SourceAddress field, in this case the value 192.168.0.1 is displayed in the Event examples field.
- Mapping settings block—here you can configure mapping of raw event fields to fields of the event in KUMA format:
- Source—column for the names of the raw event fields that you want to convert into KUMA event fields.
Clicking the
 button next to the field names in the Source column opens the Conversion window, in which you can use the Add conversion button to create rules for modifying the original data before they are written to the KUMA event fields. In the Conversion window, you can swap the added rules by dragging them by the icon; you can also delete them using the
  icon.
icon. - KUMA field—drop-down list for selecting the required fields of KUMA events. You can search for fields by entering their names in the field.
- Label—in this column, you can add a unique custom label to event fields that begin with
DeviceCustom*andFlex*.
New table rows can be added by using the Add row button. Rows can be deleted individually using the
button or all at once using the Clear all button.If you have loaded data into the Event examples field, the table will have an Examples column containing examples of values carried over from the raw event field to the KUMA event field.
If the size of the KUMA event field is less than the length of the value placed in it, the value is truncated to the size of the event field.
- Source—column for the names of the raw event fields that you want to convert into KUMA event fields.
Enrichment in the normalizer
When creating event parsing rules in the normalizer settings window, on the Enrichment tab, you can configure the rules for adding extra data to the fields of the normalized event using enrichment rules. These enrichment rules are stored in the settings of the normalizer where they were created.
Enrichments are created by using the Add enrichment button. There can be more than one enrichment rule. You can delete enrichment rules by using the button.
Settings available in the enrichment rule settings block:
- Source kind (required)—drop-down list for selecting the type of enrichment. Depending on the selected type, you may see advanced settings that will also need to be completed.
Available Enrichment rule source types:
- constant
- dictionary
- table
This type of enrichment is used if you need to add a value from the dictionary of the Table type.
When this enrichment type is selected in the Dictionary name drop-down list, select the dictionary for providing the values. In the Key fields group of settings, use the Add field button to select the event fields whose values are used for dictionary entry selection.
In the Mapping table, configure the dictionary fields to provide data and the event fields to receive data:
- In the Dictionary field column, select the dictionary field. The available fields depend on the selected dictionary resource.
- In the KUMA field column, select the event field to which the value is written. For some of the selected fields (
*custom*and*flex*), in the Label column, you can specify a name for the data written to them.
New table rows can be added by using the Add new element button. Columns can be deleted using the
button. - event
This type of enrichment is used when you need to write a value from another event field to the current event field. Settings of this type of enrichment:
- In the Target field drop-down list, select the KUMA event field to which you want to write the data.
- In the Source field drop-down list, select the event field whose value will be written to the target field.
- Clicking the button opens the Conversion window in which you can, using the Add conversion button, create rules for modifying the original data before writing them to the KUMA event fields.
- template
- Target field (required)—drop-down list for selecting the KUMA event field that should receive the data.
This setting is not available for the enrichment source of the Table type.
Conditions for forwarding data to an extra normalizer
When creating additional event parsing rules, you can specify the conditions. When these conditions are met, the events are sent to the created parsing rule for processing. Conditions can be specified in the Additional event parsing window, on the Extra normalization conditions tab. This tab is not available for the basic parsing rules.
Available settings:
- Field to pass into normalizer—indicates the event field if you want only events with fields configured in normalizer settings to be sent for additional parsing.
If this field is blank, the full event is sent to the extra normalizer for processing.
- Set of filters—used to define complex conditions that must be met by the events received by the normalizer.
You can use the Add condition button to add a string containing fields for identifying the condition (see below).
You can use the Add group button to add a group of filters. Group operators can be switched between AND, OR, and NOT. You can add other condition groups and individual conditions to filter groups.
You can swap conditions and condition groups by dragging them by the
icon; you can also delete them using the icon.
Filter condition settings:
- Left operand and Right operand—used to specify the values to be processed by the operator.
In the left operand, you must specify the original field of events coming into the normalizer. For example, if the eventType - DeviceEventClass mapping is configured in the Basic event parsing window, then in the Additional event parsing window on the Extra normalization conditions tab, you must specify eventType in the left operand field of the filter. Data is processed only as text strings.
- Operators:
- = – full match of the left and right operands.
- startsWith – the left operand starts with the characters specified in the right operand.
- endsWith – the left operand ends with the characters specified in the right operand.
- match – the left operand matches the regular expression (RE2) specified in the right operand.
- in – the left operand matches one of the values specified in the right operand.
The incoming data can be converted by clicking the button. The Conversion window opens, where you can use the Add conversion button to create the rules for converting the source data before any actions are performed on them. In the Conversion window, you can swap the added rules by dragging them by the icon; you can also delete them using the icon.
Supported event sources
KUMA supports the normalization of events coming from systems listed in the "Supported event sources" table. Normalizers for these systems are included in the distribution kit.
Supported event sources
System name |
Normalizer name |
Type |
Normalizer description |
|---|---|---|---|
1C EventJournal |
[OOTB] 1C EventJournal Normalizer |
xml |
Designed for processing the event log of the 1C system. The event source is the 1C log. |
1C TechJournal |
[OOTB] 1C TechJournal Normalizer |
regexp |
Designed for processing the technology event log. The event source is the 1C technology log. |
Absolute Data and Device Security (DDS) |
[OOTB] Syslog-CEF |
Syslog |
Designed for processing events in the CEF format. |
AhnLab Malware Defense System (MDS) |
[OOTB] Syslog-CEF |
Syslog |
Designed for processing events in the CEF format. |
Ahnlab UTM |
[OOTB] Ahnlab UTM |
regexp |
Designed for processing events from the Ahnlab system. The event sources is system logs, operation logs, connections, the IPS module. |
AhnLabs MDS |
[OOTB] Syslog-CEF |
Syslog |
Designed for processing events in the CEF format. |
Apache Cassandra |
[OOTB] Apache Cassandra file |
regexp |
Designed for processing events from the logs of the Apache Cassandra database version 4.0. |
Aruba ClearPass |
[OOTB] Syslog-CEF |
Syslog |
Designed for processing events in the CEF format. |
Avigilon Access Control Manager (ACM) |
[OOTB] Syslog-CEF |
Syslog |
Designed for processing events in the CEF format. |
Ayehu eyeShare |
[OOTB] Syslog-CEF |
Syslog |
Designed for processing events in the CEF format. |
Barracuda Networks NG Firewall |
[OOTB] Syslog-CEF |
Syslog |
Designed for processing events in the CEF format. |
BeyondTrust Privilege Management Console |
[OOTB] Syslog-CEF |
Syslog |
Designed for processing events in the CEF format. |
BeyondTrust’s BeyondInsight |
[OOTB] Syslog-CEF |
Syslog |
Designed for processing events in the CEF format. |
Bifit Mitigator |
[OOTB] Bifit Mitigator Syslog |
Syslog |
Designed for processing events from the DDOS Mitigator protection system received via Syslog. |
Bloombase StoreSafe |
[OOTB] Syslog-CEF |
Syslog |
Designed for processing events in the CEF format. |
BMC CorreLog |
[OOTB] Syslog-CEF |
Syslog |
Designed for processing events in the CEF format. |
Bricata ProAccel |
[OOTB] Syslog-CEF |
Syslog |
Designed for processing events in the CEF format. |
Brinqa Risk Analytics |
[OOTB] Syslog-CEF |
Syslog |
Designed for processing events in the CEF format. |
Broadcom Symantec Advanced Threat Protection (ATP) |
[OOTB] Syslog-CEF |
Syslog |
Designed for processing events in the CEF format. |
Broadcom Symantec Endpoint Protection |
[OOTB] Broadcom Symantec Endpoint Protection |
regexp |
Designed for processing events from the Symantec Endpoint Protection system. |
Broadcom Symantec Endpoint Protection Mobile |
[OOTB] Syslog-CEF |
Syslog |
Designed for processing events in the CEF format. |
Broadcom Symantec Threat Hunting Center |
[OOTB] Syslog-CEF |
Syslog |
Designed for processing events in the CEF format. |
Canonical LXD |
[OOTB] Canonical LXD syslog |
Syslog |
Designed for processing events received via syslog from the Canonical LXD system version 5.18. |
Checkpoint |
[OOTB] Checkpoint Syslog CEF by CheckPoint |
Syslog |
Designed for processing events received from the Checkpoint event source via the Syslog protocol in the CEF format. |
Cisco Access Control Server (ACS) |
[OOTB] Cisco ACS syslog |
regexp |
Designed for processing events of the Cisco Access Control Server (ACS) system received via Syslog. |
Cisco ASA |
[OOTB] Cisco ASA Extended v 0.1 |
Syslog |
Designed for processing events of Cisco ASA devices. Cisco ASA base extended set of events. |
Cisco Email Security Appliance (WSA) |
[OOTB] Cisco WSA AccessFile |
regexp |
Designed for processing the event log of the Cisco Email Security Appliance (WSA) proxy server, the access.log file. |
Cisco Identity Services Engine (ISE) |
[OOTB] Cisco ISE syslog |
regexp |
Designed for processing events of the Cisco Identity Services Engine (ISE) system received via Syslog. |
Cisco Netflow v5 |
[OOTB] NetFlow v5 |
netflow5 |
Designed for processing events from Cisco Netflow version 5. |
Cisco NetFlow v9 |
[OOTB] NetFlow v9 |
netflow9 |
Designed for processing events from Cisco Netflow version 9. |
Cisco Prime |
[OOTB] Cisco Prime syslog |
Syslog |
Designed for processing events of the Cisco Prime system version 3.10 received via syslog. |
Cisco Secure Email Gateway (SEG) |
[OOTB] Syslog-CEF |
Syslog |
Designed for processing events in the CEF format. |
Cisco Secure Firewall Management Center |
[OOTB] Syslog-CEF |
Syslog |
Designed for processing events in the CEF format. |
Citrix NetScaler |
[OOTB] Citrix NetScaler |
regexp |
Designed for processing events from the Citrix NetScaler 13.7 load balancer. |
Claroty Continuous Threat Detection |
[OOTB] Syslog-CEF |
Syslog |
Designed for processing events in the CEF format. |
CloudPassage Halo |
[OOTB] Syslog-CEF |
Syslog |
Designed for processing events in the CEF format. |
Сodemaster Mirada |
[OOTB] Сodemaster Mirada syslog |
Syslog |
Designed for processing events of the Codemaster Mirada system received via syslog. |
Corvil Network Analytics |
[OOTB] Syslog-CEF |
Syslog |
Designed for processing events in the CEF format. |
Cribl Stream |
[OOTB] Syslog-CEF |
Syslog |
Designed for processing events in the CEF format. |
CrowdStrike Falcon Host |
[OOTB] Syslog-CEF |
Syslog |
Designed for processing events in the CEF format. |
CyberArk Privileged Threat Analytics (PTA) |
[OOTB] Syslog-CEF |
Syslog |
Designed for processing events in the CEF format. |
CyberPeak Spektr |
[OOTB] CyberPeak Spektr syslog |
Syslog |
Designed for processing events of the CyberPeak Spektr system version 3 received via syslog. |
DeepInstinct |
[OOTB] Syslog-CEF |
Syslog |
Designed for processing events in the CEF format. |
Delinea Secret Server |
[OOTB] Syslog-CEF |
Syslog |
Designed for processing events in the CEF format. |
Digital Guardian Endpoint Threat Detection |
[OOTB] Syslog-CEF |
Syslog |
Designed for processing events in the CEF format. |
BIND DNS server |
[OOTB] BIND Syslog [OOTB] BIND file |
Syslog regexp |
[OOTB] BIND Syslog is designed for processing events of the BIND DNS server received via Syslog. [OOTB] BIND file is designed for processing event logs of the BIND DNS server. |
Dovecot |
[OOTB] Dovecot Syslog |
Syslog |
Designed for processing events of the Dovecot mail server received via Syslog. The event source is POP3/IMAP logs. |
Dragos Platform |
[OOTB] Syslog-CEF |
Syslog |
Designed for processing events in the CEF format. |
EclecticIQ Intelligence Center |
[OOTB] Syslog-CEF |
Syslog |
Designed for processing events in the CEF format. |
Edge Technologies AppBoard and enPortal |
[OOTB] Syslog-CEF |
Syslog |
Designed for processing events in the CEF format. |
Eltex MES Switches |
[OOTB] Eltex MES Switches |
regexp |
Designed for processing events from Eltex network devices. |
Eset Protect |
[OOTB] Syslog-CEF |
Syslog |
Designed for processing events in the CEF format. |
F5 BigIP Advanced Firewall Manager (AFM) |
[OOTB] Syslog-CEF |
Syslog |
Designed for processing events in the CEF format. |
FFRI FFR yarai |
[OOTB] Syslog-CEF |
Syslog |
Designed for processing events in the CEF format. |
FireEye CM Series |
[OOTB] Syslog-CEF |
Syslog |
Designed for processing events in the CEF format. |
FireEye Malware Protection System |
[OOTB] Syslog-CEF |
Syslog |
Designed for processing events in the CEF format. |
Forcepoint NGFW |
[OOTB] Syslog-CEF |
Syslog |
Designed for processing events in the CEF format. |
Forcepoint SMC |
[OOTB] Syslog-CEF |
Syslog |
Designed for processing events in the CEF format. |
Fortinet FortiGate |
[OOTB] Syslog-CEF |
regexp |
Designed for processing events in the CEF format. |
Fortinet FortiGate |
[OOTB] FortiGate syslog KV |
Syslog |
Designed for processing events from FortiGate firewalls via syslog. The event source is FortiGate logs in key-value format. |
Fortinet Fortimail |
[OOTB] Fortimail |
regexp |
Designed for processing events of the FortiMail email protection system. The event source is Fortimail mail system logs. |
Fortinet FortiSOAR |
[OOTB] Syslog-CEF |
Syslog |
Designed for processing events in the CEF format. |
FreeIPA |
[OOTB] FreeIPA |
json |
Designed for processing events from the FreeIPA system. The event source is Free IPA directory service logs. |
FreeRADIUS |
[OOTB] FreeRADIUS syslog |
Syslog |
Designed for processing events of the FreeRADIUS system received via Syslog. The normalizer supports events from FreeRADIUS version 3.0. |
Gardatech GardaDB |
[OOTB] Gardatech GardaDB syslog |
Syslog |
Designed for processing events of the Gardatech GardaDB system received via syslog in a CEF-like format. |
Gardatech Perimeter |
[OOTB] Gardatech Perimeter syslog |
Syslog |
Designed for processing events of the Gardatech Perimeter system version 5.3 received via syslog. |
Gigamon GigaVUE |
[OOTB] Syslog-CEF |
Syslog |
Designed for processing events in the CEF format. |
HAProxy |
[OOTB] HAProxy syslog |
Syslog |
Designed for processing logs of the HAProxy system. The normalizer supports events of the HTTP log, TCP log, Error log type from HAProxy version 2.8. |
Huawei Eudemon |
[OOTB] Huawei Eudemon |
regexp |
Designed for processing events from Huawei Eudemon firewalls. The event source is logs of Huawei Eudemon firewalls. |
Huawei USG |
[OOTB] Huawei USG Basic |
Syslog |
Designed for processing events received from Huawei USG security gateways via Syslog. |
IBM InfoSphere Guardium |
[OOTB] Syslog-CEF |
Syslog |
Designed for processing events in the CEF format. |
Ideco UTM |
[OOTB] Ideco UTM Syslog |
Syslog |
Designed for processing events received from Ideco UTM via Syslog. The normalizer supports events of Ideco UTM 14.7, 14.10. |
Illumio Policy Compute Engine (PCE) |
[OOTB] Syslog-CEF |
Syslog |
Designed for processing events in the CEF format. |
Imperva Incapsula |
[OOTB] Syslog-CEF |
Syslog |
Designed for processing events in the CEF format. |
Imperva SecureSphere |
[OOTB] Syslog-CEF |
Syslog |
Designed for processing events in the CEF format. |
Orion Soft |
[OOTB] Orion Soft zVirt syslog |
regexp |
Designed for processing events of the Orion Soft 3.1 virtualization system. |
Indeed PAM |
[OOTB] Indeed PAM syslog |
Syslog |
Designed for processing events of Indeed PAM (Privileged Access Manager) version 2.6. |
Indeed SSO |
[OOTB] Indeed SSO |
xml |
Designed for processing events of the Indeed SSO (Single Sign-On) system. |
InfoWatch Traffic Monitor |
[OOTB] InfoWatch Traffic Monitor SQL |
sql |
Designed for processing events received by the connector from the database of the InfoWatch Traffic Monitor system. |
Intralinks VIA |
[OOTB] Syslog-CEF |
Syslog |
Designed for processing events in the CEF format. |
IPFIX |
[OOTB] IPFIX |
ipfix |
Designed for processing events in the IP Flow Information Export (IPFIX) format. |
Juniper JUNOS |
[OOTB] Juniper - JUNOS |
regexp |
Designed for processing audit events received from Juniper network devices. |
Kaspersky Anti Targeted Attack (KATA) |
[OOTB] KATA |
cef |
Designed for processing alerts or events from the Kaspersky Anti Targeted Attack activity log. |
Kaspersky CyberTrace |
[OOTB] CyberTrace |
regexp |
Designed for processing Kaspersky CyberTrace events. |
Kaspersky Endpoint Detection and Response (KEDR) |
[OOTB] KEDR telemetry |
json |
Designed for processing Kaspersky EDR telemetry tagged by KATA. The event source is kafka, EnrichedEventTopic |
Kaspersky Industrial CyberSecurity for Networks |
[OOTB] KICS4Net v2.x |
cef |
Designed for processing events of Kaspersky Industrial CyberSecurity for Networks version 2.x. |
Kaspersky Industrial CyberSecurity for Networks |
[OOTB] KICS4Net v3.x |
Syslog |
Designed for processing events of Kaspersky Industrial CyberSecurity for Networks version 3.x |
Kaspersky Security Center |
[OOTB] KSC |
cef |
Designed for processing Kaspersky Security Center events received via Syslog. |
Kaspersky Security Center |
[OOTB] KSC from SQL |
sql |
Designed for processing events received by the connector from the database of the Kaspersky Security Center system. |
Kaspersky Security for Linux Mail Server (KLMS) |
[OOTB] KLMS Syslog CEF |
Syslog |
Designed for processing events from Kaspersky Security for Linux Mail Server in CEF format via Syslog. |
Kaspersky Security Mail Gateway (KSMG) |
[OOTB] KSMG Syslog CEF |
Syslog |
Designed for processing events of Kaspersky Secure Mail Gateway version 2.0 in CEF format via Syslog. |
Kaspersky Web Traffic Security (KWTS) |
[OOTB] KWTS Syslog CEF |
Syslog |
Designed for processing events received from Kaspersky Web Traffic Security in CEF format via Syslog. |
Kaspersky Web Traffic Security (KWTS) |
[OOTB] KWTS (KV) |
Syslog |
Designed for processing events in Kaspersky Web Traffic Security for Key-Value format. |
Kemptechnologies LoadMaster |
[OOTB] Syslog-CEF |
Syslog |
Designed for processing events in the CEF format. |
Kerio Control |
[OOTB] Kerio Control |
Syslog |
Designed for processing events of Kerio Control firewalls. |
KUMA |
[OOTB] KUMA forwarding |
json |
Designed for processing events forwarded from KUMA. |
Libvirt |
[OOTB] Libvirt syslog |
Syslog |
Designed for processing events of Libvirt version 8.0.0 received via syslog. |
Lieberman Software ERPM |
[OOTB] Syslog-CEF |
Syslog |
Designed for processing events in the CEF format. |
Linux |
[OOTB] Linux audit and iptables Syslog |
Syslog |
Designed for processing events of the Linux operating system. This normalizer will be removed from the OOTB set after the next release. If you are using this normalizer, you must migrate to the [OOTB] Linux audit and iptables Syslog v1 normalizer. |
Linux |
[OOTB] Linux audit and iptables Syslog v1 |
Syslog |
Designed for processing events of the Linux operating system. |
Linux |
[OOTB] Linux audit.log file |
regexp |
Designed for processing security logs of Linux operating systems received via Syslog. |
MariaDB |
[OOTB] MariaDB Audit Plugin Syslog |
Syslog |
Designed for processing events coming from the MariaDB audit plugin over Syslog. |
Microsoft DHCP |
[OOTB] MS DHCP file |
regexp |
Designed for processing Microsoft DHCP server events. The event source is Windows DHCP server logs. |
Microsoft DNS |
[OOTB] DNS Windows |
regexp |
Designed for processing Microsoft DNS server events. The event source is Windows DNS server logs. |
Microsoft Exchange |
[OOTB] Exchange CSV |
csv |
Designed for processing the event log of the Microsoft Exchange system. The event source is Exchange server MTA logs. |
Microsoft IIS |
[OOTB] IIS Log File Format |
regexp |
The normalizer processes events in the format described at https://learn.microsoft.com/en-us/windows/win32/http/iis-logging. The event source is Microsoft IIS logs. |
Microsoft Network Policy Server (NPS) |
[OOTB] Microsoft Products |
xml |
The normalizer is designed for processing events of the Microsoft Windows operating system. The event source is Network Policy Server events. |
Microsoft Sysmon |
[OOTB] Microsoft Products |
xml |
This normalizer is designed for processing Microsoft Sysmon module events. |
Microsoft Windows |
[OOTB] Microsoft Products |
xml |
The normalizer is designed for processing events of the Microsoft Windows operating system. |
Microsoft PowerShell |
[OOTB] Microsoft Products |
xml |
The normalizer is designed for processing events of the Microsoft Windows operating system. |
Microsoft SQL Server |
[OOTB] Microsoft SQL Server xml |
xml |
Designed for processing events of MS SQL Server versions 2008, 2012, 2014, 2016. |
Microsoft Windows Remote Desktop Services |
[OOTB] Microsoft Products |
xml |
The normalizer is designed for processing events of the Microsoft Windows operating system. The event source is the log at Applications and Services Logs - Microsoft - Windows - TerminalServices-LocalSessionManager - Operational |
Microsoft Windows XP/2003 |
[OOTB] SNMP. Windows {XP/2003} |
json |
Designed for processing events received from workstations and servers running Microsoft Windows XP, Microsoft Windows 2003 operating systems using the SNMP protocol. |
MikroTik |
[OOTB] MikroTik syslog |
regexp |
Designed for events received from MikroTik devices via Syslog. |
Minerva Labs Minerva EDR |
[OOTB] Minerva EDR |
regexp |
Designed for processing events from the Minerva EDR system. |
MySQL 5.7 |
[OOTB] MariaDB Audit Plugin Syslog |
Syslog |
Designed for processing events coming from the MariaDB audit plugin over Syslog. |
NetIQ Identity Manager |
[OOTB] Syslog-CEF |
Syslog |
Designed for processing events in the CEF format. |
NetScout Systems nGenius Performance Manager |
[OOTB] Syslog-CEF |
Syslog |
Designed for processing events in the CEF format. |
Netskope Cloud Access Security Broker |
[OOTB] Syslog-CEF |
Syslog |
Designed for processing events in the CEF format. |
Netwrix Auditor |
[OOTB] Syslog-CEF |
Syslog |
Designed for processing events in the CEF format. |
Nextcloud |
[OOTB] Nextcloud syslog |
Syslog |
Designed for events of Nextcloud version 26.0.4 received via syslog. The normalizer does not save information from the Trace field. |
Nexthink Engine |
[OOTB] Syslog-CEF |
Syslog |
Designed for processing events in the CEF format. |
Nginx |
[OOTB] Nginx regexp |
regexp |
Designed for processing Nginx web server log events. |
NIKSUN NetDetector |
[OOTB] Syslog-CEF |
Syslog |
Designed for processing events in the CEF format. |
One Identity Privileged Session Management |
[OOTB] Syslog-CEF |
Syslog |
Designed for processing events in the CEF format. |
Open VPN |
[OOTB] OpenVPN file |
regexp |
Designed for processing the event log of the OpenVPN system. |
Oracle |
[OOTB] Oracle Audit Trail |
sql |
Designed for processing database audit events received by the connector directly from an Oracle database. |
PagerDuty |
[OOTB] Syslog-CEF |
Syslog |
Designed for processing events in the CEF format. |
Palo Alto Cortex Data Lake |
[OOTB] Syslog-CEF |
Syslog |
Designed for processing events in the CEF format. |
Palo Alto Networks NGFW |
[OOTB] PA-NGFW (Syslog-CSV) |
Syslog |
Designed for processing events from Palo Alto Networks firewalls received via Syslog in CSV format. |
Palo Alto Networks PANOS |
[OOTB] Syslog-CEF |
Syslog |
Designed for processing events in the CEF format. |
Penta Security WAPPLES |
[OOTB] Syslog-CEF |
Syslog |
Designed for processing events in the CEF format. |
Positive Technologies ISIM |
[OOTB] PTsecurity ISIM |
regexp |
Designed for processing events from the PT Industrial Security Incident Manager system. |
Positive Technologies Network Attack Discovery (NAD) |
[OOTB] PTsecurity NAD |
Syslog |
Designed for processing events from PT Network Attack Discovery (NAD) received via Syslog. |
Positive Technologies Sandbox |
[OOTB] PTsecurity Sandbox |
regexp |
Designed for processing events of the PT Sandbox system. |
Positive Technologies Web Application Firewall |
[OOTB] PTsecurity WAF |
Syslog |
Designed for processing events from the PTsecurity (Web Application Firewall) system. |
PostgreSQL pgAudit |
[OOTB] PostgreSQL pgAudit Syslog |
Syslog |
Designed for processing events of the pgAudit audit plug-n for PostgreSQL database received via Syslog. |
Proofpoint Insider Threat Management |
[OOTB] Syslog-CEF |
Syslog |
Designed for processing events in the CEF format. |
Proxmox |
[OOTB] Proxmox file |
regexp |
Designed for processing events of the Proxmox system version 7.2-3 stored in a file. The normalizer supports processing of events in access and pveam logs. |
PT NAD |
[OOTB] PT NAD json |
json |
Designed for processing events coming from PT NAD in json format. This normalizer supports events from PT NAD version 11.1, 11.0. |
QEMU - hypervisor logs |
[OOTB] QEMU - Hypervisor file |
regexp |
Designed for processing events of the QEMU hypervisor stored in a file. QEMU 6.2.0 and Libvirt 8.0.0 are supported. |
QEMU - virtual machine logs |
[OOTB] QEMU - Virtual Machine file |
regexp |
Designed for processing events from logs of virtual machines of the QEMU hypervisor version 6.2.0, stored in a file. |
Radware DefensePro AntiDDoS |
[OOTB] Radware DefensePro AntiDDoS |
Syslog |
Designed for processing events from the DDOS Mitigator protection system received via Syslog. |
Reak Soft Blitz Identity Provider |
[OOTB] Reak Soft Blitz Identity Provider file |
regexp |
Designed for processing events of the Reak Soft Blitz Identity Provider system version 5.16, stored in a file. |
Recorded Future Threat Intelligence Platform |
[OOTB] Syslog-CEF |
Syslog |
Designed for processing events in the CEF format. |
ReversingLabs N1000 Appliance |
[OOTB] Syslog-CEF |
Syslog |
Designed for processing events in the CEF format. |
Rubicon Communications pfSense |
[OOTB] pfSense Syslog |
Syslog |
Designed for processing events from the pfSense firewall received via Syslog. |
Rubicon Communications pfSense |
[OOTB] pfSense w/o hostname |
Syslog |
Designed for processing events from the pfSense firewall. The Syslog header of these events does not contain a hostname. |
SailPoint IdentityIQ |
[OOTB] Syslog-CEF |
Syslog |
Designed for processing events in the CEF format. |
Sendmail |
[OOTB] Sendmail syslog |
Syslog |
Designed for processing events of Sendmail version 8.15.2 received via syslog. |
SentinelOne |
[OOTB] Syslog-CEF |
Syslog |
Designed for processing events in the CEF format. |
Snort |
[OOTB] Snort 3 json file |
json |
Designed for processing events of Snort version 3 in JSON format. |
Sonicwall TZ |
[OOTB] Sonicwall TZ Firewall |
Syslog |
Designed for processing events received via Syslog from the SonicWall TZ firewall. |
Sophos XG |
[OOTB] Sophos XG |
regexp |
Designed for processing events from the Sophos XG firewall. |
Squid |
[OOTB] Squid access Syslog |
Syslog |
Designed for processing events of the Squid proxy server received via the Syslog protocol. |
Squid |
[OOTB] Squid access.log file |
regexp |
Designed for processing Squid log events from the Squid proxy server. The event source is access.log logs |
S-Terra VPN Gate |
[OOTB] S-Terra |
Syslog |
Designed for processing events from S-Terra VPN Gate devices. |
Suricata |
[OOTB] Suricata json file |
json |
This package contains a normalizer for Suricata 7.0.1 events stored in a JSON file. The normalizer supports processing the following event types: flow, anomaly, alert, dns, http, ssl, tls, ftp, ftp_data, ftp, smb, rdp, pgsql, modbus, quic, dhcp, bittorrent_dht, rfb. |
ThreatConnect Threat Intelligence Platform |
[OOTB] Syslog-CEF |
Syslog |
Designed for processing events in the CEF format. |
ThreatQuotient |
[OOTB] Syslog-CEF |
Syslog |
Designed for processing events in the CEF format. |
TrapX DeceptionGrid |
[OOTB] Syslog-CEF |
Syslog |
Designed for processing events in the CEF format. |
Trend Micro Control Manager |
[OOTB] Syslog-CEF |
Syslog |
Designed for processing events in the CEF format. |
Trend Micro Deep Security |
[OOTB] Syslog-CEF |
Syslog |
Designed for processing events in the CEF format. |
Trend Micro NGFW |
[OOTB] Syslog-CEF |
Syslog |
Designed for processing events in the CEF format. |
Trustwave Application Security DbProtect |
[OOTB] Syslog-CEF |
Syslog |
Designed for processing events in the CEF format. |
Unbound |
[OOTB] Unbound Syslog |
Syslog |
Designed for processing events from the Unbound DNS server received via Syslog. |
UserGate |
[OOTB] Syslog-CEF |
Syslog |
Designed for processing events in the CEF format received from the UserGate system via Syslog. |
Varonis DatAdvantage |
[OOTB] Syslog-CEF |
Syslog |
Designed for processing events in the CEF format. |
Veriato 360 |
[OOTB] Syslog-CEF |
Syslog |
Designed for processing events in the CEF format. |
VipNet TIAS |
[OOTB] Vipnet TIAS syslog |
Syslog |
Designed for processing events of ViPNet TIAS 3.8 received via Syslog. |
VMware ESXi |
[OOTB] VMware ESXi syslog |
regexp |
Designed for processing VMware ESXi events (support for a limited number of events from ESXi versions 5.5, 6.0, 6.5, 7.0) received via Syslog. |
VMWare Horizon |
[OOTB] VMware Horizon - Syslog |
Syslog |
Designed for processing events received from the VMware Horizon 2106 system via Syslog. |
VMwareCarbon Black EDR |
[OOTB] Syslog-CEF |
Syslog |
Designed for processing events in the CEF format. |
Vormetric Data Security Manager |
[OOTB] Syslog-CEF |
Syslog |
Designed for processing events in the CEF format. |
Votiro Disarmer for Windows |
[OOTB] Syslog-CEF |
Syslog |
Designed for processing events in the CEF format. |
Wallix AdminBastion |
[OOTB] Wallix AdminBastion syslog |
regexp |
Designed for processing events received from the Wallix AdminBastion system via Syslog. |
WatchGuard - Firebox |
[OOTB] WatchGuard Firebox |
Syslog |
Designed for processing WatchGuard Firebox events received via Syslog. |
Webroot BrightCloud |
[OOTB] Syslog-CEF |
Syslog |
Designed for processing events in the CEF format. |
Winchill Fracas |
[OOTB] PTC Winchill Fracas |
regexp |
Designed for processing events of the Windchill FRACAS failure registration system. |
Zabbix |
[OOTB] Zabbix SQL |
sql |
Designed for processing events of Zabbix 6.4. |
ZEEK IDS |
[OOTB] ZEEK IDS json file |
json |
Designed for processing logs of the ZEEK IDS system in JSON format. The normalizer supports events from ZEEK IDS version 1.8. |
Zettaset BDEncrypt |
[OOTB] Syslog-CEF |
Syslog |
Designed for processing events in the CEF format. |
Zscaler Nanolog Streaming Service (NSS) |
[OOTB] Syslog-CEF |
Syslog |
Designed for processing events in the CEF format. |
IT-Bastion – SKDPU |
[OOTB] Syslog-CEF |
Syslog |
Designed for processing events in the CEF format received from the IT-Bastion SKDPU system via Syslog. |
A-Real Internet Control Server (ICS) |
[OOTB] A-real IKS syslog |
regexp |
Designed for processing events of the A-Real Internet Control Server (ICS) system received via Syslog. The normalizer supports events from A-Real ICS version 7.0 and later. |
Apache web server |
[OOTB] Apache HTTP Server file |
regexp |
Designed for processing Apache HTTP Server 2.4 events stored in a file. The normalizer supports processing of events from the Application log in the Common or Combined Log formats, as well as the Error log. Expected format of the Error log events: "[%t] [%-m:%l] [pid %P:tid %T] [server\ %v] [client\ %a] %E: %M;\ referer\ %-{Referer}i" |
Apache web server |
[OOTB] Apache HTTP Server syslog |
Syslog |
Designed for processing events of the Apache HTTP Server received via syslog. The normalizer supports processing of Apache HTTP Server 2.4 events from the Access log in the Common or Combined Log format, as well as the Error log. Expected format of the Error log events: "[%t] [%-m:%l] [pid %P:tid %T] [server\ %v] [client\ %a] %E: %M;\ referer\ %-{Referer}i" |
Lighttpd web server |
[OOTB] Lighttpd syslog |
Syslog |
Designed for processing Access events of the Lighttpd system received via syslog. The normalizer supports processing of Lighttpd version 1.4 events. Expected format of Access log events: $remote_addr $http_request_host_name $remote_user [$time_local] "$request" $status $body_bytes_sent "$http_referer" "$http_user_agent" |
IVK Kolchuga-K |
[OOTB] Kolchuga-K Syslog |
Syslog |
Designed for processing events from the IVK Kolchuga-K system, version LKNV.466217.002, via Syslog. |
infotecs ViPNet IDS |
[OOTB] Syslog-CEF |
Syslog |
Designed for processing events in the CEF format received from the infotecs ViPNet IDS system via Syslog. |
infotecs ViPNet Coordinator |
[OOTB] VipNet Coordinator Syslog |
Syslog |
Designed for processing events from the ViPNet Coordinator system received via Syslog. |
Kod Bezopasnosti — Continent |
[OOTB][regexp] Continent IPS/IDS & TLS |
regexp |
Designed for processing events of Continent IPS/IDS device log. |
Kod Bezopasnosti — Continent |
[OOTB] Continent SQL |
sql |
Designed for getting events of the Continent system from the database. |
Kod Bezopasnosti SecretNet 7 |
[OOTB] SecretNet SQL |
sql |
Designed for processing events received by the connector from the database of the SecretNet system. |
Confident - Dallas Lock |
[OOTB] Confident Dallas Lock |
regexp |
Designed for processing events from the Dallas Lock 8 information protection system. |
CryptoPro NGate |
[OOTB] Ngate Syslog |
Syslog |
Designed for processing events received from the CryptoPro NGate system via Syslog. |
NT Monitoring and Analytics |
[OOTB] Syslog-CEF |
Syslog |
Designed for processing events in the CEF format received from the NT Monitoring and Analytics system via Syslog. |
BlueCoat proxy server |
[OOTB] BlueCoat Proxy v0.2 |
regexp |
Designed to process BlueCoat proxy server events. The event source is the BlueCoat proxy server event log. |
SKDPU NT Access Gateway |
[OOTB] Bastion SKDPU-GW |
Syslog |
Designed for processing events of the SKDPU NT Access gateway system received via Syslog. |
Solar Dozor |
[OOTB] Solar Dozor Syslog |
Syslog |
Designed for processing events received from the Solar Dozor system version 7.9 via Syslog. The normalizer supports custom format events and does not support CEF format events. |
- |
[OOTB] Syslog header |
Syslog |
Designed for processing events received via Syslog. The normalizer parses the header of the Syslog event, the message field of the event is not parsed. If necessary, you can parse the message field using other normalizers. |
Aggregation rules
Aggregation rules let you combine repetitive events of the same type and replace them with one common event. In this way, you can reduce the number of similar events sent to the storage and/or correlator, reduce the workload on services, conserve data storage space and licensing quota (EPS). An aggregation event is created when a time or number of events threshold is reached, whichever occurs first.
For aggregation rules, you can configure a filter and apply it only to events that match the specified conditions.
You can configure aggregation rules under Resources - Aggregation rules, and then select the created aggregation rule from the drop-down list in the collector settings. You can also configure aggregation rules directly in the collector settings.
Available aggregation rule settings
Setting |
Description |
|---|---|
Name |
Required setting. Unique name of the resource. Must contain 1 to 128 Unicode characters. |
Tenant |
Required setting. The name of the tenant that owns the resource. |
Threshold |
Threshold on the number of events. After accumulating the specified number of events with identical fields, the collector creates an aggregation event and begins accumulating events for the next aggregated event. The default value is |
Triggered rule lifetime |
Required setting. Threshold on time in seconds. When the specified time expires, the accumulation of base events stops, the collector creates an aggregated event and starts collecting events for the next aggregated event. The default value is |
Description |
Resource description: up to 4,000 Unicode characters. |
Identical fields |
Required setting. This drop-down list lists the fields of normalized events that must have identical values. For example, for network events, you can use SourceAddress, DestinationAddress, DestinationPort fields. In the aggregation event, these fields are populated with the values of the base events. |
Unique fields |
This drop-down list lists the fields whose range of values must be saved in the aggregated event. For example, if the DestinationPort field is specified under Unique fields and not Identical fields, the aggregated event combines base connection events for a variety of ports, and the DestinationPort field of the aggregated event contains a list of all ports to which connections were made. |
Sum fields |
In this drop-down list, you can select the fields whose values will be summed up during aggregation and written to the same-name fields of the aggregated event. |
Filter |
Group of settings in which you can specify the conditions for identifying events that must be processed by this resource. You can select an existing filter from the drop-down list or create a new filter. In aggregation rules, do not use filters with the TI operand or the TIDetect, inActiveDirectoryGroup, or hasVulnerability operators. The Active Directory fields for which you can use the inActiveDirectoryGroup operator will appear during the enrichment stage (after aggregation rules are executed). Creating a filter in resources
|
The KUMA distribution kit includes aggregation rules listed in the table below.
Predefined aggregation rules
Aggregation rule name |
Description |
[OOTB] Netflow 9 |
The rule is triggered after 100 events or 10 seconds. Events are aggregated by fields:
The DeviceCustomString1 and BytesIn fields are summed up. |
Enrichment rules
Event enrichment involves adding information to events that can be used to identify and investigate an incident.
Enrichment rules let you add supplementary information to event fields by transforming data that is already present in the fields, or by querying data from external systems. For example, suppose that a user name is recorded in the event. You can use an enrichment rule to add information about the department, position, and manager of this user to the event fields.
Enrichment rules can be used in the following KUMA services and features:
Available enrichment rule settings are listed in the table below.
Basic settings tab
Setting |
Description |
|---|---|
Name |
Required setting. Unique name of the resource. Must contain 1 to 128 Unicode characters. |
Tenant |
Required setting. The name of the tenant that owns the resource. |
Source kind |
Required setting. Drop-down list for selecting the type of incoming events. Depending on the selected type, you may see the following additional settings:
|
Debug |
A drop-down list in which you can enable logging of service operations. Logging is disabled by default. |
Description |
Resource description: up to 4,000 Unicode characters. |
Filter |
Group of settings in which you can specify the conditions for identifying events that must be processed by this resource. You can select an existing filter from the drop-down list or create a new filter. Creating a filter in resources
|
 .
.Predefined enrichment rules
The KUMA distribution kit includes enrichment rules listed in the table below.
Predefined enrichment rules
Enrichment rule name |
Description |
[OOTB] KATA alert |
Used to enrich events received from KATA in the form of a hyperlink to an alert. The hyperlink is put in the DeviceExternalId field. |
Correlation rules
Correlation rules are used to recognize specific sequences of processed events and to take certain actions after recognition, such as creating correlation events/alerts or interacting with an active list.
Correlation rules can be used in the following KUMA services and features:
The available correlation rule settings depend on the selected type. Types of correlation rules:
- standard—used to find correlations between several events. Resources of this kind can create correlation events.
This rule kind is used to determine complex correlation patterns. For simpler patterns you should use other correlation rule kinds that require less resources to operate.
- simple—used to create correlation events if a certain event is found.
- operational—used for operations with Active lists. This rule kind cannot create correlation events.
For these resources, you can enable the display of control characters in all input fields except the Description field.
If a correlation rule is used in the correlator and an alert was created based on it, any change to the correlation rule will not result in a change to the existing alert even if the correlator service is restarted. For example, if the name of a correlation rule is changed, the name of the alert will remain the same. If you close the existing alert, a new alert will be created and it will take into account the changes made to the correlation rule.
Standard correlation rules
Standard correlation rules are used to identify complex patterns in processed events.
The search for patterns is conducted by using buckets
The correlation rule window contains the following configuration tabs:
- General—used to specify the main settings of the correlation rule. On this tab, you can select the type of correlation rule.
- Selectors—used to define the conditions that the processed events must fulfill to trigger the correlation rule. Available settings vary based on the selected rule type.
- Actions—used to set the triggers that will activate when the conditions configured in the Selectors settings block are fulfilled. The Correlation rule resource must have at least one trigger. Available settings vary based on the selected rule type.
General tab
- Name (required)—a unique name for this type of resource. Must contain 1 to 128 Unicode characters.
- Tenant (required)—the tenant that owns the correlation rule.
- Type (required)—a drop-down list for selecting the type of correlation rule. Select standard if you want to create a standard correlation rule.
- Identical fields (required)—the event fields that should be grouped in a Bucket. The hash of the values of the selected fields is used as the Bucket key. If the selector (see below) triggers, the selected fields will be copied to the correlation event.
If different selectors of the correlation rule use fields that have different values in events, do not specify these fields in the Identical fields section.
- Unique fields—event fields that should be sent to the Bucket. If this parameter is set, the Bucket will receive only unique events. The hash of the selected fields' values is used as the Bucket key.
You can use local variables in the Identical fields and Unique fields sections. To access a variable, its name must be preceded with the "$" character.
For an example of using local variables in these sections, refer to the rule provided with KUMA: R403_Access to malicious resources from a host with disabled protection or an out-of-date anti-virus database. - Rate limit—maximum number of times a correlation rule can be triggered per second. The default value is 100.
If correlation rules employing complex logic for pattern detection are not triggered, this may be due to the specific method used to count rule triggers in KUMA. In this case, try to increase the value of Rate limit to
1000000, for example. - Window, sec (required)—bucket lifetime, in seconds. Default value: 86,400 seconds (24 hours). This timer starts when the Bucket is created (when it receives the first event). The lifetime is not updated, and when it runs out, the On timeout trigger from the Actions group of settings is activated and the bucket is deleted. The On every threshold and On subsequent thresholds triggers can be activated more than once during the lifetime of the bucket.
- Base events keep policy—this drop-down list is used to specify which base events must be stored in the correlation event:
- first (default value)—this option is used to store the first base event of the event collection that triggered creation of the correlation event.
- last—this option is used to store the last base event of the event collection that triggered creation of the correlation event.
- all—this option is used to store all base events of the event collection that triggered creation of the correlation event.
- Priority—base coefficient used to determine the importance of a correlation rule. The default value is Low.
- Order by—in this drop-down list, you can select the event field that will be used by the correlation rule selectors to track situational changes. This could be useful if you want to configure a correlation rule to be triggered when several types of events occur sequentially, for example.
- Description—the description of a resource. Up to 4,000 Unicode characters.
Selectors tab
A rule of the standard kind can have multiple selectors. You can add selectors by clicking the Add selector button and can remove them by clicking the Delete selector button. Selectors can be moved by using the button.
The order of conditions specified in the selector of the correlation rule is significant and affects system performance. We recommend putting the most unique condition in the first place in the selector.
Consider two examples of selectors that select successful authentication events in Microsoft Windows.
Selector 1:
Condition 1. DeviceProduct = Microsoft Windows
Condition 2. DeviceEventClassID = 4624
Селектор 2:
Condition 1. DeviceEventClassID = 4624
Condition 2. DeviceProduct = Microsoft Windows
The order of conditions in Selector 2 is preferable because it causes less load on the system.
In the selector of the correlation rule, you can use regular expressions conforming to the RE2 standard.
Using regular expressions in correlation rules is computationally intensive compared to other operations. Therefore, when designing correlation rules, we recommend limiting the use of regular expressions to the necessary minimum and using other available operations.
To use a regular expression, you must use the match comparison operator. The regular expression must be placed in a constant. The use of capture groups in regular expressions is optional. For the correlation rule to trigger, the field text matched against the regexp must exactly match the regular expression.
For a primer on syntax and examples of correlation rules that use regular expressions in their selectors, see the following rules that are provided with KUMA:
- R105_04_Suspicious PowerShell commands. Suspected obfuscation.
- R333_Suspicious creation of files in the autorun folder.
For each selector, the following two tabs are available: Settings and Local variables.
The Settings tab contains the following settings:
- Alias (required)—unique name of the event group that meets the conditions of the selector. Must contain 1 to 128 Unicode characters.
- Selector threshold (event count) (required)—the number of events that must be received by the selector to trigger.
- Filter (required)—used to set the criteria for determining events that should trigger the selector. You can select an existing filter from the drop-down list or create a new filter.
Creating a filter in resources
- In the Filter drop-down list, select Create new.
- If you want to keep the filter as a separate resource, select the Save filter check box.
In this case, you will be able to use the created filter in various services.
This check box is cleared by default.
- If you selected the Save filter check box, enter a name for the created filter resource in the Name field. The name must contain 1 to 128 Unicode characters.
- In the Conditions settings block, specify the conditions that the events must meet:
- Click the Add condition button.
- In the Left operand and Right operand drop-down lists, specify the search parameters.
Depending on the data source selected in the Right operand field, you may see fields of additional parameters that you need to use to define the value that will be passed to the filter. For example, when choosing active list you will need to specify the name of the active list, the entry key, and the entry key field.
- In the operator drop-down list, select the relevant operator.
- If necessary, select the do not match case check box. When this check box is selected, the operator ignores the case of the values.
The selection of this check box does not apply to the InSubnet, InActiveList, InCategory or InActiveDirectoryGroup operators.
This check box is cleared by default.
- If you want to add a negative condition, select If not from the If drop-down list.
- You can add multiple conditions or a group of conditions.
- If you have added multiple conditions or groups of conditions, choose a search condition (and, or, not) by clicking the AND button.
- If you want to add existing filters that are selected from the Select filter drop-down list, click the Add filter button.
You can view the nested filter settings by clicking the
 button.
- Recovery—this check box must be selected when the Correlation rule must NOT trigger if a certain number of events are received from the selector. By default, this check box is cleared.
On the Local variables tab, use the Add variable button to declare variables that will be used within the limits of this correlation rule.
Actions tab
A rule of the standard kind can have multiple triggers.
- On first threshold—this trigger activates when the Bucket registers the first triggering of the selector during the lifetime of the Bucket.
- On subsequent thresholds—this trigger activates when the Bucket registers the second and all subsequent triggering of the selector during the lifetime of the Bucket.
- On every threshold—this trigger activates every time the Bucket registers the triggering of the selector.
- On timeout—this trigger activates when the lifetime of the Bucket ends, and is linked to the selector with the Recovery check box selected. In other words, this trigger activates if the situation detected by the correlation rule is not resolved within the defined amount of time.
Every trigger is represented as a group of settings with the following parameters available:
- Output—if this check box is selected, the correlation event is sent for post-processing: for external enrichment outside the correlation rule, for a response, and to destinations.
- Loop—if this check box is selected, the created correlation event is processed by the rule chain of the current correlator. This allows hierarchical correlation.
If both check boxes are selected, the correlation rule will be sent for post-processing first and then to the current correlation rule selectors.
- Do not create alert—if this check box is selected, an alert will not be created when this correlation rule is triggered.
- Active lists update settings group—used to assign the trigger for one or more operations with active lists. You can use the Add active list action and Delete active list action buttons to add or delete operations with active lists, respectively.
Available settings:
- Name (required)—this drop-down list is used to select the Active list resources.
- Operation (required)—this drop-down list is used to select the operation that must be performed:
- Get—get the Active list entry and write the values of the selected fields into the correlation event.
- Set—write the values of the selected fields of the correlation event into the Active list by creating a new or updating an existing Active list entry. When the Active list entry is updated, the data is merged and only the specified fields are overwritten.
- Delete—delete the Active list entry.
- Key fields (required)—this is the list of event fields used to create the Active list entry. It is also used as the Active list entry key.
The active list entry key depends on the available fields and does not depend on the order in which they are displayed in the KUMA web interface.
- Mapping (required for Get and Set operations)—used to map Active list fields with events fields. More than one mapping rule can be set.
- The left field is used to specify the Active list field.
The field must not contain special characters or numbers only.
- The middle drop-down list is used to select event fields.
- The right field can be used to assign a constant to the Active list field is the Set operation was selected.
- The left field is used to specify the Active list field.
- Enrichment settings group—you can modify the fields of correlation events by using enrichment rules. These enrichment rules are stored in the correlation rule where they were created. You can create multiple enrichment rules. Enrichment rules can be added or deleted by using the Add enrichment or Remove enrichment buttons, respectively.
- Source kind—you can select the type of enrichment in this drop-down list. Depending on the selected type, you may see advanced settings that will also need to be completed.
Available types of enrichment:
- constant
- dictionary
- table
This type of enrichment is used if you need to add a value from the dictionary of the Table type.
When this enrichment type is selected in the Dictionary name drop-down list, select the dictionary for providing the values. In the Key fields group of settings, use the Add field button to select the event fields whose values are used for dictionary entry selection.
In the Mapping table, configure the dictionary fields to provide data and the event fields to receive data:
- In the Dictionary field column, select the dictionary field. The available fields depend on the selected dictionary resource.
- In the KUMA field column, select the event field to which the value is written. For some of the selected fields (
*custom*and*flex*), in the Label column, you can specify a name for the data written to them.
New table rows can be added by using the Add new element button. Columns can be deleted using the
button. - event
This type of enrichment is used when you need to write a value from another event field to the current event field. Settings of this type of enrichment:
- In the Target field drop-down list, select the KUMA event field to which you want to write the data.
- In the Source field drop-down list, select the event field whose value will be written to the target field.
- Clicking the button opens the Conversion window in which you can, using the Add conversion button, create rules for modifying the original data before writing them to the KUMA event fields.
- template
- Debug—you can use this drop-down list to enable logging of service operations.
- Description—the description of a resource. Up to 4,000 Unicode characters.
- Source kind—you can select the type of enrichment in this drop-down list. Depending on the selected type, you may see advanced settings that will also need to be completed.
- Categorization settings group—used to change the categories of assets indicated in events. There can be several categorization rules. You can add or delete them by using the Add categorization or Remove categorization buttons. Only reactive categories can be added to assets or removed from assets.
- Operation—this drop-down list is used to select the operation to perform on the category:
- Add—assign the category to the asset.
- Delete—unbind the asset from the category.
- Event field—event field that indicates the asset requiring the operation.
- Category ID—you can click the button to select the category requiring the operation. Clicking this button opens the Select categories window showing the category tree. You can only select a category with Reactive content type.
- Operation—this drop-down list is used to select the operation to perform on the category:
Simple correlation rules
Simple correlation rules are used to define simple sequences of events.
The correlation rule window contains the following configuration tabs:
- General—used to specify the main settings of the correlation rule. On this tab, you can select the type of correlation rule.
- Selectors—used to define the conditions that the processed events must fulfill to trigger the correlation rule. Available settings vary based on the selected rule kind.
- Actions—used to set the triggers that will activate when the conditions configured in the Selectors settings block are fulfilled. A correlation rule must have at least one trigger. Available settings vary based on the selected rule type.
General tab
- Name (required)—a unique name for this type of resource. Must contain 1 to 128 Unicode characters.
- Tenant (required)—the tenant that owns the correlation rule.
- Type (required)—a drop-down list for selecting the type of correlation rule. Select simple if you want to create a simple correlation rule.
- Propagated fields (required)—event fields used for event selection. If the selector (see below) is triggered, these fields will be written to the correlation event.
- Rate limit—maximum number of times a correlation rule can be triggered per second. The default value is 100.
If correlation rules employing complex logic for pattern detection are not triggered, this may be due to the specific method used to count rule triggers in KUMA. In this case, try to increase the value of Rate limit to
1000000, for example. - Priority—base coefficient used to determine the importance of a correlation rule. The default value is
Low. - Description—the description of a resource. Up to 4,000 Unicode characters.
Selectors tab
A rule of the simple kind can have only one selector for which the Settings and Local variables tabs are available.
The Settings tab contains settings with the Filter settings block:
- Filter (required)—used to set the criteria for determining events that should trigger the selector. You can select an existing filter from the drop-down list or create a new filter.
Creating a filter in resources
- In the Filter drop-down list, select Create new.
- If you want to keep the filter as a separate resource, select the Save filter check box.
In this case, you will be able to use the created filter in various services.
This check box is cleared by default.
- If you selected the Save filter check box, enter a name for the created filter resource in the Name field. The name must contain 1 to 128 Unicode characters.
- In the Conditions settings block, specify the conditions that the events must meet:
- Click the Add condition button.
- In the Left operand and Right operand drop-down lists, specify the search parameters.
Depending on the data source selected in the Right operand field, you may see fields of additional parameters that you need to use to define the value that will be passed to the filter. For example, when choosing active list you will need to specify the name of the active list, the entry key, and the entry key field.
- In the operator drop-down list, select the relevant operator.
- If necessary, select the do not match case check box. When this check box is selected, the operator ignores the case of the values.
The selection of this check box does not apply to the InSubnet, InActiveList, InCategory or InActiveDirectoryGroup operators.
This check box is cleared by default.
- If you want to add a negative condition, select If not from the If drop-down list.
- You can add multiple conditions or a group of conditions.
- If you have added multiple conditions or groups of conditions, choose a search condition (and, or, not) by clicking the AND button.
- If you want to add existing filters that are selected from the Select filter drop-down list, click the Add filter button.
You can view the nested filter settings by clicking the
button.
On the Local variables tab, use the Add variable button to declare variables that will be used within the limits of this correlation rule.
The order of conditions specified in the selector of the correlation rule is significant and affects system performance. We recommend putting the most unique condition in the first place in the selector.
Consider two examples of selectors that select successful authentication events in Microsoft Windows.
Selector 1:
Condition 1. DeviceProduct = Microsoft Windows
Condition 2. DeviceEventClassID = 4624
Селектор 2:
Condition 1. DeviceEventClassID = 4624
Condition 2. DeviceProduct = Microsoft Windows
The order of conditions in Selector 2 is preferable because it causes less load on the system.
Actions tab
A rule of the simple kind can have only one trigger: On every event. It is activated every time the selector triggers.
Available parameters of the trigger:
- Output—if this check box is selected, the correlation event will be sent for post-processing: for enrichment, for a response, and to destinations.
- Loop—if this check box is selected, the correlation event will be processed by the current correlation rule. This allows hierarchical correlation.
If both check boxes are selected, the correlation rule will be sent for post-processing first and then to the current correlation rule selectors.
- Do not create alert—if this check box is selected, an alert will not be created when this correlation rule is triggered.
- Active lists update settings group—used to assign the trigger for one or more operations with active lists. You can use the Add active list action and Delete active list action buttons to add or delete operations with active lists, respectively.
Available settings:
- Name (required)—this drop-down list is used to select the active list.
- Operation (required)—this drop-down list is used to select the operation that must be performed:
- Get—get the Active list entry and write the values of the selected fields into the correlation event.
- Set—write the values of the selected fields of the correlation event into the Active list by creating a new or updating an existing Active list entry. When the Active list entry is updated, the data is merged and only the specified fields are overwritten.
- Delete—delete the Active list entry.
- Key fields (required)—this is the list of event fields used to create the Active list entry. It is also used as the Active list entry key.
The active list entry key depends on the available fields and does not depend on the order in which they are displayed in the KUMA web interface.
- Mapping (required for Get and Set operations)—used to map Active list fields with events fields. More than one mapping rule can be set.
- The left field is used to specify the Active list field.
The field must not contain special characters or numbers only.
- The middle drop-down list is used to select event fields.
- The right field can be used to assign a constant to the Active list field is the Set operation was selected.
- The left field is used to specify the Active list field.
- Enrichment settings group—you can modify the fields of correlation events by using enrichment rules. These enrichment rules are stored in the correlation rule where they were created. You can create multiple enrichment rules. Enrichment rules can be added or deleted by using the Add enrichment or Remove enrichment buttons, respectively.
- Source kind—you can select the type of enrichment in this drop-down list. Depending on the selected type, you may see advanced settings that will also need to be completed.
Available types of enrichment:
- constant
- dictionary
- table
This type of enrichment is used if you need to add a value from the dictionary of the Table type.
When this enrichment type is selected in the Dictionary name drop-down list, select the dictionary for providing the values. In the Key fields group of settings, use the Add field button to select the event fields whose values are used for dictionary entry selection.
In the Mapping table, configure the dictionary fields to provide data and the event fields to receive data:
- In the Dictionary field column, select the dictionary field. The available fields depend on the selected dictionary resource.
- In the KUMA field column, select the event field to which the value is written. For some of the selected fields (
*custom*and*flex*), in the Label column, you can specify a name for the data written to them.
New table rows can be added by using the Add new element button. Columns can be deleted using the
button. - event
This type of enrichment is used when you need to write a value from another event field to the current event field. Settings of this type of enrichment:
- In the Target field drop-down list, select the KUMA event field to which you want to write the data.
- In the Source field drop-down list, select the event field whose value will be written to the target field.
- Clicking the button opens the Conversion window in which you can, using the Add conversion button, create rules for modifying the original data before writing them to the KUMA event fields.
- template
- Debug—you can use this drop-down list to enable logging of service operations.
- Description—the description of a resource. Up to 4,000 Unicode characters.
- Filter settings block—lets you select which events will be forwarded for enrichment. Configuration is performed as described above.
- Source kind—you can select the type of enrichment in this drop-down list. Depending on the selected type, you may see advanced settings that will also need to be completed.
- Categorization settings group—used to change the categories of assets indicated in events. There can be several categorization rules. You can add or delete them by using the Add categorization or Remove categorization buttons. Only reactive categories can be added to assets or removed from assets.
- Operation—this drop-down list is used to select the operation to perform on the category:
- Add—assign the category to the asset.
- Delete—unbind the asset from the category.
- Event field—event field that indicates the asset requiring the operation.
- Category ID—you can click the button to select the category requiring the operation. Clicking this button opens the Select categories window showing the category tree.
- Operation—this drop-down list is used to select the operation to perform on the category:
Operational correlation rules
Operational correlation rules are used for working with active lists.
The correlation rule window contains the following tabs:
- General—used to specify the main settings of the correlation rule. On this tab, you can select the type of correlation rule.
- Selectors—used to define the conditions that the processed events must fulfill to trigger the correlation rule. Available settings vary based on the selected rule type.
- Actions—used to set the triggers that will activate when the conditions configured in the Selectors settings block are fulfilled. A correlation rule must have at least one trigger. Available settings vary based on the selected rule type.
General tab
- Name (required)—a unique name for this type of resource. Must contain 1 to 128 Unicode characters.
- Tenant (required)—the tenant that owns the correlation rule.
- Type (required)—a drop-down list for selecting the type of correlation rule. Select operational if you want to create an operational correlation rule.
- Rate limit—maximum number of times a correlation rule can be triggered per second. The default value is 100.
If correlation rules employing complex logic for pattern detection are not triggered, this may be due to the specific method used to count rule triggers in KUMA. In this case, try to increase the value of Rate limit to
1000000, for example. - Description—the description of a resource. Up to 4,000 Unicode characters.
Selectors tab
A rule of the operational kind can have only one selector for which the Settings and Local variables tabs are available.
The Settings tab contains settings with the Filter settings block:
- Filter (required)—used to set the criteria for determining events that should trigger the selector. You can select an existing filter from the drop-down list or create a new filter.
Creating a filter in resources
- In the Filter drop-down list, select Create new.
- If you want to keep the filter as a separate resource, select the Save filter check box.
In this case, you will be able to use the created filter in various services.
This check box is cleared by default.
- If you selected the Save filter check box, enter a name for the created filter resource in the Name field. The name must contain 1 to 128 Unicode characters.
- In the Conditions settings block, specify the conditions that the events must meet:
- Click the Add condition button.
- In the Left operand and Right operand drop-down lists, specify the search parameters.
Depending on the data source selected in the Right operand field, you may see fields of additional parameters that you need to use to define the value that will be passed to the filter. For example, when choosing active list you will need to specify the name of the active list, the entry key, and the entry key field.
- In the operator drop-down list, select the relevant operator.
- If necessary, select the do not match case check box. When this check box is selected, the operator ignores the case of the values.
The selection of this check box does not apply to the InSubnet, InActiveList, InCategory or InActiveDirectoryGroup operators.
This check box is cleared by default.
- If you want to add a negative condition, select If not from the If drop-down list.
- You can add multiple conditions or a group of conditions.
- If you have added multiple conditions or groups of conditions, choose a search condition (and, or, not) by clicking the AND button.
- If you want to add existing filters that are selected from the Select filter drop-down list, click the Add filter button.
You can view the nested filter settings by clicking the
button.
On the Local variables tab, use the Add variable button to declare variables that will be used within the limits of this correlation rule.
Actions tab
A rule of the operational kind can have only one trigger: On every event. It is activated every time the selector triggers.
Available parameters of the trigger:
- Active lists update settings group—used to assign the trigger for one or more operations with active lists. You can use the Add active list action and Delete active list action buttons to add or delete operations with active lists, respectively.
Available settings:
- Name (required)—this drop-down list is used to select the active list.
- Operation (required)—this drop-down list is used to select the operation that must be performed:
- Get—get the Active list entry and write the values of the selected fields into the correlation event.
- Set—write the values of the selected fields of the correlation event into the Active list by creating a new or updating an existing Active list entry. When the Active list entry is updated, the data is merged and only the specified fields are overwritten.
- Delete—delete the Active list entry.
- Key fields (required)—this is the list of event fields used to create the Active list entry. It is also used as the Active list entry key.
The active list entry key depends on the available fields and does not depend on the order in which they are displayed in the KUMA web interface.
- Mapping (required for Get and Set operations)—used to map Active list fields with events fields. More than one mapping rule can be set.
- The left field is used to specify the Active list field.
The field must not contain special characters or numbers only.
- The middle drop-down list is used to select event fields.
- The right field can be used to assign a constant to the Active list field is the Set operation was selected.
- The left field is used to specify the Active list field.
Variables in correlators
If tracking values in event fields, active lists, or dictionaries is not enough to cover some specific security scenarios, you can use global and local variables. You can use them to take various actions on the values received by the correlators by implementing complex logic for threat detection. Variables can be declared in the correlator (global variables) or in the correlation rule (local variables) by assigning a function to them, then querying them from correlation rules as if they were ordinary event fields and receiving the triggered function result in response.
Usage scope of variables:
- When searching for identical or unique field values in correlation rules.
- In the correlation rule selectors, in the filters of the conditions under which the correlation rule must be triggered.
- When enriching correlation events. Select Event as the source type.
- When populating active lists with values.
Variables can be queried the same way as event fields by preceding their names with the $ character.
Local variables in identical and unique fields
You can use local variables in the Identical fields and Unique fields sections of 'standard' type correlation rules. To use a local variable, its name must be preceded with the "$" character.
For an example of using local variables in the Identical fields and Unique fields sections, refer to the rule provided with KUMA: R403_Access to malicious resources from a host with disabled protection or an out-of-date anti-virus database.
Page topLocal variables in selector
To use a local variable in a selector:
- Add a local variable to the rule.
- In the Correlation rules window, go to the General tab and add the created local variable to the Identical fields section. Prefix the local variable name with a "$" character.
- In Correlation rules window, go to the Selectors tab, select an existing filter or create a new filter and click Add condition.
- Select the event field as the operand.
- Select the local variable as the event field value and prefix the variable name with a "$" character.
- Specify the remaining filter settings.
- Click Save.
For an example of using local variables, refer to the rule provided with KUMA: R403_Access to malicious resources from a host with disabled protection or an out-of-date anti-virus database.
Page topLocal Variables in event enrichment
You can use 'standard' and 'simple' correlation rules to enrich events with local variables.
Enrichment with text and numbers
You can enrich events with text (strings). To do so, you can use functions that modify strings: to_lower, to_upper, str_join, append, prepend, substring, tr, replace, str_join.
You can enrich events with numbers. To do so, you can use the following functions: addition ("+"), subtraction ("-"), multiplication ("*"), division ("/"), round, ceil, floor, abs, pow.
You can also use regular expressions to manage data in local variables.
Using regular expressions in correlation rules is computationally intensive compared to other operations. Therefore, when designing correlation rules, we recommend limiting the use of regular expressions to the necessary minimum and using other available operations.
Timestamp enrichment
You can enrich events with timestamps (date and time). To do so, you can use functions that let you get or modify timestamps: now, extract_from_timestamp, parse_timestamp, format_timestamp, truncate_timestamp, time_diff.
Operations with active lists and tables
You can enrich events with local variables and data from active lists and tables.
To enrich events with data from an active list, use the active_list, active_list_dyn functions.
To enrich events with data from a table, use the table_dict, dict functions.
You can create conditional statements by using the 'conditional' function in local variables. In this way, the variable can return one of the values depending on what data was received for processing.
Enriching events with a local variable
To use a local variable to enrich events:
- Add a local variable to the rule.
- In the Correlation rules window, go to the General tab and add the created local variable to the Identical fields section. Prefix the local variable name with a "$" character.
- In the Correlation rules window, go to the Actions tab, and under Enrichment, in the Source kind drop-down list, select Event.
- From the Target field drop-down list, select the KUMA event field to which you want to pass the value of the local variable.
- From the Source field drop-down list, select a local variable. Prefix the local variable name with a "$" character.
- Specify the remaining rule settings.
- Click Save.
Local variables in active list enrichment
You can use local variables to enrich active lists.
To enrich the active list with a local variable:
- Add a local variable to the rule.
- In the Correlation rules window, go to the General tab and add the created local variable to the Identical fields section. Prefix the local variable name with a "$" character.
- In the Correlation rules window, go to the Actions tab and under Active lists update, add the local variable to the Key fields field. Prefix the local variable name with a "$" character.
- Under Mapping, specify the correspondence between the event fields and the active list fields.
- Click the Save button.
Properties of variables
Local and global variables
The properties of global variables differ from the properties of local variables.
Global variables:
- Global variables are declared at the correlator level and are applied only within the scope of this correlator.
- The global variables of the correlator can be queried from all correlation rules that are specified in it.
- In standard correlation rules, the same global variable can take different values in each selector.
- It is not possible to transfer global variables between different correlators.
Local variables:
- Local variables are declared at the correlation rule level and are applied only within the limits of this rule.
- In standard correlation rules, the scope of a local variable consists of only the selector in which the variable was declared.
- Local variables can be declared in any type of correlation rule.
- Local variables cannot be transferred between rules or selectors.
- A local variable cannot be used as a global variable.
Variables used in various types of correlation rules
- In operational correlation rules, on the Actions tab, you can specify all variables available or declared in this rule.
- In standard correlation rules, on the Actions tab, you can provide only those variables specified in these rules on the General tab, in the Identical fields field.
- In simple correlation rules, on the Actions tab, you can provide only those variables specified in these rules on the General tab, in the Inherited Fields field.
Requirements for variables
When adding a variable function, you must first specify the name of the function, and then list its parameters in parentheses. Basic mathematical operations (addition, subtraction, multiplication, division) are an exception to this requirement. When these operations are used, parentheses are used to designate the severity of the operations.
Requirements for function names:
- Must be unique within the correlator.
- Must contain 1 to 128 Unicode characters.
- Must not begin with the character $.
- Must be written in camelCase or CamelCase.
Special considerations when specifying functions of variables:
- The sequence of parameters is important.
- Parameters are separated by a comma:
,. - String parameters are passed in single quotes:
'. - Event field names and variables are specified without quotation marks.
- When querying a variable as a parameter, add the
$character before its name. - You do not need to add a space between parameters.
- In all functions in which a variable can be used as parameters, nested functions can be created.
Functions of variables
Operations with active lists and dictionaries
"active_list" and "active_list_dyn" functions
These functions allow you to receive information from an active list and dynamically generate a field name for an active list and key.
You must specify the parameters in the following sequence:
- Name of the active list
- Expression that returns the field name of the active list
- One or more expressions whose results are used to generate the key
Usage example
Result
active_list('Test', to_lower('DeviceHostName'), to_lower(DeviceCustomString2), to_lower(DeviceCustomString1))
Gets the field value of the active list.
Use these functions to query the active list of the shared tenant from a variable. To do so, add the @Shared suffix after the name of the active list (case sensitive). For example, active_list('exampleActiveList@Shared', 'score', SourceAddress, SourceUserName).
"table_dict" function
Gets information about the value in the specified column of a dictionary of the table type.
You must specify the parameters in the following sequence:
- Dictionary name
- Dictionary column name
- One or more expressions whose results are used to generate the dictionary row key.
Usage example
Result
table_dict('exampleTableDict', 'office', SourceUserName)Gets data from the
exampleTableDictdictionary from the row with theSourceUserNamekey in theofficecolumn.table_dict('exampleTableDict', 'office', SourceAddress, to_lower(SourceUserName))Gets data from the
exampleTableDictdictionary from a composite key string from theSourceAddressfield value and the lowercase value of theSourceUserNamefield from theofficecolumn.
Use this function to access the dictionary of the shared tenant from a variable. To do so, add the @Shared suffix after the name of the active list (case sensitive). For example, table_dict('exampleTableDict@Shared', 'office', SourceUserName).
"dict" function
Gets information about the value in the specified column of a dictionary of the dictionary type.
You must specify the parameters in the following sequence:
- Dictionary name
- One or more expressions whose results are used to generate the dictionary row key.
Usage example
Result
dict('exampleDictionary', SourceAddress)Gets data from
exampleDictionaryfrom the row with theSourceAddresskey.dict('exampleDictionary', SourceAddress, to_lower(SourceUserName))Gets data from the
exampleDictionaryfrom a composite key string from theSourceAddressfield value and the lowercase value of theSourceUserNamefield.
Use this function to access the dictionary of the shared tenant from a variable. To do so, add the @Shared suffix after the name of the active list (case sensitive). For example, dict('exampleDictionary@Shared', SourceAddress).
Operation with rows
"len" function
Returns the number of characters in a string.
A string can be passed as a string, field name or variable.
Usage examples |
|
|
|
"to_lower" function
Converts characters in a string to lowercase.
A string can be passed as a string, field name or variable.
Usage examples |
|
|
|
"to_upper" function
Converts characters in a string to uppercase. A string can be passed as a string, field name or variable.
Usage examples |
|
|
|
"append" function
Adds characters to the end of a string.
You must specify the parameters in the following sequence:
- Original string.
- Added string.
Strings can be passed as a string, field name or variable.
Usage examples |
Usage result |
|
The string |
|
The string |
|
A string from |
"prepend" function
Adds characters to the beginning of a string.
You must specify the parameters in the following sequence:
- Original string.
- Added string.
Strings can be passed as a string, field name or variable.
Usage examples |
Usage result |
|
The string |
|
The string |
|
A string from |
"substring" function
Returns a substring from a string.
You must specify the parameters in the following sequence:
- Original string.
- Substring start position (natural number or 0).
- (Optional) substring end position.
Strings can be passed as a string, field name or variable. If the position number is greater than the original data string length, an empty string is returned.
Usage examples |
Usage result |
|
Returns a part of the string from the |
|
Returns a part of the string from the |
|
Returns the entire string from the |
"tr" function
Deletes the specified characters from the beginning and end of a string.
You must specify the parameters in the following sequence:
- Original string.
- (Optional) string that should be removed from the beginning and end of the original string.
Strings can be passed as a string, field name or variable. If you do not specify a string to be deleted, spaces will be removed from the beginning and end of the original string.
Usage examples |
Usage result |
|
Spaces have been removed from the beginning and end of the string from the |
|
If the |
|
If the |
"replace" function
Replaces all occurrences of character sequence A in a string with character sequence B.
You must specify the parameters in the following sequence:
- Original string.
- Search string: sequence of characters to be replaced.
- Replacement string: sequence of characters to replace the search string.
Strings can be passed as an expression.
Usage examples |
Usage result |
|
Returns a string from the |
|
Returns a string from |
"regexp_replace" function
Replaces a sequence of characters that match a regular expression with a sequence of characters and regular expression capturing groups.
You must specify the parameters in the following sequence:
- Original string.
- Search string: regular expression.
- Replacement string: sequence of characters to replace the search string, and IDs of the regular expression capturing groups. A string can be passed as an expression.
Strings can be passed as a string, field name or variable. Unnamed capturing groups can be used.
In regular expressions used in variable functions, each backslash character must be additionally escaped. For example, ^example\\\\ must be used instead of the regular expression ^example\\.
Usage examples |
Usage result |
|
Returns a string from the |
"regexp_capture" function
Gets the result matching the regular expression condition from the original string.
You must specify the parameters in the following sequence:
- Original string.
- Search string: regular expression.
Strings can be passed as a string, field name or variable. Unnamed capturing groups can be used.
In regular expressions used in variable functions, each backslash character must be additionally escaped. For example, ^example\\\\ must be used instead of the regular expression ^example\\.
Usage examples |
Example values |
Usage result |
|
|
|
Operations with timestamps
now function
Gets a timestamp in epoch format. Runs with no arguments.
Usage examples |
|
"extract_from_timestamp" function
Gets atomic time representations (year, month, day, hour, minute, second, day of the week) from fields and variables with time in the epoch format.
The parameters must be specified in the following sequence:
- Event field of the timestamp type, or variable.
- Notation of the atomic time representation. This parameter is case sensitive.
Possible variants of atomic time notation:
- y refers to the year in number format.
- M refers to the month in number notation.
- d refers to the number of the month.
- wd refers to the day of the week: Monday, Tuesday, Wednesday, Thursday, Friday, Saturday, Sunday.
- h refers to the hour in 24-hour format.
- m refers to the minutes.
- s refers to the seconds.
- (optional) Time zone notation. If this parameter is not specified, the time is calculated in UTC format.
Usage examples
extract_from_timestamp(Timestamp, 'wd')extract_from_timestamp(Timestamp, 'h')extract_from_timestamp($otherVariable, 'h')extract_from_timestamp(Timestamp, 'h', 'Europe/Moscow')
"parse_timestamp" function
Converts the time from RFC3339 format (for example, "2022-05-24 00:00:00", "2022-05-24 00:00:00+0300) to epoch format.
Usage examples |
|
|
"format_timestamp" function
Converts the time from epoch format to RFC3339 format.
The parameters must be specified in the following sequence:
- Event field of the timestamp type, or variable.
- Time format notation: RFC3339.
- (optional) Time zone notation. If this parameter is not specified, the time is calculated in UTC format.
Usage examples
format_timestamp(Timestamp, 'RFC3339')format_timestamp($otherVariable, 'RFC3339')format_timestamp(Timestamp, 'RFC3339', 'Europe/Moscow')
"truncate_timestamp" function
Rounds the time in epoch format. After rounding, the time is returned in epoch format. Time is rounded down.
The parameters must be specified in the following sequence:
- Event field of the timestamp type, or variable.
- Rounding parameter:
- 1s rounds to the nearest second.
- 1m rounds to the nearest minute.
- 1h rounds to the nearest hour.
- 24h rounds to the nearest day.
- (optional) Time zone notation. If this parameter is not specified, the time is calculated in UTC format.
Usage examples
Examples of rounded values
Usage result
truncate_timestamp(Timestamp, '1m')1654631774175 (7 June 2022, 19:56:14.175)
1654631760000 (7 June 2022, 19:56:00)
truncate_timestamp($otherVariable, '1h')1654631774175 (7 June 2022, 19:56:14.175)
1654628400000 (7 June 2022, 19:00:00)
truncate_timestamp(Timestamp, '24h', 'Europe/Moscow')1654631774175 (7 June 2022, 19:56:14.175)
1654560000000 (7 June 2022, 0:00:00)
"time_diff" function
Gets the time interval between two timestamps in epoch format.
The parameters must be specified in the following sequence:
- Interval end time. Event field of the timestamp type, or variable.
- Interval start time. Event field of the timestamp type, or variable.
- Time interval notation:
- ms refers to milliseconds.
- s refers to seconds.
- m refers to minutes.
- h refers to hours.
- d refers to days.
Usage examples
time_diff(EndTime, StartTime, 's')time_diff($otherVariable, Timestamp, 'h')time_diff(Timestamp, DeviceReceiptTime, 'd')
Mathematical operations
These are comprised of basic mathematical operations and functions.
Basic mathematical operations
Operations:
- Addition
- Subtraction
- Multiplication
- Division
- Modulo division
Parentheses determine the sequence of actions
Available arguments:
- Numeric event fields
- Numeric variables
- Real numbers
When modulo dividing, only natural numbers can be used as arguments.
Usage constraints:
- Division by zero returns zero.
- Mathematical operations between numbers and strings return zero.
- Integers resulting from operations are returned without a dot.
Usage examples
(Type=3; otherVariable=2; Message=text)Usage result
Type + 14
$otherVariable - Type-1
2 * 2.55
2 / 00
Type * Message0
(Type + 2) * 210
Type % $otherVariable1
"round" function
Rounds numbers.
Available arguments:
- Numeric event fields
- Numeric variables
- Numeric constants
Usage examples
(DeviceCustomFloatingPoint1=7.75; DeviceCustomFloatingPoint2=7.5 otherVariable=7.2)Usage result
round(DeviceCustomFloatingPoint1)8
round(DeviceCustomFloatingPoint2)8
round($otherVariable)7
"ceil" function
Rounds up numbers.
Available arguments:
- Numeric event fields
- Numeric variables
- Numeric constants
Usage examples
(DeviceCustomFloatingPoint1=7.15; otherVariable=8.2)Usage result
ceil(DeviceCustomFloatingPoint1)8
ceil($otherVariable)9
"floor" function
Rounds down numbers.
Available arguments:
- Numeric event fields
- Numeric variables
- Numeric constants
Usage examples
(DeviceCustomFloatingPoint1=7.15; otherVariable=8.2)Usage result
floor(DeviceCustomFloatingPoint1)7
floor($otherVariable)8
"abs" function
Gets the modulus of a number.
Available arguments:
- Numeric event fields
- Numeric variables
- Numeric constants
Usage examples
(DeviceCustomNumber1=-7; otherVariable=-2)Usage result
abs(DeviceCustomFloatingPoint1)7
abs($otherVariable)2
"pow" function
Exponentiates a number.
The parameters must be specified in the following sequence:
- Base — real numbers.
- Power — natural numbers.
Available arguments:
- Numeric event fields
- Numeric variables
- Numeric constants
Usage examples
pow(DeviceCustomNumber1, DeviceCustomNumber2)pow($otherVariable, DeviceCustomNumber1)
"str_join" function
Join multiple strings into one using a separator.
The parameters must be specified in the following sequence:
- Separator. String.
- String1, string2, stringN. At least 2 expressions.
Usage examples
Usage result
str_join('|', to_lower(Name), to_upper(Name), Name)String.
"conditional" function
Get one value if a condition is met and another value if the condition is not met.
The parameters must be specified in the following sequence:
- Condition. String. The syntax is similar to the conditions of the Where statement in SQL. You can use the functions of the KUMA variables and references to other variables in a condition.
- The value if the condition is met. Expression.
- The value if the condition is not met. Expression.
Supported operators:
- AND
- OR
- NOT
- =
- !=
- <
- <=
- >
- >=
- LIKE (RE2 regular expression is used, rather than an SQL expression)
- ILIKE (RE2 regular expression is used, rather than an SQL expression)
- BETWEEN
- IN
- IS NULL (check for an empty value, such as 0 or an empty string)
Usage examples (the value depends on arguments 2 and 3)
conditional('SourceUserName = \\'root\\' AND DestinationUserName = SourceUserName', 'match', 'no match')conditional(`DestinationUserName ILIKE 'svc_.*'`, 'match', 'no match')conditional(`DestinationUserName NOT LIKE 'svc_.*'`, 'match', 'no match')
Declaring variables
To declare variables, they must be added to a correlator or correlation rule.
To add a global variable to an existing correlator:
- In the KUMA web interface, under Resources → Correlators, select the resource set of the relevant correlator.
The Correlator Installation Wizard opens.
- Select the Global variables step of the Installation Wizard.
- click the Add variable button and specify the following parameters:
- In the Variable window, enter the name of the variable.
- In the Value window, enter the variable function.
Multiple variables can be added. Added variables can be edited or deleted by using the
icon. - Select the Setup validation step of the Installation Wizard and click Save.
A global variable is added to the correlator. It can be queried like an event field by inserting the $ character in front of the variable name. The variable will be used for correlation after restarting the correlator service.
To add a local variable to an existing correlation rule:
- In the KUMA web interface, under Resources → Correlation rules, select the relevant correlation rule.
The correlation rule settings window opens. The parameters of a correlation rule can also be opened from the correlator to which it was added by proceeding to the Correlation step of the Installation Wizard.
- Open the Selectors tab.
- In the selector, open the Local variables tab, click the Add variable button and specify the following parameters:
- In the Variable window, enter the name of the variable.
- In the Value window, enter the variable function.
Multiple variables can be added. Added variables can be edited or deleted by using the
icon.For standard correlation rules, repeat this step for each selector in which you want to declare variables.
- Click Save.
The local variable is added to the correlation rule. It can be queried like an event field by inserting the $ character in front of the variable name. The variable will be used for correlation after restarting the correlator service.
Added variables can be edited or deleted. If the correlation rule queries an undeclared variable (for example, if its name has been changed), an empty string is returned.
If you change the name of a variable, you will need to manually change the name of this variable in all correlation rules where you have used it.
Page topPredefined correlation rules
The KUMA distribution kit includes correlation rules listed in the table below.
Predefined correlation rules
Correlation rule name |
Description |
[OOTB] KATA alert |
Used for enriching KATA events. |
[OOTB] Successful Bruteforce |
Triggers when a successful authentication attempt is detected after multiple unsuccessful authentication attempts. This rule works based on the events of the sshd daemon. |
[OOTB][AD] Account created and deleted within a short period of time |
Detects instances of creation and subsequent deletion of accounts on Microsoft Windows hosts. |
[OOTB][AD] An account failed to log on from different hosts |
Detects multiple unsuccessful attempts to authenticate on different hosts. |
[OOTB][AD] Granted TGS without TGT (Golden Ticket) |
Detects suspected "Golden Ticket" type attacks. This rule works based on Microsoft Windows events. |
[OOTB][AD][Technical] 4768. TGT Requested |
The technical rule used to populate the active list is [OOTB][AD] List of requested TGT. EventID 4768. This rule works based on Microsoft Windows events. |
[OOTB][AD] Membership of sensitive group was modified |
Works based on Microsoft Windows events. |
[OOTB][AD] Multiple accounts failed to log on from the same host |
Triggers after multiple failed authentication attempts are detected on the same host from different accounts. |
[OOTB][AD] Possible Kerberoasting attack |
Detects suspected "Kerberoasting" type attacks. This rule works based on Microsoft Windows events. |
[OOTB][AD] Successful authentication with the same account on multiple hosts |
Detects connections to different hosts under the same account. This rule works based on Microsoft Windows events. |
[OOTB][AD] The account added and deleted from the group in a short period of time |
Detects the addition of a user to a group and subsequent removal. This rule works based on Microsoft Windows events. |
[OOTB][Net] Possible port scan |
Detects suspected port scans. This rule works based on Netflow, Ipfix events. |
Filters
Filters are used to select events based on user-defined conditions.
This is not true only when filters are used in the collector service, in which the filters select all events that DO NOT satisfy filter conditions.
Filters can be used in the following KUMA services and features:
- Collector.
- Correlator.
- Storage.
- KUMA agents.
- Correlation rules.
- Enrichment rules.
- Aggregation rules.
- Destinations.
- Response rules.
- Segmentation rules.
You can use standalone filters or built-in filters that are stored in the service or resource where they were created.
For these resources, you can enable the display of control characters in all input fields except the Description field.
Available settings for filters:
- Name (required)—a unique name for this type of resource. Must contain 1 to 128 Unicode characters. Inline filters are created in other resources or services and do not have names.
- Tenant (required)—name of the tenant that owns the resource.
- The Conditions group of settings lets you formulate filtering criteria by creating filter conditions and groups of filters, or by adding existing filters.
You can use the Add group button to add a group of filters. Group operators can be switched between AND, OR, and NOT. You can add groups, conditions, and existing filters to groups of filters. Conditions placed in the NOT subgroup are combined with the AND operator.
You can use the Add filter button to add an existing filter, which you can select in the Select filter drop-down list.
You can use the Add condition button to add a string containing fields for identifying the condition (see below).
Conditions, groups, and filters can be deleted by using the
button.
Settings of conditions:
- When (required)—in this drop-down list, you can specify whether or not to use the inverted function of the operator.
- Left operand and Right operand (required)—used to specify the values that the operator will process. The available types depend on the selected operator.
- Operator (required)—used to select the condition operator.
In this drop-down list, you can select the do not match case check box if the operator should ignore the case of values. This check box is ignored if the inSubnet, inActiveList, inCategory, InActiveDirectoryGroup, hasBit, inDictionary operators are selected. This check box is cleared by default.
The available operand kinds depends on whether the operand is left (L) or right (R).
Available operand kinds for left (L) and right (R) operands
Operator |
Event field type |
Active list type |
Dictionary type |
Table type |
TI type |
Constant type |
List type |
= |
L,R |
L,R |
L,R |
L,R |
L,R |
R |
R |
> |
L,R |
L,R |
L,R |
L,R |
L |
R |
|
>= |
L,R |
L,R |
L,R |
L,R |
L |
R |
|
< |
L,R |
L,R |
L,R |
L,R |
L |
R |
|
<= |
L,R |
L,R |
L,R |
L,R |
L |
R |
|
inSubnet |
L,R |
L,R |
L,R |
L,R |
L,R |
R |
R |
contains |
L,R |
L,R |
L,R |
L,R |
L,R |
R |
R |
startsWith |
L,R |
L,R |
L,R |
L,R |
L,R |
R |
R |
endsWith |
L,R |
L,R |
L,R |
L,R |
L,R |
R |
R |
match |
L |
L |
L |
L |
L |
R |
R |
hasVulnerability |
L |
L |
L |
L |
|
|
|
hasBit |
L |
L |
L |
L |
|
R |
R |
inActiveList |
|
|
|
|
|
|
|
inDictionary |
|
|
|
|
|
|
|
inCategory |
L |
L |
L |
L |
|
R |
R |
inActiveDirectoryGroup |
L |
L |
L |
L |
|
R |
R |
TIDetect |
|
|
|
|
|
|
|
The filters listed in the table below are included in the KUMA kit.
Predefined filters
Filter name |
Description |
[OOTB][AD] A member was added to a security-enabled global group (4728) |
Selects events of adding a user to an Active Directory security-enabled global group. |
[OOTB][AD] A member was added to a security-enabled universal group (4756) |
Selects events of adding a user to an Active Directory security-enabled universal group. |
[OOTB][AD] A member was removed from a security-enabled global group (4729) |
Selects events of removing a user from an Active Directory security-enabled global group. |
[OOTB][AD] A member was removed from a security-enabled universal group (4757) |
Selects events of removing a user from an Active Directory security-enabled universal group. |
[OOTB][AD] Account Created |
Selects Windows user account creation events. |
[OOTB][AD] Account Deleted |
Selects Windows user account deletion events. |
[OOTB][AD] An account failed to log on (4625) |
Selects Windows logon failure events. |
[OOTB][AD] Successful Kerberos authentication (4624, 4768, 4769, 4770) |
Selects successful Windows logon events and events with IDs 4769, 4770 that are logged on domain controllers. |
[OOTB][AD][Technical] 4768. TGT Requested |
Selects Microsoft Windows events with ID 4768. |
[OOTB][Net] Possible port scan |
Selects events that may indicate a port scan. |
[OOTB][SSH] Accepted Password |
Selects events of successful SSH connections with a password. |
[OOTB][SSH] Failed Password |
Selects attempts to connect over SSH with a password. |
Active lists
The active list is a bucket for data that is used by KUMA correlators for analyzing events according to the correlation rules.
For example, for a list of IP addresses with a bad reputation, you can:
- Create a correlation rule of the operational type and add these IP addresses to the active list.
- Create a correlation rule of the standard type and specify the active list as filtering criteria.
- Create a correlator with this rule.
In this case, KUMA selects all events that contain the IP addresses in the active list and creates a correlation event.
You can fill active lists automatically using correlation rules of the simple type or import a file that contains data for the active list.
You can add, copy, or delete active lists.
Active lists can be used in the following KUMA services and features:
The same active list can be used by different correlators. However, a separate entity of the active list is created for each correlator. Therefore, the contents of the active lists used by different correlators differ even if the active lists have the same names and IDs.
Only data based on correlation rules of the correlator are added to the active list.
You can add, edit, duplicate, delete, and export records in the active correlator sheet.
During the correlation process, when entries are deleted from active lists, service events are generated in the correlators. These events only exist in the correlators, and they are not redirected to other destinations. Correlation rules can be configured to track these events so that they can be used to identify threats. Service event fields for deleting an entry from the active list are described below.
Event field |
Value or comment |
|
Event identifier |
|
Time when the expired entry was deleted |
|
|
|
|
|
|
|
Correlator ID |
|
Correlator name |
|
Active list ID |
|
Key of the expired entry |
|
Number of deleted entry updates increased by one |
Viewing the table of active lists
To view the table of correlator active lists:
- In the KUMA web interface, select the Resources section.
- In the Services section, click the Active services button.
- Select the check box next to the correlator for which you want to view the active list.
- Click the Go to active lists button.
The Correlator active lists table is displayed.
The table contains the following data:
- Name—the name of the correlator list.
- Records—the number of record the active list contains.
- Size on disk—the size of the active list.
- Directory—the path to the active list on the KUMA Core server.
Adding active list
To add active list:
- In the KUMA web interface, select the Resources section.
- In the Resources section, click the Active lists button.
- Click the Add active list button.
- Do the following:
- In the Name field, enter a name for the active list.
- In the Tenant drop-down list, select the tenant that owns the resource.
- In the TTL field, specify time the record added to the active list is stored in it.
When the specified time expires, the record is deleted. The time is specified in seconds.
The default value is 0. If the value of the field is 0, the record is retained for 36,000 days (roughly 100 years).
- In the Description field, provide any additional information.
You can use up to 4,000 Unicode characters.
This field is optional.
- Click the Save button.
The active list is added.
Page topViewing the settings of an active list
To view the settings of an active list:
- In the KUMA web interface, select the Resources section.
- In the Resources section, click the Active lists button.
- In the Name column, select the active list whose settings you want to view.
This opens the active list settings window. It displays the following information:
- ID—identifier selected Active list.
- Name—unique name of the resource.
- Tenant—the name of the tenant that owns the resource.
- TTL—the record added to the active list is stored in it for this time. This value is specified in seconds.
- Description—any additional information about the resource.
Changing the settings of an active list
To change the settings of an active list:
- In the KUMA web interface, select the Resources section.
- In the Resources section, click the Active lists button.
- In the Name column, select the active list whose settings you want to change.
- Specify the values of the following parameters:
- Name—unique name of the resource.
- TTL—the record added to the active list is stored in it for this time. This value is specified in seconds.
If the field is set to 0, the record is stored indefinitely.
- Description—any additional information about the resource.
The ID and Tenant fields are not editable.
Duplicating the settings of an active list
To copy an active list:
- In the KUMA web interface, select the Resources section.
- In the Resources section, click the Active lists button.
- Select the check box next to the active lists you want to copy.
- Click Duplicate.
- Specify the necessary settings.
- Click the Save button.
The active list is copied.
Page topDeleting an active list
To delete an active list:
- In the KUMA web interface, select the Resources section.
- In the Resources section, click the Active lists button.
- Select the check boxes next to the active lists you want to delete.
To delete all lists, select the check box next to the Name column.
At least one check box must be selected.
- Click the Delete button.
- Click OK.
The active lists are deleted.
Page topViewing records in the active list
To view the records in the active list:
- In the KUMA web interface, select the Resources section.
- In the Services section, click the Active services button.
- Select the check box next to the correlator for which you want to view the active list.
- Click the Go to active lists button.
The Correlator active lists table is displayed.
- In the Name column, select the desired active list.
A table of records for the selected list is opened.
The table contains the following data:
- Key – the value of the record key.
- Record repetitions – total number of times the record was mentioned in events and identical records were downloaded when importing active lists to KUMA.
- Expiration date – date and time when the record must be deleted.
If the TTL field had the value of 0 when the active list was created, the records of this active list are retained for 36,000 days (roughly 100 years).
- Created – the time when the active list was created.
- Updated – the time when the active list was last updated.
Searching for records in the active list
To find a record in the active list:
- In the KUMA web interface, select the Resources section.
- In the Services section, click the Active services button.
- Select the check box next to the correlator for which you want to view the active list.
- Click the Go to active lists button.
The Correlator active lists table is displayed.
- In the Name column, select the desired active list.
A window with the records for the selected list is opened.
- In the Search field, enter the record key value or several characters from the key.
The table of records of the active list displays only the records with the key containing the entered characters.
Page topAdding a record to an active list
To add a record to the active list:
- In the KUMA web interface, select the Resources section.
- In the Services section, click the Active services button.
- Select the check box next to the required correlator.
- Click the Go to active lists button.
The Correlator active lists table is displayed.
- In the Name column, select the desired active list.
A window with the records for the selected list is opened.
- Click Add.
The Create record window opens.
- Specify the values of the following parameters:
- In the Key field, enter the name of the record.
You can specify several values separated by the "|" character.
The Key field cannot be empty. If the field is not filled in, KUMA returns an error when trying to save the changes.
- In the Value field, specify the values for fields in the Field column.
KUMA takes field names from the correlation rules with which the active list is associated. These names are not editable. You can delete these fields if necessary.
- Click the Add new element button to add more values.
- In the Field column, specify the field name.
The name must meet the following requirements:
- To be unique
- Do not contain tab characters
- Do not contain special characters except for the underscore character
- The maximum number of characters is 128
The name must not begin with an underscore and contain only numbers.
- In the Value column, specify the value for this field.
It must meet the following requirements:
- Do not contain tab characters
- Do not contain special characters except for the underscore character
- The maximum number of characters is 1024
This field is optional.
- In the Key field, enter the name of the record.
- Click the Save button.
The record is added. After saving, the records in the active list are sorted in alphabet order.
Page topDuplicating records in the active list
To duplicate a record in the active list:
- In the KUMA web interface, select the Resources section.
- In the Services section, click the Active services button.
- Select the check box next to the correlator for which you want to view the active list.
- Click the Go to active lists button.
The Correlator active lists table is displayed.
- In the Name column, select the desired active list.
A window with the records for the selected list is opened.
- Select the check boxes next to the record you want to copy.
- Click Duplicate.
- Specify the necessary settings.
The Key field cannot be empty. If the field is not filled in, KUMA returns an error when trying to save the changes.
Editing the field names in the Field column is not available for the records that have been added to the active list before. You can change the names only for records added at the time of editing. The name must not begin with an underscore and contain only numbers.
- Click the Save button.
The record is copied. After saving, the records in the active list are sorted in alphabet order.
Page topChanging a record in the active list
To edit a record in the active list:
- In the KUMA web interface, select the Resources section.
- In the Services section, click the Active services button.
- Select the check box next to the correlator for which you want to view the active list.
- Click the Go to active lists button.
The Correlator active lists table is displayed.
- In the Name column, select the desired active list.
A window with the records for the selected list is opened.
- Click the record name in the Key column.
- Specify the required values.
- Click the Save button.
The record is overwritten. After saving, the records in the active list are sorted in alphabet order.
Restrictions when editing a record:
- The record name is not editable. You can change it by importing the same data with a different name.
- Editing the field names in the Field column is not available for the records that have been added to the active list before. You can change the names only for records added at the time of editing. The name must not begin with an underscore and contain only numbers.
- The values in the Value column must meet the following requirements:
- Do not contain Cyrillic characters
- Do not contain spaces or tabs
- Do not contain special characters except for the underscore character
- The maximum number of characters is 128
Deleting records from the active list
To delete records from the active list:
- In the KUMA web interface, select the Resources section.
- In the Services section, click the Active services button.
- Select the check box next to the correlator for which you want to view the active list.
- Click the Go to active lists button.
The Correlator active lists table is displayed.
- In the Name column, select the desired active list.
A window with the records for the selected list is opened.
- Select the check boxes next to the records you want to delete.
To delete all records, select the check box next to the Key column.
At least one check box must be selected.
- Click the Delete button.
- Click OK.
The records will be deleted.
Page topImport data to an active list
To import active list:
- In the KUMA web interface, select the Resources section.
- In the Services section, click the Active services button.
- Select the check box next to the correlator for which you want to view the active list.
- Click the Go to active lists button.
The Correlator active lists table is displayed.
- Point the mouse over the row with the desired active list.
- Click to the left of the active list name.
- Select Import.
The active list import window opens.
- In the File field select the file you wan to import.
- In the Format drop-down list select the format of the file:
- csv
- tsv
- internal
- Under Key field, enter the name of the column containing the active list record keys.
- Click the Import button.
The data from the file is imported into the active list. The records included in the list before are saved.
Data imported from a file is not checked for invalid characters. If you use this data in widgets, widgets are displayed incorrectly if invalid characters are present in the data.
Page topExporting data from the active list
To export active list:
- In the KUMA web interface, select the Resources section.
- In the Services section, click the Active services button.
- Select the check box next to the correlator for which you want to view the active list.
- Click the Go to active lists button.
The Correlator active lists table is displayed.
- Point the mouse over the row with the desired active list.
- Click to the left of the desired active list.
- Click the Export button.
The active list is downloaded in the JSON format using your browsers settings. The name of the downloaded file reflects the name of active list.
Page topPredefined active lists
The active lists listed in the table below are included in the KUMA distribution kit.
Predefined active lists
Active list name |
Description |
[OOTB][AD] End-users tech support accounts |
This active list is used as a filter for the "[OOTB][AD] Successful authentication with same user account on multiple hosts" correlation rule. Accounts of technical support staff may be added to the active list. Records are not deleted from the active list. |
[OOTB][AD] List of requested TGT. EventID 4768 |
This active list is populated by the "[OOTB][AD][Technical] 4768 TGT Requested" rule, this active list is also used in the selector of the "[OOTB][AD] Granted TGS without TGT (Golden Ticket)" rule. Records are removed from the list 10 hours after they are recorded. |
[OOTB][AD] List of sensitive groups |
This active list is used as a filter for the "[OOTB][AD] Membership of sensitive group was modified" correlation rule. Critical domain groups, whose membership must be monitored, can be added to the active list. Records are not deleted from the active list. |
[OOTB][Linux] CompromisedHosts |
This active list is populated by the [OOTB] Successful Bruteforce by potentially compromised Linux hosts rule. Records are removed from the list 24 hours after they are recorded. |
Dictionaries
Description of parameters
Dictionaries are resources storing data that can be used by other KUMA resources and services.
Dictionaries can be used in the following KUMA services and features:
Available settings:
- Name (required)—a unique name for this type of resource. Must contain 1 to 128 Unicode characters.
- Tenant (required)—name of the tenant that owns the resource.
- Description—up to 256 Unicode characters describing the resource.
- Type (required)—type of dictionary. The selected type determines the format of the data that the dictionary can contain:
- You can add key-value pairs to the Dictionary type.
It is not recommended to add more than 50,000 entries to dictionaries of this type.
When adding lines with the same keys to the dictionary, each new line will overwrite the existing line with the same key. This means that only one line will be added to the dictionary.
- Data in the form of complex tables can be added to the Table type. You can interact with this type of dictionary by using the REST API.
- You can add key-value pairs to the Dictionary type.
- Values settings block—contains a table of dictionary data:
- For the Dictionary type, this block displays a list of Key—Value pairs. You can use the
 button to add rows to the table. You can delete rows by using the
  button that appears when you hover your mouse cursor over a row.
 - For the Table type, this block displays a table containing data. You can use the button to add rows and columns to the table. You can delete rows and columns by using the buttons that are displayed when you hover your mouse cursor over a row or a column header. Column headers can be edited.
If the dictionary contains more than 5,000 entries, they are not displayed in the KUMA web interface. To view the contents of such dictionaries, the contents must be exported in CSV format. If you edit the CSV file and import it back into KUMA, the dictionary is updated.
- For the Dictionary type, this block displays a list of Key—Value pairs. You can use the
Importing and exporting dictionaries
You can import or export dictionary data in CSV format (in UTF-8 encoding) by using the Import CSV or Export CSV buttons.
The format of the CSV file depends on the dictionary type:
- Dictionary type:
{KEY},{VALUE}\n - Table type:
{Column header 1}, {Column header N}, {Column header N+1}\n{Key1}, {ValueN}, {ValueN+1}\n{Key2}, {ValueN}, {ValueN+1}\nThe keys must be unique for both the CSV file and the dictionary. In tables, the keys are specified in the first column. Keys must contain 1 to 128 Unicode characters.
Values must contain 0 to 256 Unicode characters.
During an import, the contents of the dictionary are overwritten by the imported file. When imported into the dictionary, the resource name is also changed to reflect the name of the imported file.
If the key or value contains comma or quotation mark characters (, and "), they are enclosed in quotation marks (") when exported. Also, quotation mark character (") is shielded with additional quotation mark (").
If incorrect lines are detected in the imported file (for example, invalid separators), these lines will be ignored during import into the dictionary, and the import process will be interrupted during import into the table.
Interacting with dictionaries via API
You can use the REST API to read the contents of Table-type dictionaries. You can also modify them even if these resources are being used by active services. This lets you, for instance, configure enrichment of events with data from dynamically changing tables exported from third-party applications.
Predefined dictionaries
The dictionaries listed in the table below are included in the KUMA distribution kit.
Predefined dictionaries
Dictionary name |
Type |
Description |
[OOTB] Ahnlab. Severity |
dictionary |
Contains a table of correspondence between a priority ID and its name. |
[OOTB] Ahnlab. SeverityOperational |
dictionary |
Contains values of the SeverityOperational parameter and a corresponding description. |
[OOTB] Ahnlab. VendorAction |
dictionary |
Contains a table of correspondence between the ID of the operation being performed and its name. |
[OOTB] Cisco ISE Message Codes |
dictionary |
Contains Cisco ISE event codes and their corresponding names. |
[OOTB] DNS. Opcodes |
dictionary |
Contains a table of correspondence between decimal opcodes of DNS operations and their IANA-registered descriptions. |
[OOTB] IANAProtocolNumbers |
dictionary |
Contains the port numbers of transport protocols (TCP, UDP) and their corresponding service names, registered by IANA. |
[OOTB] Juniper - JUNOS |
dictionary |
Contains JUNOS event IDs and their corresponding descriptions. |
[OOTB] KEDR. AccountType |
dictionary |
Contains the ID of the user account type and its corresponding type name. |
[OOTB] KEDR. FileAttributes |
dictionary |
Contains IDs of file attributes stored by the file system and their corresponding descriptions. |
[OOTB] KEDR. FileOperationType |
dictionary |
Contains IDs of file operations from the KATA API and their corresponding operation names. |
[OOTB] KEDR. FileType |
dictionary |
Contains modified file IDs from the KATA API and their corresponding file type descriptions. |
[OOTB] KEDR. IntegrityLevel |
dictionary |
Contains the SIDs of the Microsoft Windows INTEGRITY LEVEL parameter and their corresponding descriptions. |
[OOTB] KEDR. RegistryOperationType |
dictionary |
Contains IDs of registry operations from the KATA API and their corresponding values. |
[OOTB] Linux. Sycall types |
dictionary |
Contains Linux call IDs and their corresponding names. |
[OOTB] MariaDB Error Codes |
dictionary |
The dictionary contains MariaDB error codes and is used by the [OOTB] MariaDB Audit Plugin syslog normalizer to enrich events. |
[OOTB] Microsoft SQL Server codes |
dictionary |
Contains MS SQL Server error IDs and their corresponding descriptions. |
[OOTB] MS DHCP Event IDs Description |
dictionary |
Contains Microsoft Windows DHCP server event IDs and their corresponding descriptions. |
[OOTB] S-Terra. Dictionary MSG ID to Name |
dictionary |
Contains IDs of S-Terra device events and their corresponding event names. |
[OOTB] S-Terra. MSG_ID to Severity |
dictionary |
Contains IDs of S-Terra device events and their corresponding Severity values. |
[OOTB] Syslog Priority To Facility and Severity |
table |
The table contains the Priority values and the corresponding Facility and Severity field values. |
[OOTB] VipNet Coordinator Syslog Direction |
dictionary |
Contains direction IDs (sequences of special characters) used in ViPNet Coordinator to designate a direction, and their corresponding values. |
[OOTB] Wallix EventClassId - DeviceAction |
dictionary |
Contains Wallix AdminBastion event IDs and their corresponding descriptions. |
[OOTB] Windows.Codes (4738) |
dictionary |
Contains operation codes present in the MS Windows audit event with ID 4738 and their corresponding names. |
[OOTB] Windows.Codes (4719) |
dictionary |
Contains operation codes present in the MS Windows audit event with ID 4719 and their corresponding names. |
[OOTB] Windows.Codes (4663) |
dictionary |
Contains operation codes present in the MS Windows audit event with ID 4663 and their corresponding names. |
[OOTB] Windows.Codes (4662) |
dictionary |
Contains operation codes present in the MS Windows audit event with ID 4662 and their corresponding names. |
[OOTB] Windows. EventIDs and Event Names mapping |
dictionary |
Contains Windows event IDs and their corresponding event names. |
[OOTB] Windows. FailureCodes (4625) |
dictionary |
Contains IDs from the Failure Information\Status and Failure Information\Sub Status fields of Microsoft Windows event 4625 and their corresponding descriptions. |
[OOTB] Windows. ImpersonationLevels (4624) |
dictionary |
Contains IDs from the Impersonation level field of Microsoft Windows event 4624 and their corresponding descriptions. |
[OOTB] Windows. KRB ResultCodes |
dictionary |
Contains Kerberos v5 error codes and their corresponding descriptions. |
[OOTB] Windows. LogonTypes (Windows all events) |
dictionary |
Contains IDs of user logon types and their corresponding names. |
[OOTB] Windows_Terminal Server. EventIDs and Event Names mapping |
dictionary |
Contains Microsoft Terminal Server event IDs and their corresponding names. |
[OOTB] Windows. Validate Cred. Error Codes |
dictionary |
Contains IDs of user logon types and their corresponding names. |
[OOTB] ViPNet Coordinator Syslog Direction |
dictionary |
Contains direction IDs (sequences of special characters) used in ViPNet Coordinator to designate a direction, and their corresponding values. |
[OOTB] Syslog Priority To Facility and Severity |
table |
Contains the Priority values and the corresponding Facility and Severity field values. |
Response rules
Response rules let you initiate automatic running of Kaspersky Security Center tasks, Threat Response actions for Kaspersky Endpoint Detection and Response, KICS for Networks, Active Directory, and running a custom script for specific events.
Automatic execution of Kaspersky Security Center tasks, Kaspersky Endpoint Detection and Response tasks, and KICS for Networks and Active Directory tasks in accordance with response rules is available when integrated with the relevant programs.
You can configure response rules under Resources - Response, and then select the created response rule from the drop-down list in the correlator settings. You can also configure response rules directly in the correlator settings.
Response rules for Kaspersky Security Center
You can configure response rules to automatically start tasks of anti-virus scan and updates on Kaspersky Security Center assets.
When creating and editing response rules for Kaspersky Security Center, you need to define values for the following settings.
Response rule settings
Setting |
Description |
|---|---|
Name |
Required setting. Unique name of the resource. Must contain 1 to 128 Unicode characters. |
Tenant |
Required setting. The name of the tenant that owns the resource. |
Type |
Required setting, available if KUMA is integrated with Kaspersky Security Center. Response rule type, ksctasks. |
Kaspersky Security Center task |
Required setting. Name of the Kaspersky Security Center task to run. Tasks must be created beforehand, and their names must begin with " You can use KUMA to run the following types of Kaspersky Security Center tasks:
|
Event field |
Required setting. Defines the event field of the asset for which the Kaspersky Security Center task should be started. Possible values:
|
Workers |
The number of processes that the service can run simultaneously. By default, the number of workers is the same as the number of virtual processors on the server where the service is installed. |
Description |
Description of the response rule. You can add up to 4,000 Unicode characters. |
Filter |
Used to define the conditions for the events to be processed using the response rule. You can select an existing filter from the drop-down list or create a new filter. Creating a filter in resources
|
To send requests to Kaspersky Security Center, you must ensure that Kaspersky Security Center is available over the UDP protocol.
If a response rule is owned by the shared tenant, the displayed Kaspersky Security Center tasks that are available for selection are from the Kaspersky Security Center server that the main tenant is connected to.
If a response rule has a selected task that is absent from the Kaspersky Security Center server that the tenant is connected to, the task is not performed for assets of this tenant. This situation could arise when two tenants are using a common correlator, for example.
Page topResponse rules for a custom script
You can create a script containing commands to be executed on the KUMA server when selected events are detected and configure response rules to automatically run this script. In this case, the program will run the script when it receives events that match the response rules.
The script file is stored on the server where the correlator service using the response resource is installed: /opt/kaspersky/kuma/correlator/<Correlator ID>/scripts. The kuma user of this server requires the permissions to run the script.
When creating and editing response rules for a custom script, you need to define values for the following parameters.
Response rule settings
Setting |
Description |
|---|---|
Name |
Required setting. Unique name of the resource. Must contain 1 to 128 Unicode characters. |
Tenant |
Required setting. The name of the tenant that owns the resource. |
Type |
Required setting. Response rule type, script. |
Timeout |
The number of seconds allotted for the script to finish. If this amount of time is exceeded, the script is terminated. |
Script name |
Required setting. Name of the script file. If the response resource is attached to the correlator service but there is no script file in the /opt/kaspersky/kuma/correlator/<Correlator ID>/scripts folder, the correlator will not work. |
Script arguments |
Arguments or event field values that must be passed to the script. If the script includes actions taken on files, you should specify the absolute path to these files. Parameters can be written with quotation marks ("). Event field names are passed in the Example: |
Workers |
The number of processes that the service can run simultaneously. By default, the number of workers is the same as the number of virtual processors on the server where the service is installed. |
Description |
Description of the resource. You can add up to 4,000 Unicode characters. |
Filter |
Used to define the conditions for the events to be processed using the response rule. You can select an existing filter from the drop-down list or create a new filter. Creating a filter in resources
|
Response rules for KICS for Networks
You can configure response rules to automatically trigger response actions on KICS for Networks assets. For example, you can change the asset status in KICS for Networks.
When creating and editing response rules for KICS for Networks, you need to define values for the following settings.
Response rule settings
Setting |
Description |
|---|---|
Name |
Required setting. Unique name of the resource. Must contain 1 to 128 Unicode characters. |
Tenant |
Required setting. The name of the tenant that owns the resource. |
Type |
Required setting. Response rule type, kics. |
Event field |
Required setting. Specifies the event field for the asset for which response actions must be performed. Possible values:
|
KICS for Networks task |
Response action to be performed when data is received that matches the filter. The following types of response actions are available:
When a response rule is triggered, KUMA will send KICS for Networks an API request to change the status of the specified device to Authorized or Unauthorized. |
Workers |
The number of processes that the service can run simultaneously. By default, the number of workers is the same as the number of virtual processors on the server where the service is installed. |
Description |
Description of the resource. You can add up to 4,000 Unicode characters. |
Filter |
Used to define the conditions for the events to be processed using the response rule. You can select an existing filter from the drop-down list or create a new filter. Creating a filter in resources
|
Response rules for Kaspersky Endpoint Detection and Response
You can configure response rules to automatically trigger response actions on Kaspersky Endpoint Detection and Response assets. For example, you can configure automatic asset network isolation.
When creating and editing response rules for Kaspersky Endpoint Detection and Response, you need to define values for the following settings.
Response rule settings
Setting |
Description |
|---|---|
Event field |
Required setting. Specifies the event field for the asset for which response actions must be performed. Possible values:
|
Task type |
Response action to be performed when data is received that matches the filter. The following types of response actions are available:
At least one of the above fields must be completed.
All of the listed operations can be performed on assets that have Kaspersky Endpoint Agent for Windows. On assets that have Kaspersky Endpoint Agent for Linux, the program can only be started. At the software level, the capability to create prevention rules and network isolation rules for assets with Kaspersky Endpoint Agent for Linux is unlimited. KUMA and Kaspersky Endpoint Detection and Response do not provide any notifications about unsuccessful application of these rules. |
Workers |
The number of processes that the service can run simultaneously. By default, the number of workers is the same as the number of virtual processors on the server where the service is installed. |
Description |
Description of the response rule. You can add up to 4,000 Unicode characters. |
Filter |
Used to define the conditions for the events to be processed using the response rule. You can select an existing filter from the drop-down list or create a new filter. Creating a filter in resources
|
Active Directory response rules
Active Directory response rules define the actions to be applied to an account if a rule is triggered.
When creating and editing response rules using Active Directory, specify the values for the following settings.
Response rule settings
Setting |
Description |
|---|---|
Name |
Required setting. Unique name of the resource. Must contain 1 to 128 Unicode characters. |
Tenant |
Required setting. The name of the tenant that owns the resource. |
Type |
Required setting. Response rule type, Response via Active Directory. |
Account ID source |
Event field from which the Active Directory account ID value is taken. Possible values:
|
AD command |
Command that is applied to the account when the response rule is triggered. Available values:
If your Active Directory domain allows selecting the User cannot change password check box, resetting the user account password as a response will result in a conflict of requirements for the user account: the user will not be able to authenticate. The domain administrator will need to clear one of the check boxes for the affected user account: User cannot change password or User must change password at next logon.
|
Filter |
Used to define the conditions for the events to be processed using the response rule. You can select an existing filter from the drop-down list or create a new filter. Creating a filter in resources
|
Notification templates
Notification templates are used in alert generation notifications.
Notification template settings
Setting |
Description |
|---|---|
Name |
Required setting. Unique name of the resource. Must contain 1 to 128 Unicode characters. |
Tenant |
Required setting. The name of the tenant that owns the resource. |
Subject |
Subject of the email containing the notification about the alert generation. In the email subject, you can refer to the alert fields. Example: |
Template |
Required setting. The body of the email containing the notification about the alert generation. The template supports a syntax that can be used to populate the notification with data from the alert. You can read more about the syntax in the official Go language documentation. For convenience, you can open the email in a separate window by clicking the |
 icon. This opens the
 Predefined notification templates.
The notification templates listed in the table below are included in the KUMA distribution kit.
Predefined notification templates.
Template name |
Description |
[OOTB] New alert in KUMA |
Basic notification template. |
Functions in notification templates
Functions available in templates are listed in the table below.
Functions in templates
Setting |
Description |
|---|---|
|
Takes the time in milliseconds (unix time) as the first parameter; the second parameter can be used to pass the time in RFC standard format. The time zone cannot be changed. Example call: Call result: 18 Nov 2022 13:46 Examples of date formats supported by the function:
|
|
The function is called inside the range function to limit the list of data. It processes lists that do not have keys, takes any list of data as the first parameter and truncates it based on the second value. For example, the Example call:
|
|
Generates a link to the alert with the URL specified in the SMTP server connection settings as the KUMA Core server alias or with the real URL of the KUMA Core service if no alias is defined. Example call:
|
|
Takes the form of a link that can be followed. Example call:
|
Notification template syntax
In a template, you can query the alert fields containing a string or number:
|
The message will display the alert name, which is the contents of the CorrelationRuleName field.
Some alert fields contain data arrays. For instance, these include alert fields containing related events, assets, and user accounts. Such nested objects can be queried by using the range function, which sequentially queries the fields of the first 50 nested objects. When using the range function to query a field that does not contain a data array, an error is returned. Example:
|
The message will display the values of the DeviceHostName and CreatedAt fields from 50 assets related to the alert:
|
You can use the limit parameter to limit the number of objects returned by the range function:
|
The message will display the values of the DisplayName and CreatedAt fields from 5 assets related to the alert, with the words "Devices" and "Creation date" marked with HTML tag <strong>:
|
Nested objects can have their own nested objects. They can be queried by using nested range functions:
|
The message will show ten service IDs (ServiceID field) from the base events related to five correlation events of the alert. 50 strings total. Please note that events are queried through the nested EventWrapper structure, which is located in the Events field in the alert. Events are available in the Event field of this structure, which is reflected in the example above. Therefore, if field A contains nested structure [B] and structure [B] contains field C, which is a string or a number, you must specify the path {{ A.C }} to query field C.
Some object fields contain nested dictionaries in key-value format (for example, the Extra event field). They can be queried by using the range function with the variables passed to it: range $placeholder1, $placeholder2 := .FieldName. The values of variables can then be called by specifying their names. Example:
|
The message will use an HTML tag<br> to show key-value pairs from the Extra fields of the base events belonging to the correlation events. Data is called from five base events out of each of the three correlation events.
You can use HTML tags in notification templates to create more complex structures. Below is an example table for correlation event fields:
|
Use the link_alert function to insert an HTML alert link into the notification email:
|
A link to the alert window will be displayed in the message.
Below is an example of how you can extract the data on max asset category from the alert data and place it in the notifications:
|
Connectors
Connectors are used for establishing connections between KUMA services and receiving events actively and passively.
The program has the following connector types available:
- internal—used for establishing connections between the KUMA services.
- tcp—used to receive data over TCP passively. Available for Windows and Linux agents.
- udp—used to receive data over UDP passively. Available for Windows and Linux agents.
- netflow—used to passively receive events in the NetFlow format.
- sflow—used to passively receive events in the SFlow format.
- nats-jetstream—used for communication with the NATS message broker. Available for Windows and Linux agents.
- kafka—used for communication with the Apache Kafka data bus. Available for Windows and Linux agents.
- http—used for receiving events over HTTP. Available for Windows and Linux agents.
- sql—used for selecting data from a database.
The program supports the following types of SQL databases:
- SQLite.
- MSSQL.
- MySQL.
- PostgreSQL.
- Cockroach.
- Oracle.
- Firebird.
- file—used to retrieve data from a text file. Available for Linux agents.
- 1c-log and 1c-xml are used to receive data from 1C logs. Available for Linux agents.
- diode—used for unidirectional data transfer in industrial ICS networks using data diodes.
- ftp—used to receive data over the File Transfer Protocol. Available for Windows and Linux agents.
- nfs—used to receive data over the Network File System protocol. Available for Windows and Linux agents.
- wmi—used to obtain data using Windows Management Instrumentation. Available for Windows agents.
- wec—used to receive data using Windows Event Forwarding (WEF) and Windows Event Collector (WEC), or local operating system logs of a Windows host. Available for Windows agents.
- snmp—used to receive data using the Simple Network Management Protocol. Available for Windows and Linux agents.
- snmp-trap—used to receive data using Simple Network Management Protocol traps (SNMP traps). Available for Windows and Linux agents.
Viewing connector settings
To view connector settings:
- In the KUMA web interface, select Resources → Connectors.
- In the folder structure, select the folder containing the relevant connector.
- Select the connector whose settings you want to view.
The settings of connectors are displayed on two tabs: Basic settings and Advanced settings. For a detailed description of each connector settings, please refer to the Connector settings section.
Page topAdding a connector
You can enable the display of non-printing characters for all entry fields except the Description field.
To add a connector:
- In the KUMA web interface, select Resources → Connectors.
- In the folder structure, select the folder in which you want the connector to be located.
Root folders correspond to tenants. To make a connector available to a specific tenant, the resource must be created in the folder of that tenant.
If the required folder is absent from the folder tree, you need to create it.
By default, added connectors are created in the Shared folder.
- Click the Add connector button.
- Define the settings for the selected connector type.
The settings that you must specify for each type of connector are provided in the Connector settings section.
- Click the Save button.
Connector settings
This section describes the settings of all connector types supported by KUMA.
Internal type
When creating this type of connector, you need to define values for the following settings:
Basic settings tab:
- Name (required)—a unique name for this type of resource. Must contain 1 to 128 Unicode characters.
- Tenant (required)—name of the tenant that owns the resource.
- Type (required)—connector type, internal.
- URL (required)—URL that you need to connect to.
- Available formats: hostname:port, IPv4:port, IPv6:port, :port.
- Description—resource description: up to 4,000 Unicode characters.
Advanced settings tab:
- Debug—a drop-down list where you can specify whether resource logging should be enabled.
By default it is Disabled.
Tcp type
When creating this type of connector, you need to define values for the following settings:
Basic settings tab:
- Name (required)—a unique name for this type of resource. Must contain 1 to 128 Unicode characters.
- Tenant (required)—name of the tenant that owns the resource.
- Type (required)—connector type, tcp.
- URL (required)—URL that you need to connect to. Available formats: hostname:port, IPv4:port, IPv6:port, :port.
- Delimiter is used to specify a character representing the delimiter between events. Available values:
\n,\t,\0. If no separator is specified (an empty value is selected), the default value is\n. - Description—resource description: up to 4,000 Unicode characters.
Advanced settings tab:
- Buffer size is used to set a buffer size for the connector. The default value is 1 MB, and the maximum value is 64 MB.
- Character encoding setting specifies character encoding. The default value is
UTF-8. - TLS mode—TLS encryption mode using certificates in PEM x509 format:
- Disabled (default)—do not use TLS encryption.
- Enabled—use encryption without certificate verification.
- With verification—use encryption with verification that the certificate was signed with the KUMA root certificate. The root certificate and key of KUMA are created automatically during program installation and are stored on the KUMA Core server in the folder /opt/kaspersky/kuma/core/certificates/.
- Custom PFX – use encryption. When this option is selected, a certificate must be generated with a private key in PKCS#12 container format in an external Certificate Authority. Then the certificate must be exported from the key store and uploaded to the KUMA web interface as a PFX secret. Add PFX secret.
- If you previously uploaded a PFX certificate, select it from the Secret drop-down list.
If no certificate was previously added, the drop-down list shows No data.
- If you want to add a new certificate, click the
 button on the right of the Secret list.
The Secret window opens.
- In the Name field, enter the name that will be used to display the secret in the list of available secrets.
- Click the Upload PFX button to select the file containing your previously exported certificate with a private key in PKCS#12 container format.
- In the Password field, enter the certificate security password that was set in the Certificate Export Wizard.
- Click the Save button.
The certificate will be added and displayed in the Secret list.
When using TLS, it is impossible to specify an IP address as a URL.
- If you previously uploaded a PFX certificate, select it from the Secret drop-down list.
- Compression—you can use Snappy compression. By default, compression is disabled.
- Debug—a drop-down list where you can specify whether resource logging should be enabled. By default it is Disabled.
Udp type
When creating this type of connector, you need to define values for the following settings:
Basic settings tab:
- Name (required)—a unique name for this type of resource. Must contain 1 to 128 Unicode characters.
- Tenant (required)—name of the tenant that owns the resource.
- Type (required)—connector type, udp.
- URL (required)—URL that you need to connect to. Available formats: hostname:port, IPv4:port, IPv6:port, :port.
- Delimiter is used to specify a character representing the delimiter between events. Available values:
\n,\t,\0. If no separator is specified (an empty value is selected), events are not separated. - Description—resource description: up to 4,000 Unicode characters.
Advanced settings tab:
- Buffer size is used to set a buffer size for the connector. The default value is 16 KB, and the maximum value is 64 KB.
- Workers—used to set worker count for the connector. The default value is 1.
- Character encoding setting specifies character encoding. The default value is
UTF-8. - Compression—you can use Snappy compression. By default, compression is disabled.
- Debug—a drop-down list where you can specify whether resource logging should be enabled. By default it is Disabled.
Netflow type
When creating this type of connector, you need to define values for the following settings:
- Basic settings tab:
- Name (required)—a unique name for this type of resource. Must contain 1 to 128 Unicode characters.
- Tenant (required)—name of the tenant that owns the resource.
- Type (required)—connector type, netflow.
- URL (required)—URL that you need to connect to.
- Description—resource description: up to 4,000 Unicode characters.
- Advanced settings tab:
- Buffer size is used to set a buffer size for the connector. The default value is 16 KB, and the maximum value is 64 KB.
- Workers—used to set worker count for the connector. The default value is 1.
- Character encoding setting specifies character encoding. The default value is
UTF-8. - Debug—a drop-down list where you can specify whether resource logging should be enabled. By default it is Disabled.
Sflow type
When creating this type of connector, you need to define values for the following settings:
Basic settings tab:
- Name (required)—a unique name for this type of resource. Must contain 1 to 128 Unicode characters.
- Tenant (required)—name of the tenant that owns the resource.
- Type (required)—connector type, sflow.
- URL (required)—a URL that you need to connect to. Available formats: hostname:port, IPv4:port, IPv6:port, :port.
- Description—resource description: up to 4,000 Unicode characters.
Advanced settings tab:
- Buffer size is used to set a buffer size for the connector. The default value is 1 MB, and the maximum value is 64 MB.
- Workers—used to set the amount of workers for a connector. The default value is 1.
- Character encoding setting specifies character encoding. The default value is
UTF-8. - Debug—drop-down list that lets you enable resource logging. By default it is Disabled.
nats-jetstream type
When creating this type of connector, you need to define values for the following settings:
Basic settings tab:
- Name (required)—a unique name for this type of resource. Must contain 1 to 128 Unicode characters.
- Tenant (required)—name of the tenant that owns the resource.
- Type (required)—connector type, nats-jetstream.
- URL (required)—URL that you need to connect to.
- Topic (required)—the topic for NATS messages. Must contain Unicode characters.
- Delimiter is used to specify a character representing the delimiter between events. Available values:
\n,\t,\0. If no separator is specified (an empty value is selected), events are not separated. - Description—resource description: up to 4,000 Unicode characters.
Advanced settings tab:
- Buffer size is used to set a buffer size for the connector. The default value is 16 KB, and the maximum value is 64 KB.
- GroupID—the GroupID parameter for NATS messages. Must contain 1 to 255 Unicode characters. The default value is
default. - Workers—used to set worker count for the connector. The default value is 1.
- Character encoding setting specifies character encoding. The default value is
UTF-8. - Cluster ID is the ID of the NATS cluster.
- TLS mode specifies whether TLS encryption is used:
- Disabled (default)—do not use TLS encryption.
- Enabled—use encryption without certificate verification.
- With verification—use encryption with verification that the certificate was signed with the KUMA root certificate. The root certificate and key of KUMA are created automatically during program installation and are stored on the KUMA Core server in the folder /opt/kaspersky/kuma/core/certificates/.
- Custom CA—use encryption with verification that the certificate was signed by a Certificate Authority. The secret containing the certificate is selected from the Custom CA drop-down list, which is displayed when this option is selected.
Creating a certificate signed by a Certificate Authority
When using TLS, it is impossible to specify an IP address as a URL.
To use KUMA certificates on third-party devices, you must change the certificate file extension from CERT to CRT. Otherwise, error x509: certificate signed by unknown authority may be returned.
- Compression—you can use Snappy compression. By default, compression is disabled.
- Debug—a drop-down list where you can specify whether resource logging should be enabled. By default it is Disabled.
Kafka type
When creating this type of connector, you need to define values for the following settings:
Basic settings tab:
- Name (required)—a unique name for this type of resource. Must contain 1 to 128 Unicode characters.
- Tenant (required)—name of the tenant that owns the resource.
- Type (required)—connector type, kafka.
- URL—URL that you need to connect to. Available formats: hostname:port, IPv4:port, IPv6:port.
- Topic—subject of Kafka messages. Must contain from 1 to 255 of the following characters: a–z, A–Z, 0–9, ".", "_", "-".
- Authorization—requirement for Agents to complete authorization when connecting to the connector:
- disabled (by default).
- PFX.
When this option is selected, a certificate must be generated with a private key in PKCS#12 container format in an external Certificate Authority. Then the certificate must be exported from the key store and uploaded to the KUMA web interface as a PFX secret.
- If you previously uploaded a PFX certificate, select it from the Secret drop-down list.
If no certificate was previously added, the drop-down list shows No data.
- If you want to add a new certificate, click the button on the right of the Secret list.
The Secret window opens.
- In the Name field, enter the name that will be used to display the secret in the list of available secrets.
- Click the Upload PFX button to select the file containing your previously exported certificate with a private key in PKCS#12 container format.
- In the Password field, enter the certificate security password that was set in the Certificate Export Wizard.
- Click the Save button.
The certificate will be added and displayed in the Secret list.
- If you previously uploaded a PFX certificate, select it from the Secret drop-down list.
- plain.
If this option is selected, you must indicate the secret containing user account credentials for authorization when connecting to the connector.
- If you previously created a secret, select it from the Secret drop-down list.
If no secret was previously added, the drop-down list shows No data.
- If you want to add a new secret, click the button on the right of the Secret list.
The Secret window opens.
- In the Name field, enter the name that will be used to display the secret in the list of available secrets.
- In the User and Password fields, enter the credentials of the user account that the Agent will use to connect to the connector.
- If necessary, add any other information about the secret in the Description field.
- Click the Save button.
The secret will be added and displayed in the Secret list.
- If you previously created a secret, select it from the Secret drop-down list.
- GroupID—the GroupID parameter for Kafka messages. Must contain from 1 to 255 of the following characters: a–z, A–Z, 0–9, ".", "_", "-".
- Description—resource description: up to 4,000 Unicode characters.
Advanced settings tab:
- Size of message to fetch—should be specified in bytes. The default value is 16 MB.
- Maximum fetch wait time—timeout for a message of the defined size. The default value is 5 seconds.
- Character encoding setting specifies character encoding. The default value is
UTF-8. - TLS mode specifies whether TLS encryption is used:
- Disabled (default)—do not use TLS encryption.
- Enabled—use encryption without certificate verification.
- With verification—use encryption with verification that the certificate was signed with the KUMA root certificate. The root certificate and key of KUMA are created automatically during program installation and are stored on the KUMA Core server in the folder /opt/kaspersky/kuma/core/certificates/.
- Custom CA—use encryption with verification that the certificate was signed by a Certificate Authority. The secret containing the certificate is selected from the Custom CA drop-down list, which is displayed when this option is selected.
Creating a certificate signed by a Certificate Authority
When using TLS, it is impossible to specify an IP address as a URL.
To use KUMA certificates on third-party devices, you must change the certificate file extension from CERT to CRT. Otherwise, error x509: certificate signed by unknown authority may be returned.
- Debug—a drop-down list where you can specify whether resource logging should be enabled. By default it is Disabled.
Http type
When creating this type of connector, you need to define values for the following settings:
- Basic settings tab:
- Name (required)—a unique name for this type of resource. Must contain 1 to 128 Unicode characters.
- Tenant (required)—name of the tenant that owns the resource.
- Type (required)—connector type, http.
- URL (required)—URL that you need to connect to. Available formats: hostname:port, IPv4:port, IPv6:port, :port.
- Delimiter is used to specify a character representing the delimiter between events. Available values:
\n,\t,\0. If no separator is specified (an empty value is selected), events are not separated. - Description—resource description: up to 4,000 Unicode characters.
- Advanced settings tab:
- Character encoding setting specifies character encoding. The default value is
UTF-8. - TLS mode specifies whether TLS encryption is used:
- Disabled (default)—do not use TLS encryption.
- Enabled—encryption is enabled, but without verification.
- With verification—use encryption with verification that the certificate was signed with the KUMA root certificate. The root certificate and key of KUMA are created automatically during program installation and are stored on the KUMA Core server in the folder /opt/kaspersky/kuma/core/certificates/.
When using TLS, it is impossible to specify an IP address as a URL.
- Proxy—a drop-down list where you can select a proxy server resource.
- Debug—a drop-down list where you can specify whether resource logging should be enabled. By default it is Disabled.
- Character encoding setting specifies character encoding. The default value is
Sql type
KUMA supports multiple types of databases.
When creating a connector, you must specify general connector settings and specific database connection settings.
On the Basic settings tab, you must specify the following values for the connector:
- Name (required)—unique name of the resource. Must contain 1 to 128 Unicode characters.
- Type (required)—connector type, sql.
- Tenant (required)—name of the tenant that owns the resource.
- Default query (required)—SQL query that is executed when connecting to the database.
- Reconnect to the database every time a query is sent — the check box is cleared by default.
- Poll interval, sec —interval for executing SQL queries. This value is specified in seconds. The default value is 10 seconds.
- Description—resource description: up to 4,000 Unicode characters.
To connect to the database, you need to define the values of the following settings on the Basic settings tab:
- URL (required)—secret that stores a list of URLs for connecting to the database.
If necessary, you can edit or create a secret.
- Click the
 button.
The secret window is displayed.
- Define the values for the following settings:
- Name—the name of the added secret.
- Type—urls.
This value is set by default and cannot be changed.
- URL—URL of the database.
You must keep in mind that each type of database uses its own URL format for connections.
Available URL formats are as follows:
- For SQLite:
sqlite3://file:<file_path>
A question mark (?) is used as a placeholder.
- For MSSQL:
sqlserver://<user>:<password>@<server:port>/<instance_name>?database=<database>(recommended)sqlserver://<user>:<password>@<server>?database=<database>&encrypt=disable
The characters @p1 are used as a placeholder.
- For MySQL:
mysql://<user>:<password>@tcp(<server>:<port>)/<database>
The characters %s are used as a placeholder.
- For PostgreSQL:
postgres://<user>:<password>@<server>/<database>?sslmode=disable
The characters $1 are used as a placeholder.
- For Cockroach:
postgres://<user>:<password>@<server>:<port>/<database>?sslmode=disable
The characters $1 are used as a placeholder.
- For Firebird:
firebirdsql://<user>:<password>@<server>:<port>/<database>
A question mark (?) is used as a placeholder.
- For SQLite:
- Description—any additional information.
- If necessary, click Add and specify an additional URL.
In this case, if one URL is not available, the program connects to the next URL specified in the list of addresses.
- Click the Save button.
- Click the
 button.
The secret window is displayed.
- Specify the values for the settings that you want to change.
You can change the following values:
- Name—the name of the added secret.
- URL—URL of the database.
You must keep in mind that each type of database uses its own URL format for connections.
Available URL formats are as follows:
- For SQLite:
sqlite3://file:<file_path>
A question mark (?) is used as a placeholder.
- For MSSQL:
sqlserver://<user>:<password>@<server:port>/<instance_name>?database=<database>(recommended)sqlserver://<user>:<password>@<server>?database=<database>&encrypt=disable
The characters @p1 are used as a placeholder.
- For MySQL:
mysql://<user>:<password>@tcp(<server>:<port>)/<database>
The characters
?are used as placeholders. - For PostgreSQL:
postgres://<user>:<password>@<server>/<database>?sslmode=disable
The characters $1 are used as a placeholder.
- For Cockroach:
postgres://<user>:<password>@<server>:<port>/<database>?sslmode=disable
The characters $1 are used as a placeholder.
- For Firebird:
firebirdsql://<user>:<password>@<server>:<port>/<database>
A question mark (?) is used as a placeholder.
- For SQLite:
- Description—any additional information.
- If necessary, click Add and specify an additional URL.
In this case, if one URL is not available, the program connects to the next URL specified in the list of addresses.
- Click the Save button.
When creating connections, strings containing account credentials with special characters may be incorrectly processed. If an error occurs when creating a connection but you are sure that the settings are correct, enter the special characters in percent encoding.
- Click the
- Identity column (required)—name of the column that contains the ID for each row of the table.
- Identity seed (required)—identity column value that will be used to determine the specific line to start reading data from the SQL table.
- Query—field for an additional SQL query. The query indicated in this field is performed instead of the default query.
- Poll interval, sec —interval for executing SQL queries. The interval defined in this field replaces the default interval for the connector.
This value is specified in seconds. The default value is 10 seconds.
On the Advanced settings tab, you need to specify the following settings for the connector:
- Character encoding—the specific encoding of the characters. The default value is
UTF-8.KUMA converts SQL responses to UTF-8 encoding. You can configure the SQL server to send responses in UTF-8 encoding or change the encoding of incoming messages on the KUMA side.
- Debug—a drop-down list where you can specify whether resource logging should be enabled. By default it is Disabled.
Within a single connector, you can create a connection for multiple supported databases.
Supported SQL types and their specific usage features
The UNION operator is not supported by the SQL Connector resources.
The following SQL types are supported:
- MSSQL
Example URLs:
sqlserver://{user}:{password}@{server:port}/{instance_name}?database={database}– (recommended option)sqlserver://{user}:{password}@{server}?database={database}
The characters
@p1are used as a placeholder in the SQL query.If you need to connect using domain account credentials, specify the account name in
<domain>%5C<user>format. For example:sqlserver://domain%5Cuser:password@ksc.example.com:1433/SQLEXPRESS?database=KAV. - MySQL
Example URL:
mysql://{user}:{password}@tcp({server}:{port})/{database}The characters
?are used as placeholders in the SQL query. - PostgreSQL
Example URL:
postgres://{user}:{password}@{server}/{database}?sslmode=disableThe characters
$1are used as a placeholder in the SQL query. - CockroachDB
Example URL:
postgres://{user}:{password}@{server}:{port}/{database}?sslmode=disableThe characters
$1are used as a placeholder in the SQL query. - SQLite3
Example URL:
sqlite3://file:{file_path}A question mark (
?) is used as a placeholder in the SQL query.When querying SQLite3, if the initial value of the ID is in datetime format, you must add a date conversion with the sqlite datetime function to the SQL query. For example: select * from connections where datetime(login_time) > datetime(?, 'utc') order by login_time. In this example,
connectionsis the SQLite table, and the value of the variable?is taken from the Identity seed field, and it must be specified in the {date}T{time}Z format (for example, 2021-01-01T00:10:00Z). - Oracle DB
In version 2.1.3 or later, KUMA uses a new driver for connecting to oracle. When upgrading, KUMA renames the connection secret to 'oracle-deprecated' and the connector continues to work. If no events are received after starting the collector with the 'oracle-deprecated' driver type, create a new secret with the 'oracle' driver and use it for connecting.
We recommend using the new driver.
Example URL of a secret with the new 'oracle' driver:
oracle://{user}:{password}@{server}:{port}/{service_name}
oracle://{user}:{password}@{server}:{port}/?SID={SID_VALUE}
Example URL of a secret with the legacy 'oracle-deprecated' driver:
oracle-deprecated://{user}/{password}@{server}:{port}/{service_name}
The
:valSQL variable is used as a placeholder in.When accessing Oracle DB, if the initial ID value is used in the datetime format, you must consider the type of the field in the database itself and, if necessary, add conversions of the time string in the query to ensure correct operation of the sql connector. For example, if the Connections table in the database has a login_time field, the following conversions are possible:
- If the login_time field has the TIMESTAMP type, then depending on the database settings, the login_time field may contain a value in the YYYY-MM-DD HH24:MI:SS format (for example, 2021-01-01 00:00:00). Then, in the Identity seed field, specify 2021-01-01T00:00:00Z, and perform the conversion in the query using the to_timestamp function. For example:
select * from connections where login_time > to_timestamp(:val, 'YYYY-MM-DD"T"HH24:MI:SS"Z"') - If the login_time field has the TIMESTAMP type, then depending on the database settings, the login_time field may contain a value in the YYYY-MM-DD"T"HH24:MI:SSTZH:TZM format (for example, 2021-01-01T00:00:00+03:00). Then, in the Identity seed field, specify 2021-01-01T00:00:00+03:00, and perform the conversion in the query using the to_timestamp_tz function. For example:
select * from connections_tz where login_time > to_timestamp_tz(:val, 'YYYY-MM-DD"T"HH24:MI:SSTZH:TZM')For more details about the to_timestamp and to_timestamp_tz functions, refer to the official Oracle documentation.
To interact with Oracle DB, you must install the libaio1 Astra Linux package.
- If the login_time field has the TIMESTAMP type, then depending on the database settings, the login_time field may contain a value in the YYYY-MM-DD HH24:MI:SS format (for example, 2021-01-01 00:00:00). Then, in the Identity seed field, specify 2021-01-01T00:00:00Z, and perform the conversion in the query using the to_timestamp function. For example:
- Firebird SQL
Example URL:
firebirdsql://{user}:{password}@{server}:{port}/{database}A question mark (
?) is used as a placeholder in the SQL query.If a problem occurs when connecting Firebird on Windows, use the full path to the database file. For example:
firebirdsql://{user}:{password}@{server}:{port}/C:\Users\user\firebird\db.FDB
A sequential request for database information is supported in SQL queries. For example, if you type select * from <name of data table> where id > <placeholder> in the Query field, the Identity seed field value will be used as the placeholder value the first time you query the table. In addition, the service that utilizes the SQL connector saves the ID of the last read entry, and the ID of this entry will be used as the placeholder value in the next query to the database.
File type
The file type is used to retrieve data from any text file. One string in a file is considered to be one event. Strings delimiter: \n. This type of connector is available for Linux Agents.
To set up file transfers from a Windows server for processing by the KUMA collector:
- On the Windows server, grant read access over the network to the folder with the files that you want processed.
- On the Linux server, mount the shared folder on the Windows server (see the list of supported operating systems).
- On the Linux server, install the collector that you want to process files from the mounted shared folder.
When creating this type of connector, you need to define values for the following settings:
- Basic settings tab:
- Name (required)—a unique name for this type of resource. Must contain 1 to 128 Unicode characters.
- Tenant (required)—name of the tenant that owns the resource.
- Type (required)—connector type, file.
- URL (required)—full path to the file that you need to interact with. For example,
/var/log/*som?[1-9].log.File and folder mask templates
- Description—resource description: up to 4,000 Unicode characters.
- Advanced settings tab:
- Character encoding setting specifies character encoding. The default value is
UTF-8. - Debug—a drop-down list where you can specify whether resource logging should be enabled. By default it is Disabled.
- Character encoding setting specifies character encoding. The default value is
Type 1c-xml
The 1c-xml type is used to retrieve data from 1C application registration logs. When the connector handles multi-line events, it converts them into single-line events. This type of connector is available for Linux Agents.
When creating this type of connector, specify values for the following settings:
- Basic settings tab:
- Name (required)—a unique name for this type of resource. Must contain 1 to 128 Unicode characters.
- Tenant (required)—name of the tenant that owns the resource.
- Type (required)—connector type, 1c-xml.
- URL (required)—full path to the directory containing files that you need to interact with. For example,
/var/log/1c/logs/. - Description—resource description: up to 4,000 Unicode characters.
- Advanced settings tab:
- Character encoding setting specifies character encoding. The default value is
UTF-8. - Debug—a drop-down list where you can specify whether resource logging should be enabled. By default it is Disabled.
- Character encoding setting specifies character encoding. The default value is
Connector operation diagram:
- The files containing 1C logs with the XML extension are searched within the specified directory. Logs are placed in the directory either manually or using an application written in the 1C language, for example, using the ВыгрузитьЖурналРегистрации() function. The connector only supports logs received this way. For more information on how to obtain 1C logs, see the official 1C documentation.
- Files are sorted by the last modification time in ascending order. All the files modified before the last read are discarded.
Information about processed files is stored in the file /<collector working directory>/1c_xml_connector/state.ini and has the following format: "offset=<number>\ndev=<number>\ninode=<number>".
- Events are defined in each unread file.
- Events from the file are processed one by one. Multi-line events are converted to single-line events.
Connector limitations:
- Installation of a collector with a 1c-xml connector is not supported in a Windows operating system. To set up file transfers of 1C log files for processing by the KUMA collector:
- On the Windows server, grant read access over the network to the folder with the 1C log files.
- On the Linux server, mount the shared folder with the 1C log files on the Windows server (see the list of supported operating systems).
- On the Linux server, install the collector that you want to process 1C log files files from the mounted shared folder.
- Files with an incorrect event format are not read. For example, if event tags in the file are in Russian, the collector does not read such events.
Example of a correct XML file with an event.
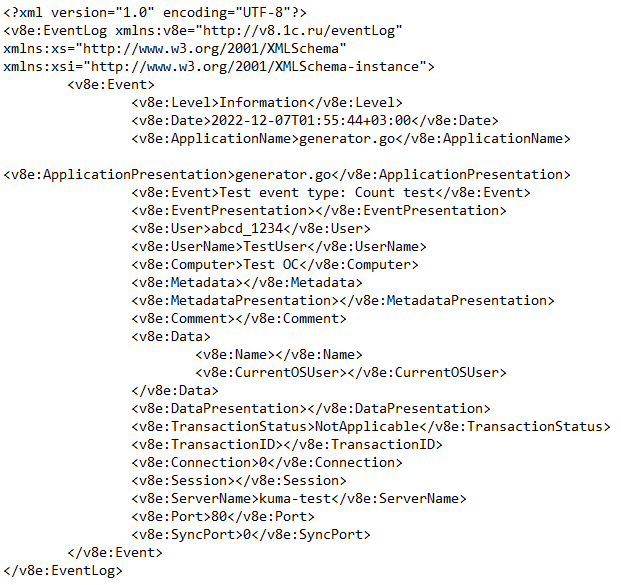
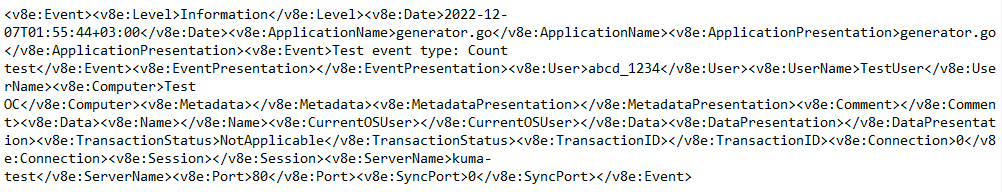
- If a file read by the connector is enriched with the new events and if this file is not the last file read in the directory, all events from the file are processed again.
Type 1c-log
The 1c-log type is used to retrieve data from 1C application technology logs. Strings delimiter: \n. The connector accepts only the first line from a multi-line event record. This type of connector is available for Linux Agents.
When creating this type of connector, specify values for the following settings:
- Basic settings tab:
- Name (required)—a unique name for this type of resource. Must contain 1 to 128 Unicode characters.
- Tenant (required)—name of the tenant that owns the resource.
- Type (required)—connector type, 1c-log.
- URL (required)—full path to the directory containing files that you need to interact with. For example,
/var/log/1c/logs/. - Description—resource description: up to 4,000 Unicode characters.
- Advanced settings tab:
- Character encoding setting specifies character encoding. The default value is
UTF-8. - Debug—a drop-down list where you can specify whether resource logging should be enabled. By default it is Disabled.
- Character encoding setting specifies character encoding. The default value is
Connector operation diagram:
- All 1C technology log files are searched.
Log file requirements:
- Files with the LOG extension are created in the log directory (
/var/log/1c/logs/by default) within a subdirectory for each process.Example of a supported 1C technology log structure
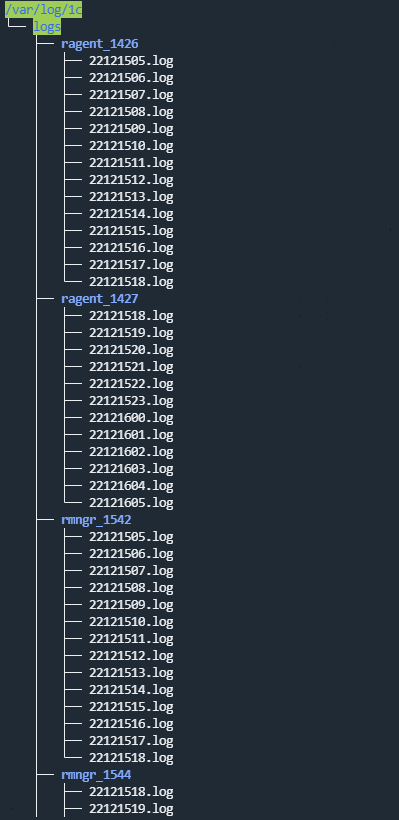
- Events are logged to a file for an hour; after that, the next log file is created.
- The file names have the following format:
<YY><MM><DD><HH>.log. For example,22111418.logis a file created in 2022, in the 11th month, on the 14th at 18:00. - Each event starts with the event time in the following format: <mm>:<ss>.<microseconds>-<duration_in_microseconds>.
- Files with the LOG extension are created in the log directory (
- The processed files are discarded.
Information about processed files is stored in the file /<collector working directory>/1c_log_connector/state.json.
- Processing of the new events starts, and the event time is converted to the RFC3339 format.
- The next file in the queue is processed.
Connector limitations:
- Installation of a collector with a 1c-log connector is not supported in a Windows operating system. To set up file transfers of 1C log files for processing by the KUMA collector:
- On the Windows server, grant read access over the network to the folder with the 1C log files.
- On the Linux server, mount the shared folder with the 1C log files on the Windows server (see the list of supported operating systems).
- On the Linux server, install the collector that you want to process 1C log files files from the mounted shared folder.
- Only the first line from a multi-line event record is processed.
- The normalizer processes only the following types of events:
- ADMIN
- ATTN
- CALL
- CLSTR
- CONN
- DBMSSQL
- DBMSSQLCONN
- DBV8DBENG
- EXCP
- EXCPCNTX
- HASP
- LEAKS
- LIC
- MEM
- PROC
- SCALL
- SCOM
- SDBL
- SESN
- SINTEG
- SRVC
- TLOCK
- TTIMEOUT
- VRSREQUEST
- VRSRESPONSE
Diode type
Used to transmit events using a data diode.
When creating this type of connector, you need to define values for the following settings:
- Basic settings tab:
- Name (required)—a unique name for this type of resource. Must contain 1 to 128 Unicode characters.
- Tenant (required)—name of the tenant that owns the resource.
- Type (required)—connector type, diode.
- Data diode destination directory (required)—full path to the KUMA collector server directory where the data diode moves files containing events from the isolated network segment. After the connector has read these files, the files are deleted from the directory. The path can contain up to 255 Unicode characters.
- Delimiter is used to specify a character representing the delimiter between events. Available values:
\n,\t,\0. If no separator is specified (an empty value is selected), the default value is\n.This setting must match for the connector and destination resources used to relay events from an isolated network segment via the data diode.
- Description—resource description: up to 4,000 Unicode characters.
- Advanced settings tab:
- Workers—the number of services processing the request queue. By default, this value is equal to the number of vCPUs of the KUMA Core server.
- Poll interval, sec —frequency at which the files are read from the directory containing events from the data diode. The default value is 2. The value is specified in seconds.
- Character encoding setting specifies character encoding. The default value is
UTF-8. - Compression—you can use Snappy compression. By default, compression is disabled.
This setting must match for the connector and destination resources used to relay events from an isolated network segment via the data diode.
- Debug—a drop-down list where you can specify whether resource logging should be enabled. By default it is Disabled.
Ftp type
When creating this type of connector, you need to define values for the following settings:
- Basic settings tab:
- Name (required)—a unique name for this type of resource. Must contain 1 to 128 Unicode characters.
- Tenant (required)—name of the tenant that owns the resource.
- Type (required)—connector type, ftp.
- URL (required)—actual URL of the file or file mask beginning with 'ftp://'. For a file mask, you can use * ? [...].
If the URL does not include the FTP server port, port 21 is inserted.
- URL credentials—for specifying the user name and password for the FTP server. If there is no user name and password, the line remains empty.
- Description—resource description: up to 4,000 Unicode characters.
- Advanced settings tab:
- Character encoding setting specifies character encoding. The default value is
UTF-8. - Debug—a drop-down list where you can specify whether resource logging should be enabled. By default it is Disabled.
- Character encoding setting specifies character encoding. The default value is
Nfs type
When creating this type of connector, you need to define values for the following settings:
- Basic settings tab:
- Name (required)—a unique name for this type of resource. Must contain 1 to 128 Unicode characters.
- Tenant (required)—name of the tenant that owns the resource.
- Type (required)—connector type, nfs.
- URL (required)—path to the remote folder in the format nfs://host/path.
- File name mask (required)—mask used to filter files containing events. Use of masks is acceptable "
*", "?", "[...]". - Poll interval, sec—polling interval. The time interval after which files are re-read from the remote system. The value is specified in seconds. The default value is 0.
- Description—resource description: up to 4,000 Unicode characters.
- Advanced settings tab:
- Character encoding setting specifies character encoding. The default value is
UTF-8. - Debug—a drop-down list where you can specify whether resource logging should be enabled. By default it is Disabled.
- Character encoding setting specifies character encoding. The default value is
Wmi type
When creating this type of connector, you need to define values for the following settings:
- Basic settings tab:
- Name (required)—a unique name for this type of resource. Must contain 1 to 128 Unicode characters.
- Tenant (required)—name of the tenant that owns the resource.
- Type (required)—connector type, wmi.
- URL (required)—URL of the collector being created, for example:
kuma-collector.example.com:7221.The creation of a collector for receiving data using Windows Management Instrumentation results in the automatic creation of an agent that receives the necessary data on the remote device and forwards that data to the collector service. In the URL, you must specify the address of this collector. The URL is known in advance if you already know on which server you plan to install the service. However, this field can also be filled after the Installation Wizard is finished by copying the URL data from the Resources → Active services section.
- Description—resource description: up to 4,000 Unicode characters.
- Default credentials—drop-down list that does not require any value to be selected. The account credentials used to connect to hosts must be provided in the Remote hosts table (see below).
- The Remote hosts table lists the remote Windows assets that you can connect to. Available columns:
- Host (required) is the IP address or name of the device from which you want to receive data. For example, "machine-1".
- Domain (required)—name of the domain in which the remote device resides. For example, "example.com".
- Log type—drop-down list to select the name of the Windows logs that you need to retrieve. By default, only preconfigured logs are displayed in the list, but you can add custom logs to the list by typing their name in the Windows logs field and then pressing ENTER. KUMA service and resource configurations may require additional changes in order to process custom logs correctly.
Logs that are available by default:
- Application
- ForwardedEvents
- Security
- System
- HardwareEvents
If a WMI connection uses at least one log with an incorrect name, the agent that uses the connector does not receive events from all the logs within this connection, even if the names of other logs are specified correctly. The WMI agent connections for which all log names are specified correctly will work properly.
- Secret—account credentials for accessing a remote Windows asset with permissions to read the logs. If you leave this field blank, the credentials from the secret selected in the Default credentials drop-down list are used. The login in the secret must be specified without the domain. The domain value for access to the host is taken from the Domain column of the Remote hosts table.
You can select the secret resource from the drop-down list or create one using the
button. The selected secret can be changed by clicking on the button.
- Advanced settings tab:
- Character encoding setting specifies character encoding. The default value is
UTF-8. - Debug—a drop-down list where you can specify whether resource logging should be enabled. By default it is Disabled.
- Character encoding setting specifies character encoding. The default value is
Receiving events from a remote device
Conditions for receiving events from a remote Windows device hosting a KUMA agent:
- To start the KUMA agent on the remote device, you must use an account with the “Log on as a service” permissions.
- To receive events from the KUMA agent, you must use an account with Event Log Readers permissions. For domain servers, one such user account can be created so that a group policy can be used to distribute its rights to read logs to all servers and workstations in the domain.
- TCP ports 135, 445, and 49152–65535 must be opened on the remote Windows devices.
- You must run the following services on the remote machines:
- Remote Procedure Call (RPC)
- RPC Endpoint Mapper
Wec type
When creating this type of connector, you need to define values for the following settings:
- Basic settings tab:
- Name (required)—a unique name for this type of resource. Must contain 1 to 128 Unicode characters.
- Tenant (required)—name of the tenant that owns the resource.
- Type (required)—connector type, wec.
- URL (required)—URL of the collector being created, for example:
kuma-collector.example.com:7221.The creation of a collector for receiving data using Windows Event Collector results in the automatic creation of an agent that receives the necessary data on the remote device and forwards that data to the collector service. In the URL, you must specify the address of this collector. The URL is known in advance if you already know on which server you plan to install the service. However, this field can also be filled after the Installation Wizard is finished by copying the URL data from the Resources → Active services section.
- Description—resource description: up to 4,000 Unicode characters.
- Windows logs (required)—Select the names of the Windows logs you want to retrieve from this drop-down list. By default, only preconfigured logs are displayed in the list, but you can add custom logs to the list by typing their name in the Windows logs field and then pressing ENTER. KUMA service and resource configurations may require additional changes in order to process custom logs correctly.
Preconfigured logs:
- Application
- ForwardedEvents
- Security
- System
- HardwareEvents
If the name of at least one log is specified incorrectly, the agent using the connector does not receive events from any log, even if the names of other logs are correct.
- Advanced settings tab:
- Character encoding setting specifies character encoding. The default value is
UTF-8. - Debug—a drop-down list where you can specify whether resource logging should be enabled. By default it is Disabled.
- Character encoding setting specifies character encoding. The default value is
To start the KUMA agent on the remote device, you must use a service account with the “Log on as a service” permissions. To receive events from the operating system log, the service user account must also have Event Log Readers permissions.
You can create one user account with “Log on as a service” and “Event Log Readers” permissions, and then use a group policy to extend the rights of this account to read the logs to all servers and workstations in the domain.
We recommend that you disable interactive logon for the service account.
Page topSnmp type
To process events received via SNMP, you must use json normalizer.
It is available for Windows and Linux Agents. Supported protocol versions:
- snmpV1
- snmpV2
- snmpV3
When creating this type of connector, you need to define values for the following settings:
- Basic settings tab:
- Name (required)—a unique name for this type of resource. Must contain 1 to 128 Unicode characters.
- Tenant (required)—name of the tenant that owns the resource.
- Type (required)—connector type, snmp.
- SNMP version (required)—This drop-down list allows you to select the version of the protocol to use.
- Host (required)—hostname or its IP address. Available formats: hostname, IPv4, IPv6.
- Port (required)—port for connecting to the host. Typically 161 or 162 are used.
The SNMP version, Host and Port settings define one connection to a SNMP resource. You can create several such connections in one connector by adding new ones using the SNMP resource button. You can delete connections by using the
button.- Secret (required) is a drop-down list to select the secret which stores the credentials for connecting via the Simple Network Management Protocol. The secret type must match the SNMP version. If required, a secret can be created in the connector creation window using the button. The selected secret can be changed by clicking on the button.
- In the Source data table you can specify the rules for naming the received data, according to which OIDs, object identifiers, will be converted into keys with which the normalizer can interact. Available table columns:
- Parameter name (required)—an arbitrary name for the data type. For example, "Site name" or "Site uptime".
- OID (required)—a unique identifier that determines where to look for the required data at the event source. For example, "1.3.6.1.2.1.1.5".
- Key (required)—a unique identifier returned in response to a request to the asset with the value of the requested setting. For example, "sysName". This key can be accessed when normalizing data.
- Description—resource description: up to 4,000 Unicode characters.
- Advanced settings tab:
- Character encoding setting specifies character encoding. The default value is
UTF-8. - Debug—a drop-down list where you can specify whether resource logging should be enabled. By default it is Disabled.
- Character encoding setting specifies character encoding. The default value is
Snmp-trap type
The snmp-trap connector is used in agents and collectors to passively receive SNMP trap messages. The connector receives and prepares messages for normalization by mapping the SNMP object IDs to the temporary keys. Then the message is passed to the JSON normalizer, where the temporary keys are mapped to the KUMA fields and an event is generated.
To process events received via SNMP, you must use json normalizer.
It is available for Windows and Linux Agents. Supported protocol versions:
- snmpV1
- snmpV2
When creating this type of connector, you need to define values for the following settings:
- Basic settings tab:
- Name (required)—a unique name for this type of resource. Must contain 1 to 128 Unicode characters.
- Tenant (required)—name of the tenant that owns the resource.
- Type (required)—connector type, snmp-trap.
- SNMP version (required)—in this drop-down list, select the version of the protocol to be used: snmpV1 or snmpV2.
For example, Windows uses the snmpV2 version by default.
- URL (required) – URL where SNMP Trap messages will be expected. Available formats: hostname:port, IPv4:port, IPv6:port, :port.
The SNMP version and URL parameters define one connection used to receive SNMP Traps. You can create several such connections in one connector by adding new ones using the SNMP resource button. You can delete connections by using the
button.- In the Source data table, specify the rules for naming the received data, according to which OIDs (object identifiers) are converted to the keys with which the normalizer can interact.
When creating a connector, the table is pre-populated with examples of values of object identifiers and their keys. If more data needs to be determined and normalized in the incoming events, add to the table rows containing OID objects and their keys.
You can click Apply OIDs for WinEventLog to populate the table with mappings for OID values that arrive in WinEventLog logs.
Available table columns:
- Parameter name —an arbitrary name for the data type. For example, "
Site name" or "Site uptime". - OID (required)—a unique identifier that determines where to look for the required data at the event source. For example,
1.3.6.1.2.1.1.1. - Key (required)—a unique identifier returned in response to a request to the asset with the value of the requested setting. For example,
sysDescr. This key can be accessed when normalizing data.
Data is processed according to the allow list principle: objects that are not specified in the table are not sent to the normalizer for further processing.
- Parameter name —an arbitrary name for the data type. For example, "
- Description—resource description: up to 4,000 Unicode characters.
- Advanced settings tab:
- Character encoding setting specifies character encoding. The default value is
UTF-8. - Compression—you can use Snappy compression. By default, compression is disabled.
- Debug—a drop-down list where you can specify whether resource logging should be enabled. By default it is Disabled.
- Character encoding setting specifies character encoding. The default value is
Configuring the source of SNMP trap messages for Windows
Configuring a Windows device to send SNMP trap messages to the KUMA collector involves the following steps:
- Configuring and starting the SNMP and SNMP trap services
- Configuring the Event to Trap Translator service
Events from the source of SNMP trap messages must be received by the KUMA collector, which uses a connector of the snmp-trap type and a json normalizer.
To configure and start the SNMP and SNMP trap services in Windows 10:
- Open Settings → Apps → Apps and features → Optional features → Add feature → Simple Network Management Protocol (SNMP) and click Install.
- Wait for the installation to complete and restart your computer.
- Make sure that the SNMP service is running. If any of the following services are not running, enable them:
- Services → SNMP Service.
- Services → SNMP Trap.
- Right-click Services → SNMP Service, and in the context menu select Properties. Specify the following settings:
- On the Log On tab, select the Local System account check box.
- On the Agent tab, fill in the Contact (for example, specify
User-win10) and Location (for example, specifydetroit) fields. - On the Traps tab:
- In the Community Name field, enter community public and click Add to list.
- In the Trap destination field, click Add, specify the IP address or host of the KUMA server on which the collector that waits for SNMP events is deployed, and click Add.
- On the Security tab:
- Select the Send authentication trap check box.
- In the Accepted community names table, click Add, enter Community Name public and specify READ WRITE as the Community rights.
- Select the Accept SNMP packets from any hosts check box.
- Click Apply and confirm your selection.
- Right click Services → SNMP Service and select Restart.
To configure and start the SNMP and SNMP trap services in Windows XP:
- Open Start → Control Panel → Add or Remove Programs → Add / Remove Windows Components → Management and Monitoring Tools → Details.
- Select Simple Network Management Protocol and WMI SNMP Provider, and then click OK → Next.
- Wait for the installation to complete and restart your computer.
- Make sure that the SNMP service is running. If any of the following services are not running, enable them by setting the Startup type to Automatic:
- Services → SNMP Service.
- Services → SNMP Trap.
- Right-click Services → SNMP Service, and in the context menu select Properties. Specify the following settings:
- On the Log On tab, select the Local System account check box.
- On the Agent tab, fill in the Contact (for example, specify
User-win10) and Location (for example, specifydetroit) fields. - On the Traps tab:
- In the Community Name field, enter community public and click Add to list.
- In the Trap destination field, click Add, specify the IP address or host of the KUMA server on which the collector that waits for SNMP events is deployed, and click Add.
- On the Security tab:
- Select the Send authentication trap check box.
- In the Accepted community names table, click Add, enter Community Name public and specify READ WRITE as the Community rights.
- Select the Accept SNMP packets from any hosts check box.
- Click Apply and confirm your selection.
- Right click Services → SNMP Service and select Restart.
Changing the port for the SNMP trap service
You can change the SNMP trap service port if necessary.
To change the port of the SNMP trap service:
- Open the C:\Windows\System32\drivers\etc folder.
- Open the services file in Notepad as an administrator.
- In the service name section of the file, specify the snmp-trap connector port added to the KUMA collector for the SNMP trap service.
- Save the file.
- Open the Control Panel and select Administrative Tools → Services.
- Right-click SNMP Service and select Restart.
To configure the Event to Trap Translator service that translates Windows events to SNMP trap messages:
- In the command line, type
evntwinand press Enter. - Under Configuration type, select Custom, and click the Edit button.
- In the Event sources group of settings, use the Add button to find and add the events that you want to send to KUMA collector with the SNMP trap connector installed.
- Click the Settings button, in the opened window, select the Don't apply throttle check box, and click OK.
- Click Apply and confirm your selection.
Predefined connectors
The connectors listed in the table below are included in the KUMA distribution kit.
Predefined connectors
Connector name |
Comment |
[OOTB] Continent SQL |
Collects events from the database of the Continent hardware and software encryption system. To use it, you must configure the settings of the corresponding secret type. |
[OOTB] InfoWatch Trafic Monitor SQL |
Collects events from the database of the InfoWatch Traffic Monitor system. To use it, you must configure the settings of the corresponding secret type. |
[OOTB] KSC MSSQL |
Collects events from the MS SQL database of the Kaspersky Security Center system. To use it, you must configure the settings of the corresponding secret type. |
[OOTB] KSC MySQL |
Collects events from the MySQL database of the Kaspersky Security Center system. To use it, you must configure the settings of the corresponding secret type. |
[OOTB] KSC PostgreSQL |
Collects events from the PostgreSQL database of the Kaspersky Security Center 15.0 system. To use it, you must configure the settings of the corresponding secret type. |
[OOTB] Oracle Audit Trail SQL |
Collects audit events from the Oracle database. To use it, you must configure the settings of the corresponding secret type. |
[OOTB] SecretNet SQL |
Collects events from the SecretNet SQL database. To use it, you must configure the settings of the corresponding secret type. |
Secrets
Secrets are used to securely store sensitive information such as user names and passwords that must be used by KUMA to interact with external services. If a secret stores account data such as user login and password, when the collector connects to the event source, the account specified in the secret may be blocked in accordance with the password policy configured in the event source system.
Secrets can be used in the following KUMA services and features:
- Collector (when using TLS encryption).
- Connector (when using TLS encryption).
- Destinations (when using TLS encryption or authorization).
- Proxy servers.
Available settings:
- Name (required)—a unique name for this type of resource. Must contain 1 to 128 Unicode characters.
- Tenant (required)—name of the tenant that owns the resource.
- Type (required)—the type of secret.
When you select the type in the drop-down list, the parameters for configuring this secret type also appear. These parameters are described below.
- Description—up to 4,000 Unicode characters.
Depending on the secret type, different fields are available. You can select one of the following secret types:
- credentials—this type of secret is used to store account credentials required to connect to external services, such as SMTP servers. If you select this type of secret, you must fill in the User and Password fields. If the Secret resource uses the 'credentials' type to connect the collector to an event source, for example, a database management system, the account specified in the secret may be blocked in accordance with the password policy configured in the event source system.
- token—this secret type is used to store tokens for API requests. Tokens are used when connecting to IRP systems, for example. If you select this type of secret, you must fill in the Token field.
- ktl—this secret type is used to store Kaspersky Threat Intelligence Portal account credentials. If you select this type of secret, you must fill in the following fields:
- User and Password (required fields)—user name and password of your Kaspersky Threat Intelligence Portal account.
- PFX file (required)—lets you upload a Kaspersky Threat Intelligence Portal certificate key.
- PFX password (required)—the password for accessing the Kaspersky Threat Intelligence Portal certificate key.
- urls—this secret type is used to store URLs for connecting to SQL databases and proxy servers. In the Description field, you must provide a description of the connection for which you are using the secret of urls type.
You can specify URLs in the following formats: hostname:port, IPv4:port, IPv6:port, :port.
- pfx—this type of secret is used for importing a PFX file containing certificates. If you select this type of secret, you must fill in the following fields:
- PFX file (required)—this is used to upload a PFX file. The file must contain a certificate and key. PFX files may include CA-signed certificates for server certificate verification.
- PFX password (required)—this is used to enter the password for accessing the certificate key.
- kata/edr—this type of secret is used to store the certificate file and private key required when connecting to the Kaspersky Endpoint Detection and Response server. If you select this type of secret, you must upload the following files:
- Certificate file—KUMA server certificate.
The file must be in PEM format. You can upload only one certificate file.
- Private key for encrypting the connection—KUMA server RSA key.
The key must be without a password and with the PRIVATE KEY header. You can upload only one key file.
You can generate certificate and key files by clicking the
 button.
- Certificate file—KUMA server certificate.
- snmpV1—this type of secret is used to store the values of Community access (for example,
publicorprivate) that is required for interaction over the Simple Network Management Protocol. - snmpV3—this type of secret is used for storing data required for interaction over the Simple Network Management Protocol. If you select this type of secret, you must fill in the following fields:
- User—user name indicated without a domain.
- Security Level—security level of the user.
- NoAuthNoPriv—messages are forwarded without authentication and without ensuring confidentiality.
- AuthNoPriv—messages are forwarded with authentication but without ensuring confidentiality.
- AuthPriv—messages are forwarded with authentication and ensured confidentiality.
You may see additional settings depending on the selected level.
- Password—SNMP user authentication password. This field becomes available when the AuthNoPriv or AuthPriv security level is selected.
- Authentication Protocol—the following protocols are available: MD5, SHA, SHA224, SHA256, SHA384, SHA512. This field becomes available when the AuthNoPriv or AuthPriv security level is selected.
- Privacy Protocol—protocol used for encrypting messages. Available protocols: DES, AES. This field becomes available when the AuthPriv security level is selected.
- Privacy password—encryption password that was set when the SNMP user was created. This field becomes available when the AuthPriv security level is selected.
- certificate—this secret type is used for storing certificate files. Files are uploaded to a resource by clicking the Upload certificate file button. X.509 certificate public keys in Base64 are supported.
Predefined secrets
The secrets listed in the table below are included in the KUMA distribution kit.
Predefined secrets
Secret name |
Description |
[OOTB] Continent SQL connection |
Stores confidential data and settings for connecting to the APKSh Kontinent database. To use it, you must specify the login name and password of the database. |
[OOTB] KSC MSSQL connection |
Stores confidential data and settings for connecting to the MS SQL database of Kaspersky Security Center (KSC). To use it, you must specify the login name and password of the database. |
[OOTB] KSC MySQL Connection |
Stores confidential data and settings for connecting to the MySQL database of Kaspersky Security Center (KSC). To use it, you must specify the login name and password of the database. |
[OOTB] Oracle Audit Trail SQL Connection |
Stores confidential data and settings for connecting to the Oracle database. To use it, you must specify the login name and password of the database. |
[OOTB] SecretNet SQL connection |
Stores confidential data and settings for connecting to the MS SQL database of the SecretNet system. To use it, you must specify the login name and password of the database. |
Segmentation rules
In KUMA, you can configure alert segmentation rules, that is, the rules for dividing similar correlation events into different alerts.
By default, if a correlation rule is triggered several times in the correlator, all correlation events created as a result of the rule triggering are attached to the same alert. Alert segmentation rules allow you to define the conditions under which different alerts are created based on the correlation events of the same type. This can be useful, for example, to divide the stream of correlation events by the number of events or to combine several events having an important distinguishing feature into a separate alert.
Alert segmentation is configured in two stages:
- Segmentation rules are created. They define the conditions for dividing the stream of correlation events.
- Segmentation rules are linked to the correlation rules within which they must be triggered.
Segmentation rule settings
Segmentation rules are created in the Resources → Segmentation rules section of the KUMA web interface.
Available settings:
- Name (required)—a unique name for this type of resource. Must contain 1 to 128 Unicode characters.
- Tenant (required)—name of the tenant that owns the resource.
- Type (required)—type of the segmentation rule. Available values:
- By filter—alerts are created if the correlation events match the filter conditions specified in the Filter group of settings.
You can use the Add condition button to add a string containing fields for identifying the condition. You can use the Add group button to add a group of filters. Group operators can be switched between AND, OR, and NOT. You can add other condition groups and individual conditions to filter groups. You can swap conditions and condition groups by dragging them by the
icon; you can also delete them using the icon.- Left operand and Right operand—used to specify the values to be processed by the operator.
The left operand contains the names of the event fields that are processed by the filter.
For the right-hand operand, you can select the type of the value: constant or list and specify the value.
- Available operators
- Left operand and Right operand—used to specify the values to be processed by the operator.
- By identical fields—an alert is created if the correlation event contains the event fields specified in the Correlation rule identical fields group of settings.
The fields are added using the Add field button. You can delete the added fields by clicking the cross icon or the Reset button.
- By event limit—an alert is created if the number of correlation events in the previous alert exceeds the value specified in the Correlation events limit field.
- By filter—alerts are created if the correlation events match the filter conditions specified in the Filter group of settings.
- Alert naming template (required)—a template for naming the alerts created according to this segmentation rule. The default value is
{{.Timestamp}}.In the template field, you can specify text, as well as event fields in the
{{.<Event field name>}}format. When generating the alert name, the event field value is substituted instead of the event field name.The name of the alert created using the segmentation rules has the following format: "<Name of the correlation rule that created the alert> (<text from the alert naming template field> <Alert creation date>)".
- Description—resource description: up to 4,000 Unicode characters.
Linking segmentation rules to correlation rules
Links between a segmentation rule and correlation rules are created separately for each tenant. They are displayed in the Settings → Alerts → Segmentation section of the KUMA web interface in the table with the following columns:
- Tenant—the name of the tenant that owns the segmentation rules.
- Updated—date and time of the last update of the segmentation rules.
- Disabled—this column displays a label if the segmentation rules are turned off.
To link an alert segmentation rule to the correlation rules:
- In the KUMA web interface, open the Settings → Alerts → Segmentation section.
- Select the tenant for which you would like to create a segmentation rule:
- If the tenant already has segmentation rules, select it in the table.
- If the tenant has no segmentation rules, click Add settings for a new tenant and select the relevant tenant from the Tenant drop-down list.
A table with the created links between segmentation and correlation rule is displayed.
- In the Segmentation rule links group of settings, click Add and specify the segmentation rule settings:
- Name (required)—specify the segmentation rule name in this field. Must contain 1 to 128 Unicode characters.
- Tenants and correlation rule (required)—in this drop-down list, select the tenant and its correlation rule to separate the events of this tenant into an individual alert. You can select several correlation rules.
- Segmentation rule (required)—in this group of settings, select a previously created segmentation rule that defines the segmentation conditions.
- Disabled—select this check box to disable the segmentation rule link.
- Click Save.
The segmentation rule is linked to the correlation rules. Correlation events created by the specified correlation rules are combined into a separate alert with the name defined in the segmentation rule.
To disable links between segmentation rules and correlation rules for a tenant:
- Open the Settings → Alerts section of the KUMA web interface and select the tenant whose segmentation rules you want to disable.
- Select the Disabled check box.
- Click Save.
Links between segmentation rules and correlation rules are disabled for the selected tenant.
Page topExample of incident investigation with KUMA
Detecting an attack in the organization IT infrastructure using KUMA includes the following steps:
- Preliminary steps
- Assigning an alert to a user
- Check if the triggered correlation rule matches the data of the alert events
- Analyzing alert information
- False positive check
- Determining alert severity
- Incident creation
- Investigation
- Searching for related assets
- Searching for related events
- Recording the causes of the incident
- Response
- Restoring assets operability
- Closing the incident
The description of the steps provides an example of response actions that an analyst might take when an incident is detected in the organization's IT infrastructure. You can view the description and example for each step by clicking the link in its title. The examples are directly relevant to the step being described.
For conditions of the incident for which examples are provided, see the Incident conditions section.
For more information about response methods and tools, see the Incident Response Guide. On the Securelist website by Kaspersky, you can also find additional recommendations for incident detection and response.
Incident conditions
Parameters of the computer (hereinafter also referred to as "asset") on which the incident occurred:
- Asset operating system – Windows 10.
- Asset software – Kaspersky Administration Kit, Kaspersky Endpoint Security.
KUMA settings:
- Integration with Active Directory, Kaspersky Security Center, Kaspersky Endpoint Detection and Response is configured.
- SOC_package correlation rules from the application distribution kit are installed.
A cybercriminal noticed that the administrator's computer was not locked, and performed the following actions on this computer:
- Uploaded a malicious file from his server.
- Executed the command for creating a registry key in the
\HKEY_LOCAL_MACHINE\SOFTWARE\Microsoft\Windows\CurrentVersion\Runhive. - Added the file downloaded at the first step to autorun using the registry.
- Cleared the Windows Security Event Log.
- Completed the session.
Step 1. Preliminary steps
Preliminary steps are as follows:
- Event monitoring.
When a collector is created and configured in KUMA, the program writes information security events registered on controlled elements of the organization's IT infrastructure to the event database. You can find and view these events.
- Creating a correlator and correlation rules.
When a sequence of events that satisfy the conditions of a correlation rule is detected, the program generates alerts. If the same correlation rule is triggered for several events, all these events are associated with the same alert. You can use correlation rules from the distribution kit or create them manually.
- Configuring email notifications about an alert to one or more email addresses.
If notification is configured, KUMA sends a notification to the specified email addresses when a new alert is received. The alert link is displayed in the notification.
- Adding assets.
You can only perform response actions for an asset (for example, block a file from running) if the asset is added to KUMA.
Performing response action requires integrating KUMA with Kaspersky Security Center and Kaspersky Endpoint Detection and Response.
Example
The analyst has carried out the following preliminary steps:
- Installed the SOC_package correlation rules from the distribution kit and linked them to the correlator.
- Configured the sending of alert notifications to the analyst's email.
- Imported assets from Kaspersky Security Center to KUMA.
According to the incident conditions, after the administrator logged into their account, a malicious file was run, which the attacker had added to Windows autorun. The asset sent Windows security event log events to KUMA. The correlation rules were triggered for these events.
As a result, the following alerts were written to the KUMA alert database:
- R223_Collection of information about processes.
- R050_Windows Event Log was cleared. R295_System manipulations by a non-privileged process.
- R097_Startup script manipulation.
- R093_Modification of critical registry hives.
The information about the alert contains the names of the correlation rules based on which the alerts were created, and the time of the first and last event created when the rules were triggered again.
The analyst received alert notifications by email. The analyst followed the link to the R093_Changes to critical registry hives alert from the notification.
Step 2. Assigning an alert to a user
You can assign an alert to yourself or to another user.
Example As part of the incident, the analyst assigns the alert to themselves. |
Step 3. Check if the triggered correlation rule matches the data of the alert events
At this step, you must view the information about the alert and make sure that the alert event data matches the triggered correlation rule.
Example The name of the alert indicates that a critical registry hive was modified. The Related events section of the alert details displays the table of events related to the alert. The analyst sees that the table contains one event showing the path to the modified registry key, as well as the original and the new value of the key. Therefore, the correlation rule matches the event. |
Step 4. Analyzing alert information
At this step, analyze the information about the alert to determine what data is required for further analysis of the alert.
Example From the alert information, the analyst learns the following:
This information can be viewed in the details of the event that caused the alert (Alerts → R093_Modification of critical registry hives → Related events → event 2022-08-23 17:27:05), in the FileName, DeviceHostName, and SourceUserName fields respectively. |
Step 5. False positive check
At this stage, make sure that the activity that triggered the correlation rule is abnormal for the organization IT infrastructure.
Example At this step, the analyst checks whether the detected activity can be legitimate as part of normal system operation (for example, an update). The event information shows that a registry key was created under the user account using the reg.exe utility. A registry key was also created in the |
Step 6. Determining alert severity
You can change the alert severity level, if necessary.
Example The analyst assigns a high severity to the alert. |
Step 7. Incident creation
If steps 3 to 6 reveal that the alert warrants investigation, you can create an incident.
Example The analyst creates an incident in order to perform an investigation. |
Step 8. Investigation
This step includes viewing information about the assets, accounts, and alerts related to the incident in the incident information section.
Information about the impacted assets and accounts is displayed on the Related assets and Related users tabs in the incident information section.
Example The analyst opens the information about the affected asset (Incidents → the relevant incident → Related alerts → the relevant alert → Related endpoints → the relevant asset). The asset information shows that the asset belongs to the Business impact/HIGH and Device type/Workstation categories, which are critical for the organization IT infrastructure. The asset information also includes the following useful data:
|
Step 9. Searching for related assets
You can view the alerts that occurred on the assets related to the incident.
Example The analyst checks for other alerts that occurred on the assets related to the incident (Incidents → the relevant incident → Related alerts → the relevant alert → Related endpoints → the relevant asset → Related alerts). In the alert window, you can configure filtering by time or status to exclude outdated and processed alerts. The time when the asset alerts were registered helps the analyst to determine that these alerts are related, so they can be linked to the incident (select the relevant alerts → Link → the relevant incident → Link). The analyst also finds the associated alerts for the account and links them to the incident. All related assets that were mentioned in the new alerts are also scanned. |
Step 10. Searching for related events
You can expand your investigation scope by searching for events of related alerts.
The events can be found in the KUMA event database manually or by selecting any of the related alerts and clicking Find in events in the alert details (Incidents → the relevant incident → Related alerts → the relevant alert → Related endpoints → Find in events). The found events can be linked to the selected alert, however, the alert must be unlinked from the incident before that.
Example As a result, the analyst found the A new process has been created event, where the command to create a new registry key was recorded. Based on the event data, the analyst detected that
As a result, the analyst discovered that the file was downloaded from an external source using the Search for the related events for each incident alert allows the analyst to identify the entire attack chain. |
Step 11. Recording the causes of the incident
You can record the information necessary for the investigation in the incident change log.
Example Based on the results of the search for incident-related events, the analyst identified the causes of the incident and recorded the results of the analysis in the Change log field in incident details to pass the information to other analysts. |
Step 12. Incident response
You can perform the following response actions:
- Isolate the asset from the network.
- Perform a virus scan.
- Prevent the file from running on assets.
The listed actions are available if KUMA is integrated with Kaspersky Security Center and Kaspersky Endpoint Detection and Response.
Example
The analyst has information about the incident-related assets and the indicators of compromise. This information helps select the response actions.
As part of the incident being considered, it is recommended to perform the following actions:
- Start an unscheduled virus scan of the asset where the file was added to autorun.
The virus scan task is started by means of Kaspersky Security Center.
- Isolate the asset from the network for the period of the virus scan.
The asset isolation is performed by means of Kaspersky Endpoint Detection and Response.
- Quarantine the ChromeUpdate.bat file and create the execution prevention rules for this file on other assets in the organization.
An execution prevention rule for a file is created by means of Kaspersky Endpoint Detection and Response.
- Start an unscheduled virus scan of the asset where the file was added to autorun.
Step 13. Restoring assets operability
After the IT infrastructure is cleaned from the malicious presence, you can disable the prevention rules and asset network isolation rules in Kaspersky Endpoint Detection and Response.
Example After the investigation, response, and cleanup of the organization IT infrastructure from the traces of the attack, restoration of the asset operation can be started. For this purpose, the execution prevention rules and the network asset isolation rules can be disabled in Kaspersky Endpoint Detection and Response if they were not disabled automatically. |
Step 14. Closing the incident
After taking measures to clean up the traces of the attacker's presence from the organization's IT infrastructure, you can close the incident.
Page topAnalytics
KUMA provides extensive analytics on the data available to the program from the following sources:
- Events in storage
- Alerts
- Assets
- Accounts imported from Active Directory
- Data from collectors on the number of processed events
- Metrics
You can configure and receive analytics in the Dashboard, Reports, and Source status sections of the KUMA web interface. Analytics are built by using only the data from tenants that the user can access.
The date format depends on the localization language selected in the application settings. Possible date format options:
- English localization: YYYY-MM-DD.
- Russian localization: DD.MM.YYYY.
Dashboard
In the Dashboard section, you can monitor the security status of your organization's network.
The dashboard is a set of widgets that display network security data analytics. You can view data only for those tenants to which you have access.
A selection of widgets used in the dashboard is called a layout. You can create layouts manually or use predefined layouts. You can edit widget settings in predefined layouts as necessary. By default, the dashboard displays the Alerts Overview predefined layout.
Only users with the Administrator and Analyst roles can create, edit, or delete layouts. Users accounts with all roles can view layouts and set default layouts. If a layout is set as default, that layout is displayed for the account every time the user navigates to the Dashboard section. The selected default layout is saved for the current user account.
The information on the dashboard is updated in accordance with the schedule configured in layout settings. If necessary, you can force the update of the data.
For convenient presentation of information on the dashboard, you can enable TV mode. This mode lets you view the dashboard in full-screen mode in FullHD resolution. In TV mode, you can also configure a slide show display for the selected layouts.
Creating a dashboard layout
To create a layout:
- Open the KUMA web interface and select the Dashboard section.
- Open the drop-down list in the top right corner of the Dashboard window and select Create layout.
The New layout window opens.
- In the Tenants drop-down list, select the tenants that will own the created layout and whose data will be used to fill the widgets of the layout.
The selection of tenants in this drop-down list does not matter if you want to create a universal layout (see below).
- In the Time period drop-down list, select the time period from which you require analytics:
- 1 hour
- 1 day (this value is selected by default)
- 7 days
- 30 days
- In period—receive analytics for the custom time period. The time period is set using the calendar that is displayed when this option is selected.
The upper boundary of the period is not included in the time slice defined by it. In other words, to receive analytics for a 24-hour period, you should configure the period as Day 1, 00:00:00 – Day 2, 00:00:00 instead of Day 1, 00:00:00 – Day 1, 23:59:59.
- In the Refresh every drop-down list, select how often data should be updated in layout widgets:
- 1 minute
- 5 minutes
- 15 minutes
- 1 hour (this value is selected by default)
- 24 hours
- In the Add widget drop-down list, select the required widget and configure its settings.
You can add multiple widgets to the layout.
You can also drag widgets around the window and resize them using the
 button that appears when you hover the mouse over a widget.
You can edit or delete widgets added to the layout by clicking the
icon and selecting Edit to change their configuration or Delete to delete them from the layout.- Adding widgets
- Editing widget
To edit widget:
- Hover the mouse over the required widget and clicking the icon that appears.
- In the drop-down list select Edit.
The window with widget parameters opens. You can see how the widget will look like by clicking the Preview button.
- Update widget parameters and click the Save button.
- Hover the mouse over the required widget and clicking the
- In the Layout name field, enter a unique name for this layout. Must contain 1 to 128 Unicode characters.
- If necessary, click the icon on the right of the layout name field and select the check boxes next to the additional layout settings:
- Universal—if you select this check box, layout widgets display data from tenants that you select in the Selected tenants section in the menu on the left. This means that the data in the layout widgets will change based on your selected tenants without having to edit the layout settings. For universal layouts, tenants selected in the Tenants drop-down list are not taken into account.
If this check box is cleared, layout widgets display data from the tenants that are selected in the Tenants drop-down list in the layout settings. If any of the tenants selected in the layout are not available to you, their data will not be displayed in the layout widgets.
You cannot use the Active Lists widget in universal layouts.
Universal layouts can only be created and edited by General administrators. Such layouts can be viewed by all users.
- Show CII-related data—if you select this check box, layout widgets will also show data on assets, alerts, and incidents related to critical information infrastructure (CII). In this case, these layouts will be available for viewing only by users whose settings have the Access to CII facilities check box selected.
If this check box is cleared, layout widgets will not display data on CII-related assets, alerts, and incidents, even if the user has access to CII objects.
- Universal—if you select this check box, layout widgets display data from tenants that you select in the Selected tenants section in the menu on the left. This means that the data in the layout widgets will change based on your selected tenants without having to edit the layout settings. For universal layouts, tenants selected in the Tenants drop-down list are not taken into account.
- Click Save.
The new layout is created and is displayed in the Dashboard section of the KUMA web interface.
Page topSelecting a dashboard layout
To select a dashboard layout:
- Expand the list in the upper right corner of the Dashboard window.
- Select the relevant layout.
The selected layout is displayed in the Dashboard section of the KUMA web interface.
Page topSelecting a dashboard layout as the default
To set a dashboard layout as the default:
- In the KUMA web interface, select the Dashboard section.
- Expand the list in the upper right corner of the Dashboard window.
- Hover the mouse cursor over the relevant layout.
- Click the icon.
The selected layout is displayed on the dashboard by default.
Page topEditing a dashboard layout
To edit a dashboard layout:
- In the KUMA web interface, select the Dashboard section.
- Expand the list in the upper right corner of the window.
- Hover the mouse cursor over the relevant layout.
- Click the icon.
The Customizing layout window opens.
- Make the necessary changes. The settings that are available for editing are the same as the settings available when creating a layout.
- Click the Save button.
The dashboard layout is edited and displayed in the Dashboard section of the KUMA web interface.
If the layout is deleted or assigned to a different tenant while are making changes to it, an error is displayed when you click Save. The layout is not saved. Refresh the KUMA web interface page to see the list of available layouts in the drop-down list.
Page topDeleting a dashboard layout
To delete layout:
- In the KUMA web interface, select the Dashboard section.
- Expand the list in the upper right corner of the window.
- Hover the mouse cursor over the relevant layout.
- Click the icon and confirm this action.
The layout is deleted.
Page topEnabling and disabling TV mode
It is recommended to create a separate user with the minimum required set of right to display analytics in TV mode.
To enable TV mode:
- In the KUMA web interface, select the Dashboard section.
- Click the
 button in the upper-right corner.
The Settings window opens.
- Move the TV mode toggle switch to the Enabled position.
- To configure the slideshow display of the layouts, do the following:
- Move the Slideshow toggle switch to the Enabled position.
- In the Timeout field, indicate how many seconds to wait before switching layouts.
- In the Queue drop-down list, select the layouts to view. If no layout is selected, the slideshow mode displays all layouts available to the user one after another.
- If necessary, change the order in which the layouts are displayed using the button to drag and drop them.
- Click the Save button.
TV mode will be enabled. To return to working with the KUMA web interface, disable TV mode.
To disable TV mode:
- Open the KUMA web interface and select the Dashboard section.
- Click the button in the upper-right corner.
The Settings window opens.
- Move the TV mode toggle switch to the Disabled position.
- Click the Save button.
TV mode will be disabled. The left part of the screen shows a pane containing sections of the KUMA web interface.
When you make changes to the layouts selected for the slideshow, those changes will automatically be applied to the active slideshow sessions.
Page topPreconfigured dashboard layouts
The KUMA distribution kit includes a set of predefined layouts that contain the following widgets:
- Alerts Overview layout (Alert overview):
- Active alerts—number of alerts that have not been closed.
- Unassigned alerts—number of alerts that have the New status.
- Latest alerts—table with information about the last 10 unclosed alerts belonging to the tenants selected in the layout.
- Alerts distribution—number of alerts created during the period configured for the widget.
- Alerts by priority—number of unclosed alerts grouped by their priority.
- Alerts by assignee—number of alerts with the Assigned status. The grouping is by account name.
- Alerts by status—number of alerts that have the New, Opened, Assigned, or Escalated status. The grouping is by status.
- Affected users in alerts—number of users associated with alerts that have the New, Assigned, or Escalated status. The grouping is by account name.
- Affected assets—table with information about the level of importance of assets and the number of unclosed alerts they are associated with.
- Affected assets categories—categories of assets associated with unclosed alerts.
- Top event source by alerts number—number of alerts with the New, Assigned, or Escalated status, grouped by alert source (DeviceProduct event field).
The widget displays up to 10 event sources.
- Alerts by rule—number of alerts with the New, Assigned, or Escalated status, grouped by correlation rules.
- Incidents Overview layout (Incidents overview):
- Active incidents—number of incidents that have not been closed.
- Unassigned incidents—number of incidents that have the Opened status.
- Latest incidents—table with information about the last 10 unclosed incidents belonging to the tenants selected in the layout.
- Incidents distribution—number of incidents created during the period configured for the widget.
- Incidents by priority—number of unclosed incidents grouped by their priority.
- Incidents by assignee—number of incidents with the Assigned status. The grouping is by user account name.
- Incidents by status—number of incidents grouped by their status.
- Affected assets in incidents—number of assets associated with unclosed incidents.
- Affected users in incidents—users associated with incidents.
- Affected asset categories in incidents—categories of assets associated with unclosed incidents.
- Active incidents by tenant—number of incidents of all statuses, grouped by tenant.
- Network Overview layout (Network activity overview):
- Netflow top internal IPs—total volume of netflow traffic received by the asset, in bytes. The data is grouped by internal IP addresses of assets.
The widget displays up to 10 IP addresses.
- Netflow top external IPs—total volume of netflow traffic received by the asset, in bytes. The data is grouped by external IP addresses of assets.
- Netflow top hosts for remote control—number of events associated with access attempts to one of the following ports: 3389, 22, 135. The data is grouped by asset name.
- Netflow total bytes by internal ports—number of bytes sent to internal ports of assets. The data is grouped by port number.
- Top Log Sources by Events count—top 10 sources from which the greatest number of events was received.
- Netflow top internal IPs—total volume of netflow traffic received by the asset, in bytes. The data is grouped by internal IP addresses of assets.
The default refresh period for predefined layouts is Never. You can edit these layouts as needed.
Page topReports
You can configure KUMA to regularly generate reports about KUMA processes.
Reports are generated using report templates that are created and stored on the Templates tab of the Reports section.
Generated reports are stored on the Generated reports tab of the Reports section.
To save the generated reports in HTML and PDF formats, install the required packages on the device with the KUMA Core.
When deploying KUMA in a fault-tolerant version, the time zone of the Application Core server and the time in the user's browser may differ. This difference is manifested by the discrepancy between the time in reports generated by schedule and the data that the user can export from widgets. To avoid this discrepancy, it is recommended to configure the report generation schedule to take into account the difference between the users' time zone and UTC.
Report template
Report templates are used to specify the analytical data to include in the report, and to configure how often reports must be generated. Administrators and analysts can create, edit, and delete report templates. Reports that were generated using report templates are displayed in the Generated reports tab.
Report templates are available in the Templates tab of the Reports section, where the table of existing templates is displayed. The table has the following columns:
You can configure a set of table columns and their order, as well as change data sorting:
- You can enable or disable the display of columns in the menu that can be opened by clicking the icon .
- You can change the order of columns by dragging the column headers.
- If a table column header is green, you can click it to sort the table based on that column's data.
- Name—the name of the report template.
You can sort the table by this column by clicking the title and selecting Ascending or Descending.
You can also search report templates by using the Search field that opens when you click the Name column title.
Regular expressions are used when searching for report templates.
- Schedule—the rate at which reports must be generated using the template. If the report schedule was not configured, the
disabledvalue is displayed. - Created by—the name of the user who created the report template.
- Updated—the date when the report template was last updated.
You can sort the table by this column by clicking the title and selecting Ascending or Descending.
- Last report—the date and time when the last report was generated based on the report template.
- Send by email—the check mark is displayed in this column for the report templates that notify users about generated reports via email notifications.
- Tenant—the name of the tenant that owns the report template.
You can click the name of the report template to open the drop-down list with available commands:
- Run report—use this option to generate report immediately. The generated reports are displayed in the Generated reports tab.
- Edit schedule—use this command to configure the schedule for generating reports and to define users that must receive email notifications about generated reports.
- Edit report template—use this command to configure widgets and the time period for extracting analytics.
- Duplicate report template—use this command to create a copy of the existing report template.
- Delete report template—use this command to delete the report template.
Creating report template
To create report template:
- Open the KUMA web interface and select Reports → Templates.
- Click the New template button.
The New report template window opens.
- In the Tenants drop-down list, select one or more tenants that will own the layout being created.
- In the Time period drop-down list, select the time period from which you require analytics:
- This day (this value is selected by default)
- This week
- This month
- In period—receive analytics for the custom time period.
The upper boundary of the period is not included in the time slice defined by it. In other words, to receive analytics for a 24-hour period, you should configure the period as Day 1, 00:00:00 – Day 2, 00:00:00 instead of Day 1, 00:00:00 – Day 1, 23:59:59.
- Custom—receive analytics for the last N days/weeks/months/years.
- In the Retention field, specify how long you want to store reports that are generated according to this template.
- In the Template name field, enter a unique name for the report template. Must contain 1 to 128 Unicode characters.
- In the Add widget drop-down list, select the required widget and configure its settings.
You can add multiple widgets to the report template.
You can also drag widgets around the window and resize them using the
button that appears when you hover the mouse over a widget.You can edit or delete widgets added to the layout by hovering the mouse over them, clicking the
icon that appears and selecting Edit to change their configuration or Delete to delete them from layout.- Adding widgets
- Editing widget
To edit widget:
- Hover the mouse over the required widget and clicking the icon that appears.
- In the drop-down list select Edit.
The window with widget parameters opens. You can see how the widget will look like by clicking the Preview button.
- Update widget parameters and click the Save button.
- Hover the mouse over the required widget and clicking the
- You can change logo in the report template by clicking the Upload logo button.
When you click the Upload logo button, the Upload window opens and lets you choose the image file for the logo. The image must be a .jpg, .png, or .gif file no larger than 3 MB.
The added logo is displayed in the report instead of KUMA logo.
- If necessary, select the Show CII-related data check box to display data on assets, alerts, and incidents related to critical information infrastructure (CII) in the layout widgets. In this case, these layouts will be available for viewing only by users whose settings have the Access to CII facilities check box selected.
If this check box is cleared, layout widgets will not display data on CII-related assets, alerts, and incidents, even if the user has access to CII objects.
- Click Save.
The new report template is created and is displayed in the Reports → Templates tab of the KUMA web interface. You can run this report manually. If you want to have the reports generated automatically, you must configure the schedule for that.
Page topConfiguring report schedule
To configure the report schedule:
- Open the KUMA web interface and select Reports → Templates.
- In the report templates table, click the name of an existing report template and select Edit schedule in the drop-down list.
The Report settings window opens.
- If you want the report to be generated regularly:
- Turn on the Schedule toggle switch.
In the Recur every group of settings, define how often the report must be generated.
You can specify the frequency of generating reports by days, weeks, months, or years. Depending on the selected period, you should specify the time, day of the week, day of the month or the date of the report generation.
- In the Time field, enter the time when the report must be generated. You can enter the value manually or using the clock icon.
- Turn on the Schedule toggle switch.
- To select the report format and specify the report recipients, configure the following settings:
- In the Send to group of settings, click Add.
- In the Add emails window that opens, in the User group section, click Add group.
- In the field that appears, specify the email address and press Enter or click outside the entry field—the email address will be added. You can add more than one address. Reports are sent to the specified addresses every time you generate a report manually or KUMA generates a report automatically on schedule.
You should configure an SMTP connection so that generated reports can be forwarded by email.
If the recipients who received the report by email are KUMA users, they can download or view the report by clicking the links in the email. If the recipients are not KUMA users, they can follow the links but cannot log in to KUMA, so only attachments are available to them.
We recommend viewing HTML reports by clicking links in the web interface, because at some screen resolutions, the HTML report from the attachment may not be displayed correctly.
If you send an email without attachments, the recipients will have access to reports only by links and only with authorization in KUMA, without restrictions on roles or tenants.
- In the drop-down list, select the report format to send. Available formats: PDF, HTML, , Excel.
- Click Save.
Report schedule is configured.
Page topEditing report template
To edit report template:
- Open the KUMA web interface and select Reports → Templates.
- In the report templates table click the name of the report template and select Edit report template in the drop-down list.
The Edit report template window opens.
You can also open this window in the Reports → Generated reports tab by clicking the name of a generated report and selecting in the drop-down list Edit report template.
- Make the necessary changes:
- Change the list of tenants that own the report template.
- Update the time period from which you require analytics.
- Add widgets
- Change widgets positions by dragging them.
- Resize widgets using the button that appears when you hover the mouse over a widget.
- Edit widgets
To edit widget:
- Hover the mouse over the required widget and clicking the icon that appears.
- In the drop-down list select Edit.
The window with widget parameters opens. You can see how the widget will look like by clicking the Preview button.
- Update widget parameters and click the Save button.
- Hover the mouse over the required widget and clicking the
- Delete widgets by hovering the mouse over them, clicking the icon that appears, and selecting Delete.
- In the field to the right from the Add widget drop-down list enter a new name of the report template. Must contain 1 to 128 Unicode characters.
- Change the report logo by uploading it using the Upload logo button. If the template already contains a logo, you must first delete it.
- Change how long reports generated using this template must be stored.
- If necessary, select or clear the Show CII-related data check box.
- Click Save.
The report template is updated and is displayed in the Reports → Templates tab of the KUMA web interface.
Page topCopying report template
To create a copy of a report template:
- Open the KUMA web interface and select Reports → Templates.
- In the report templates table, click the name of an existing report template, and select Duplicate report template in the drop-down list.
The New report template window opens. The name of the widget is changed to
<Report template> - copy. - Make the necessary changes:
- Change the list of tenants that own the report template.
- Update the time period from which you require analytics.
- Add widgets
- Change widgets positions by dragging them.
- Resize widgets using the button that appears when you hover the mouse over a widget.
- Edit widgets
To edit widget:
- Hover the mouse over the required widget and clicking the icon that appears.
- In the drop-down list select Edit.
The window with widget parameters opens. You can see how the widget will look like by clicking the Preview button.
- Update widget parameters and click the Save button.
- Hover the mouse over the required widget and clicking the
- Delete widgets by hovering the mouse over them, clicking the icon that appears, and selecting Delete.
- In the field to the right from the Add widget drop-down list enter a new name of the report template. Must contain 1 to 128 Unicode characters.
- Change the report logo by uploading it using the Upload logo button. If the template already contains a logo, you must first delete it.
- Click Save.
The report template is created and is displayed in the Reports → Templates tab of the KUMA web interface.
Page topDeleting report template
To delete report template:
- Open the KUMA web interface and select Reports → Templates.
- In the report templates table, click the name of the report template, and select Delete report template in the drop-down list.
A confirmation window opens.
- If you want to delete only the report template, click the Delete button.
- If you want to delete a report template and all the reports that were generated using that template, click the Delete with reports button.
The report template is deleted.
Page topGenerated reports
All reports are generated using report templates. Generated reports are available in the Generated reports tab of the Reports section and are displayed in the table with the following columns:
You can configure a set of table columns and their order, as well as change data sorting:
- You can enable or disable the display of columns in the menu that can be opened by clicking the icon .
- You can change the order of columns by dragging the column headers.
- If a table column header is green, you can click it to sort the table based on that column's data.
- Name—the name of the report template.
You can sort the table by this column by clicking the title and selecting Ascending or Descending.
- Time period—the time period for which the report analytics were extracted.
- Last report—date and time when the report was generated.
You can sort the table by this column by clicking the title and selecting Ascending or Descending.
- Tenant—name of the tenant that owns the report.
- User—name of the user who generated the report manually. If the report was generated by schedule, the value is blank. If the report was generated in KUMA lower than 2.1, the value is blank.
You can click the name of a report to open the drop-down list with available commands:
- Open report—use this command to open the report data window.
- Save as—use this command to save the generated report in the desired format. Available formats: HTML, PDF, CSV, split CSV, Excel.
- Run report—use this option to generate report immediately. Refresh the browser window to see the newly generated report in the table.
- Edit report template—use this command to configure widgets and the time period for extracting analytics.
- Delete report—use this command to delete the report.
Viewing reports
To open report:
- Open the KUMA web interface and select Reports → Generated reports.
- In the report table, click the name of the generated report, and select Open report in the drop-down list.
The new browser window opens with the widgets displaying report analytics. If a widget displays data on events, alerts, incidents, or active lists, you can click its header to open the corresponding section of the KUMA web interface with an active filter and/or search query that is used to display data from the widget. Widgets are subject to default restrictions.
To download the data displayed on each widget in CSV format with UTF-8 encoding, press the CSV button. The downloaded file name has the format <widget name>_<download date (YYYYMMDD)>_<download time (HHMMSS)>.CSV.
To view the full data, download the report in the CSV format with the specified settings from the request.
- You can save the report in the desired format by using the Save as button.
Generating reports
You can generate report manually or configure a schedule to have it generated automatically.
To generate report manually:
- Open the KUMA web interface and select Reports → Templates.
- In the report templates table, click a report template name and select Run report in the drop-down list.
You can also generate report from the Reports → Generated reports tab by clicking the name of an existing report and in the drop-down list selecting Run report.
The report is generated and is displayed in the Reports → Generated reports tab.
To generate reports automatically, configure the report schedule.
Page topSaving reports
To save the report in the desired format:
- Open the KUMA web interface and select Reports → Generated reports.
- In the report table, click the name of the generated report, and in the drop-down list select Save as. Then select the desired format: HTML, PDF, CSV, split CSV, Excel.
The report is saved to the download folder configured in your browser.
You can also save the report in the desired format when you view it.
Page topDeleting reports
To delete report:
- Open the KUMA web interface and select Reports → Generated reports.
- In the report table, click the name of the generated report, and in the drop-down list select Delete report.
A confirmation window opens.
- Click OK.
Widgets
Widgets let you monitor the operation of the application.
Widgets are organized into widget groups, each one related to the analytics type they provide. The following widget groups and widgets are available in KUMA:
- Events—widget for creating analytics based on events.
- Active lists—widget for creating analytics based on active lists of correlators.
- Alerts—group for analytics related to alerts.
The group includes the following widgets:
- Active alerts—number of alerts that have not been closed.
- Active alerts by tenant—number of unclosed alerts for each tenant.
- Alerts by tenant—number of alerts of all statuses for each tenant.
- Unassigned alerts—number of alerts that have the New status.
- Alerts by assignee—number of alerts with the Assigned status. The grouping is by account name.
- Alerts by status—number of alerts that have the New, Opened, Assigned, or Escalated status. The grouping is by status.
- Alerts by severity—number of unclosed alerts grouped by their severity.
- Alerts by rule—number of unclosed alerts grouped by correlation rule.
- Latest alerts—table with information about the last 10 unclosed alerts belonging to the tenants selected in the layout.
- Alerts distribution—number of alerts created during the period configured for the widget.
- Assets—group for analytics related to assets from processed events. This group includes the following widgets:
- Affected assets—table with information about the level of importance of assets and the number of unclosed alerts they are associated with.
- Affected asset categories—categories of assets linked to unclosed alerts.
- Number of assets—number of assets that were added to KUMA.
- Assets in incidents by tenant—number of assets associated with unclosed incidents. The grouping is by tenant.
- Assets in alerts by tenant—number of assets associated with unclosed alerts, grouped by tenant.
- Incidents—group for analytics related to incidents.
The group includes the following widgets:
- Active incidents—number of incidents that have not been closed.
- Unassigned incidents—number of incidents that have the Opened status.
- Incidents distribution—number of incidents created during the period configured for the widget.
- Incidents by assignee—number of incidents with the Assigned status. The grouping is by user account name.
- Incidents by status—number of incidents grouped by status.
- Incidents by severity—number of unclosed incidents grouped by their severity.
- Active incidents by tenant—number of unclosed incidents grouped by tenant available to the user account.
- All incidents—number of incidents of all statuses.
- All incidents by tenant—number of incidents of all statuses, grouped by tenant.
- Affected assets in incidents—number of assets associated with unclosed incidents.
- Affected assets categories in incidents—asset categories associated with unclosed incidents.
- Affected users in Incidents—users associated with incidents.
- Latest incidents—table with information about the last 10 unclosed incidents belonging to the tenants selected in the layout.
- Event sources—group for analytics related to sources of events. The group includes the following widgets:
- Top event sources by alerts number—number of unclosed alerts grouped by event source.
- Top event sources by convention rate—number of events associated with unclosed alerts. The grouping is by event source.
In some cases, the number of alerts generated by sources may be inaccurate. To obtain accurate statistics, it is recommended to specify the Device Product event field as unique in the correlation rule, and enable storage of all base events in a correlation event. However, correlation rules with these settings consume more resources.
- Users—group for analytics related to users from processed events. The group includes the following widgets:
- Affected users in alerts—number of accounts related to unclosed alerts.
- Number of AD users—number of Active Directory accounts received via LDAP during the period configured for the widget.
In the events table, in the event details area, in the alert window, and in the widgets, the names of assets, accounts, and services are displayed instead of the IDs as the values of the SourceAssetID, DestinationAssetID, DeviceAssetID, SourceAccountID, DestinationAccountID, and ServiceID fields. When exporting events to a file, the IDs are saved, but columns with names are added to the file. The IDs are also displayed when you point the mouse over the names of assets, accounts, or services.
Searching for fields with IDs is only possible using IDs.
Basics of managing widgets
The principle of data display in the widget depends on the type of the graph. The following graph types are available in KUMA:
- Pie chart (
 ).
). - Counter (
 ).
). - Table (
 ).
). - Bar chart (
 ).
). - Date Histogram (
 ).
). - Line chart
Basics of general widget management
The name of the widget is displayed in the upper left corner of the widgets. By clicking the link with the name of the widget about events, alerts, incidents, or active lists, you can go to the corresponding section of the KUMA web interface.
A list of tenants for which data is displayed is located under the widget name.
In the upper right corner of the widget, the period for which data is displayed on the widget is indicated ( ). You can view the start and end dates of the period and the time of the last update by hovering the mouse cursor over this icon.
The CSV button is located to the left of the period icon. You can download the data displayed on the widget in CSV format (UTF-8 encoding). The downloaded file name has the format <widget name>_<download date (YYYYMMDD)>_<download time (HHMMSS)>.CSV.
The widget displays data for the period selected in widget or layout settings only for the tenants that are selected in widget or layout settings.
Basics of managing "Pie chart" graphs
A pie chart is displayed under the list of tenants. You can left-click the selected segment of the diagram to go to the relevant section of the KUMA web interface. The data in that section is sorted in accordance with the filters and/or search query specified in the widget.
Under the period icon, you can see the number of events, active lists, assets, alerts, or incidents grouped by the selected criteria for the data display period.
Examples:
|
Basics of managing "Counter" graphs
Graphs of this type display the sum total of selected data.
Example: The Number of assets widget displays the total number of assets added to KUMA. |
Basics of managing "Table" graphs
Graphs of this type display data in a table format.
Example: In the Events widget, for which the SQL query |
Basics of managing "Bar chart" graphs
A bar chart is displayed below the list of tenants. You can left-click the selected diagram section to go to the Events section of the KUMA web interface. The data in that section is sorted in accordance with the filters and/or search query specified in the widget. To the right of the chart, the same data is represented as a table.
Example: In the a Netflow top internal IPs widget for which the SQL query |
Basics of managing "Date Histogram" graphs
A date histogram is displayed below the list of tenants. You can left-click the selected section of the chart to go to the Events section of the KUMA web interface with the relevant data. The data in that section is sorted in accordance with the filters and/or search query specified in the widget. To the right of the chart, the same data is represented as a table.
Example: In the Events widget, for which the SQL query |
Basics of managing "Line chart" graphs
A line chart is displayed below the list of tenants. You can left-click the selected section of the chart to go to the Events section of the KUMA web interface with the relevant data. The data in that section is sorted in accordance with the filters and/or search query specified in the widget. To the right of the chart, the same data is represented as a table.
Example: In the Events widget, for which the SQL query |
Special considerations for displaying data in widgets
Limitations for the displayed data
For improved readability, KUMA has limitations on the data displayed in widgets depending on its type:
- Pie chart displays a maximum of 20 slices.
- Bar chart displays a maximum of 40 bars.
- Table displays a maximum of 500 entries.
- Date histogram displays a maximum of 365 days.
Data that exceeds the specified limitations is displayed in the widget in the Other category.
You can download the full data used for building analytics in the widget in CSV format.
Summing up the data
The format of displaying the total sum of data on date histogram, bar chart and pie chart depends on the locale:
- English locale: decades (every three digits) are separated by commas, the decimal part is separated by a period.
- Russian locale: decades (every three digits) are separated by spaces, the decimal part is separated by a comma.
Creating a widget
You can create a widget in a dashboard layout while creating or editing the layout.
To create a widget:
- Create a layout or switch to editing mode for the selected layout.
- Click Add widget.
- Select a widget type from the drop-down list.
This opens the widget settings window.
- Edit the widget settings.
- If you want to see how the data will be displayed in the widget, click Preview.
- Click Add.
The widget appears in the dashboard layout.
Page topEditing a widget
To edit widget:
- In the KUMA web interface, select the Dashboard section.
- Expand the list in the upper right corner of the window.
- Hover the mouse cursor over the relevant layout.
- Click the button.
The Customizing layout window opens.
- In the widget you want to edit, click .
- Select Edit.
This opens the widget settings window.
- Edit the widget settings.
- Click Save in the widget settings window.
- Click Save in the Customizing layout window.
The widget is edited.
Page topDeleting a widget
To delete a widget:
- In the KUMA web interface, select the Dashboard section.
- Expand the list in the upper right corner of the window.
- Hover the mouse cursor over the relevant layout.
- Click the button.
The Customizing layout window opens.
- In the widget you want to delete, click .
- Select Delete.
- This opens a confirmation window; in that window, click OK.
- Click the Save button.
The widget is deleted.
Page top"Events" widget
You can use the Events widget to get analytics based on SQL queries.
When creating this type of widget, you must set values for the following settings:
The  tab:
tab:
- Graph is the type of the graph. The following graph types are available:
- Pie chart.
- Bar chart.
- Counter.
- Line chart.
- Table.
- Date Histogram.
- Tenant is the tenant for which data is displayed in the widget.
You can select multiple tenants.
By default, data is displayed for tenants that have been selected in layout settings.
- Period is the period for which data is displayed in the widget. The following periods are available:
- As layout means data is displayed for the period selected for the layout.
This is the default setting.
- 1 hour—data is displayed for the previous hour.
- 1 day—data is displayed for the previous day.
- 7 days—data is displayed for the previous 7 days.
- 30 days—data is displayed for the previous 30 days.
- In period—data is displayed for a custom time period.
If you select this option, use the opened calendar to select the start and end dates of the period and click Apply Filter. The date and time format depends on your operating system's settings. You can also manually change the date values if necessary.
The upper boundary of the period is not included in the time slice defined by it. In other words, to receive analytics for a 24-hour period, you should configure the period as Day 1, 00:00:00 – Day 2, 00:00:00 instead of Day 1, 00:00:00 – Day 1, 23:59:59.
- As layout means data is displayed for the period selected for the layout.
- Show data for previous period—enable the display of data for two periods at the same time: for the current period and for the previous period.
- Storage is the storage that is searched for events.
- The SQL query field (
 ) lets you manually enter a query for filtering and searching events.
You can also create a query in Builder by clicking
.How to create a query in Builder
To create a query in Builder:
- Specify the values of the following parameters:
- SELECT—event fields that should be returned. The number of available fields depends on the selected graph type.
- In the drop-down list on the left, select the event fields for which you want to display data in the widget.
- The middle field displays what the selected field is used for in the widget: metric or value.
If you selected the Table graph type, in the middle fields, you must specify column names using ANSII-ASCII characters.
- In the drop-down list on the right, you can select an operation to be performed on the data:
- count—event count. This operation is available only for the ID event field. Used by default for line charts, pie charts, bar charts, and counters. This is the only option for date histogram.
- max is the maximum value of the event field from the event selection.
- min is the minimum value of the event field from the event selection.
- avg is the average value of the event field from the event selection.
- sum is the sum of event field values from the event selection.
- SOURCE is the type of the data source. Only the events value is available for selection.
- WHERE—conditions for filtering events.
- In the drop-down list on the left, select the event field that you want to use for filtering.
- Select the necessary operator from the middle drop-down list. The available operators depend on the type of value of the selected event field.
- In the drop-down list on the right, enter the value of the condition. Depending on the selected type of field, you may have to manually enter the value, select it from the drop-down list, or select it on the calendar.
You can add search conditions by clicking Add condition or remove search conditions by clicking
.You can also add groups of conditions by clicking Add group. By default, groups of conditions are added with the AND operator, but you can change the it if necessary. Available values: AND, OR, NOT. Group conditions are deleted using the Delete group button.
- GROUP BY—event fields or aliases to be used for grouping the returned data. This parameter is not available for Counter graph type.
- ORDER BY—columns used as the basis for sorting the returned data. This parameter is not available for the Date Histogram and Counter graph types.
- In the drop-down list to the left, select the value that will be used for sorting.
- Select the sort order from the drop-down list on the right: ASC for ascending, DESC for descending.
- For Table type graphs, you can add sorting conditions by clicking Add column.
- LIMIT is the maximum number of data points for the widget. This parameter is not available for the Date Histogram and Counter graph types.
- SELECT—event fields that should be returned. The number of available fields depends on the selected graph type.
- Click Apply.
Example of search conditions in the query builder
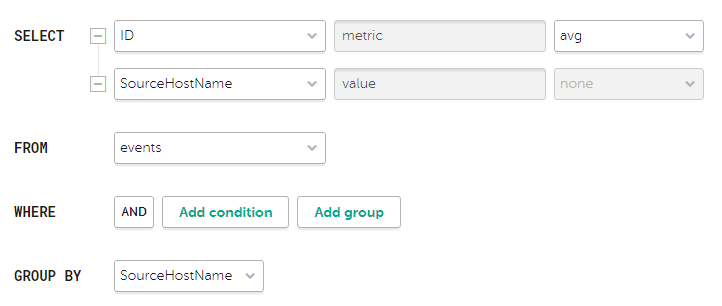
Search condition parameters for the widget showing average bytes received per host
The "metric" and "value" aliases in SQL queries cannot be edited for any type of event analytics widget, except tables.
Aliases in widgets of the Table type can contain Latin and Cyrillic characters, as well as spaces. When using spaces or Cyrillic, the alias must be enclosed in quotation marks:
"An alias with a space",`Another alias`.When displaying data for the previous period, sorting by the
count(ID)parameter may not work correctly. It is recommended to sort by the metric parameter. For example,SELECT count(ID) AS "metric", Name AS "value" FROM `events` GROUP BY Name ORDER BY metric ASC LIMIT 250.In the Counter type widgets you must specify the method of data processing for the values of the
SELECTfunction:count,max,min,avg,sum. - Specify the values of the following parameters:
The  tab:
tab:
The tab is displayed if on the tab in the Graph field you have selected one of the following values: Bar chart, Line chart, Date Histogram.
- The Y-min and Y-max values set the scale of the Y axis.
- The X-min and X-max values set the scale of the X axis.
Negative values can be displayed on chart axes. This is due to the scaling of charts on the widget and can be fixed by setting zero as the minimum chart values instead of Auto.
- Line-width is the width of the line on the graph. This field is displayed for the "Line chart" graph type.
- Point size is the size of the pointer on the graph. This field is displayed for the "Line chart" graph type.
The  tab:
tab:
- Name is the name of the widget.
- Description is the description of the widget.
- Color is a drop-down list where you can select the color for displaying information:
- default for your browser's default font color
- green
- red
- blue
- yellow
- Horizontal makes the histogram horizontal instead of vertical.
When this option is enabled, when a widget displays a large amount of data, horizontal scrolling is not available and all available information is fit into the fixed size of the widget. If there is a lot of data to display, it is recommended to increase the widget size.
- Show total shows sums total of the values.
- Legend displays a legend for analytics.
The toggle switch is turned on by default.
- Show nulls in legend displays parameters with a null value in the legend for analytics.
The toggle switch is turned off by default.
- Decimals—the field to enter the number of decimals to which the displayed value must be rounded off.
- Period segments length (available for graphs of the Date Histogram type) sets the length of segments into which you want to divide the period.
"Active lists" widget
You can use the Active lists widget to get analytics based on SQL queries.
When creating this type of widget, you must set values for the following settings:
The tab:
- Graph is the type of the graph. The following graph types are available:
- Bar chart.
- Pie chart.
- Counter.
- Table.
- Tenant is the tenant for which data is displayed in the widget.
You can select multiple tenants.
By default, data is displayed for tenants that have been selected in layout settings.
- Correlator is the name of the correlator that contains the active list for which you want to receive data.
- Active list is the name of the active list for which you want to receive data.
The same active list can be used by different correlators. However, a separate entity of the active list is created for each correlator. Therefore, the contents of the active lists used by different correlators differ even if the active lists have the same names and IDs.
- The SQL query field lets you manually enter a query for filtering and searching active list data.
The query structure is similar to that used in event search.
When creating a query based on active lists, you must consider the following:
- For the FROM function, you must specify the `records` value.
- If you want to receive data for fields whose names contain spaces and Cyrillic characters, you must also enclose such names in quotes in the query:
- In the SELECT function, enclose aliases in double quotes or backticks: "alias", `another alias`.
- In the ORDER BY function, enclose aliases in backticks: `another alias`.
- Event field values are enclosed in straight quotes: WHERE DeviceProduct = 'Microsoft'.
Names of event fields do not need to be enclosed in quotes.
If the name of an active list field begins or ends with spaces, these spaces are not displayed by the widget. The field name must not contain spaces only.
If the values of the active list fields contain trailing or leading spaces, it is recommended to use the LIKE '%field value%' function to search by them.
- In your query, you can use service fields: _key (the field with the keys of active list records) and _count (the number of times this record has been added to the active list), as well as custom fields.
- The "metric" and "value" aliases in SQL queries cannot be edited for any type of active lists analytics widget, except tables.
- If a date and time conversion function is used in an SQL query (for example, fromUnixTimestamp64Milli) and the field being processed does not contain a date and time, an error will be displayed in the widget. To avoid this, use functions that can handle a null value. Example: SELECT _key, fromUnixTimestamp64Milli(toInt64OrNull(DateTime)) as Date FROM `records` LIMIT 250.
- Large values for the LIMIT function may lead to browser errors.
- If you select Counter as the graph type, you must specify the method of data processing for the values of the SELECT function: count, max, min, avg, sum.
- You can get the names of the tenants in the widget instead of their IDs.
Special considerations apply when using aliases in SQL functions and SELECT, you can use double quotes and backticks: ", `.
If you selected Counter as the graph type, aliases can contain Latin and Cyrillic characters, as well as spaces. When using spaces or Cyrillic, the alias must be enclosed in quotation marks: "An alias with a space", `Another alias`.
When displaying data for the previous period, sorting by the count(ID) parameter may not work correctly. It is recommended to sort by the metric parameter. For example, SELECT count(ID) AS "metric", Name AS "value" FROM `events` GROUP BY Name ORDER BY metric ASC LIMIT 250.
Sample SQL queries for receiving analytics based on active lists:
SELECT * FROM `records` WHERE "Event source" = 'Johannesburg' LIMIT 250This query returns the key of the active list where the field name is "Event source" and the value of this field is "Johannesburg".
SELECT count(_key) AS metric, Status AS value FROM `records` GROUP BY value ORDER BY metric DESC LIMIT 250Query for a pie chart, which returns the number of keys in the active list ('count' aggregation over the '_key' field) and all variants of the Status custom field. The widget displays a pie chart with the total number of records in the active list, divided proportionally by the number of possible values for the Status field.
SELECT Name, Status, _count AS Number FROM `records` WHERE Description ILIKE '%ftp%' ORDER BY Name DESC LIMIT 250Query for a table, which returns the values of the Name and Status custom fields, as well as the service field '_count' for those records of the active list in which the value of the Description custom field matches ILIKE '%ftp%'. The widget displays a table with the Status, Name, and Number columns.
The tab:
This tab is displayed if on the tab, in the Graph field, you have selected Bar chart.
- The Y-min and Y-max values set the scale of the Y axis.
- The X-min and X-max values set the scale of the X axis.
Negative values can be displayed on chart axes. This is due to the scaling of charts on the widget and can be fixed by setting zero as the minimum chart values instead of Auto.
The tab:
- Name is the name of the widget.
- Description is the description of the widget.
- Color is a drop-down list where you can select the color for displaying information:
- default for your browser's default font color
- green
- red
- blue
- yellow
- Horizontal makes the histogram horizontal instead of vertical.
When this setting is enabled, all available information is fitted into the configured widget size. If the amount of data is great, you can increase the size of the widget to display it optimally.
- Show total shows sums total of the values.
- Legend displays a legend for analytics.
The toggle switch is turned on by default.
- Show nulls in legend displays parameters with a null value in the legend for analytics.
The toggle switch is turned off by default.
Other widgets
This section describes the settings of all widgets except the Events widgets and Active lists widget.
The set of parameters available for a widget depends on the type of graph that is displayed on the widget. The following graph types are available in KUMA:
- Pie chart ().
- Counter ().
- Table ().
- Bar chart ().
- Date Histogram ().
- Line chart.
Settings for pie charts
- Name is the name of the widget.
- Description is the description of the widget.
- Tenant is the tenant for which data is displayed in the widget.
You can select multiple tenants.
By default, data is displayed for tenants that have been selected in layout settings.
- Period is the period for which data is displayed in the widget. The following periods are available:
- As layout means data is displayed for the period selected for the layout.
This is the default setting.
- 1 hour—data is displayed for the previous hour.
- 1 day—data is displayed for the previous day.
- 7 days—data is displayed for the previous 7 days.
- 30 days—data is displayed for the previous 30 days.
- In period—data is displayed for a custom time period.
If you select this option, use the opened calendar to select the start and end dates of the period and click Apply Filter. The date and time format depends on your operating system's settings. You can also manually change the date values if necessary.
The upper boundary of the period is not included in the time slice defined by it. In other words, to receive analytics for a 24-hour period, you should configure the period as Day 1, 00:00:00 – Day 2, 00:00:00 instead of Day 1, 00:00:00 – Day 1, 23:59:59.
- As layout means data is displayed for the period selected for the layout.
- Show total shows sums total of the values.
- Legend displays a legend for analytics.
The toggle switch is turned on by default.
- Show nulls in legend displays parameters with a null value in the legend for analytics.
The toggle switch is turned off by default.
- Decimals—the field to enter the number of decimals to which the displayed value must be rounded off.
Settings for counters
- Name is the name of the widget.
- Description is the description of the widget.
- Tenant is the tenant for which data is displayed in the widget.
You can select multiple tenants.
By default, data is displayed for tenants that have been selected in layout settings.
- Period is the period for which data is displayed in the widget. The following periods are available:
- As layout means data is displayed for the period selected for the layout.
This is the default setting.
- 1 hour—data is displayed for the previous hour.
- 1 day—data is displayed for the previous day.
- 7 days—data is displayed for the previous 7 days.
- 30 days—data is displayed for the previous 30 days.
- In period—data is displayed for a custom time period.
If you select this option, use the opened calendar to select the start and end dates of the period and click Apply Filter. The date and time format depends on your operating system's settings. You can also manually change the date values if necessary.
The upper boundary of the period is not included in the time slice defined by it. In other words, to receive analytics for a 24-hour period, you should configure the period as Day 1, 00:00:00 – Day 2, 00:00:00 instead of Day 1, 00:00:00 – Day 1, 23:59:59.
- As layout means data is displayed for the period selected for the layout.
Settings for tables
- Name is the name of the widget.
- Description is the description of the widget.
- Tenant is the tenant for which data is displayed in the widget.
You can select multiple tenants.
By default, data is displayed for tenants that have been selected in layout settings.
- Period is the period for which data is displayed in the widget. The following periods are available:
- As layout means data is displayed for the period selected for the layout.
This is the default setting.
- 1 hour—data is displayed for the previous hour.
- 1 day—data is displayed for the previous day.
- 7 days—data is displayed for the previous 7 days.
- 30 days—data is displayed for the previous 30 days.
- In period—data is displayed for a custom time period.
If you select this option, use the opened calendar to select the start and end dates of the period and click Apply Filter. The date and time format depends on your operating system's settings. You can also manually change the date values if necessary.
The upper boundary of the period is not included in the time slice defined by it. In other words, to receive analytics for a 24-hour period, you should configure the period as Day 1, 00:00:00 – Day 2, 00:00:00 instead of Day 1, 00:00:00 – Day 1, 23:59:59.
- As layout means data is displayed for the period selected for the layout.
- Show data for previous period—enable the display of data for two periods at the same time: for the current period and for the previous period.
- Color is a drop-down list where you can select the color for displaying information:
- default for your browser's default font color
- green
- red
- blue
- yellow
- Decimals—the field to enter the number of decimals to which the displayed value must be rounded off.
Settings for Bar charts and Date Histograms
The tab:
- The Y-min and Y-max values set the scale of the Y axis.
- The X-min and X-max values set the scale of the X axis.
Negative values can be displayed on chart axes. This is due to the scaling of charts on the widget and can be fixed by setting zero as the minimum chart values instead of Auto.
- Decimals—the field to enter the number of decimals to which the displayed value must be rounded off.
The tab:
- Name is the name of the widget.
- Description is the description of the widget.
- Tenant is the tenant for which data is displayed in the widget.
You can select multiple tenants.
By default, data is displayed for tenants that have been selected in layout settings.
- Period is the period for which data is displayed in the widget. The following periods are available:
- As layout means data is displayed for the period selected for the layout.
This is the default setting.
- 1 hour—data is displayed for the previous hour.
- 1 day—data is displayed for the previous day.
- 7 days—data is displayed for the previous 7 days.
- 30 days—data is displayed for the previous 30 days.
- In period—data is displayed for a custom time period.
If you select this option, use the opened calendar to select the start and end dates of the period and click Apply Filter. The date and time format depends on your operating system's settings. You can also manually change the date values if necessary.
The upper boundary of the period is not included in the time slice defined by it. In other words, to receive analytics for a 24-hour period, you should configure the period as Day 1, 00:00:00 – Day 2, 00:00:00 instead of Day 1, 00:00:00 – Day 1, 23:59:59.
- As layout means data is displayed for the period selected for the layout.
- Show data for previous period—enable the display of data for two periods at the same time: for the current period and for the previous period.
- Color is a drop-down list where you can select the color for displaying information:
- default for your browser's default font color
- green
- red
- blue
- yellow
- Horizontal makes the histogram horizontal instead of vertical.
When this setting is enabled, all available information is fitted into the configured widget size. If the amount of data is great, you can increase the size of the widget to display it optimally.
- Show total shows sums total of the values.
- Legend displays a legend for analytics.
The toggle switch is turned on by default.
- Show nulls in legend displays parameters with a null value in the legend for analytics.
The toggle switch is turned off by default.
- Period segments length (available for graphs of the Date Histogram type) sets the length of segments into which you want to divide the period.
Displaying tenant names in "Active list" type widgets
If you want the names of tenants to be displayed in 'Active list' type widgets instead of tenant IDs, in correlation rules of the correlator, configure the function for populating the active list with information about the corresponding tenant.
The configuration process involves the following steps:
- Export the list of tenants.
- Create a dictionary of the Table type.
- Import the list of tenants obtained at step 1 into the dictionary created at step 2 of these instructions.
- Add a local variable with the dict function for mapping the tenant name to tenant ID to the correlation rule.
Example:
- Variable:
TenantName - Value:
dict ('<Name of the previously created dictionary with tenants>', TenantID)
- Variable:
- Add a Set action to the correlation rule, which writes the value of the previously created variable to the active list in the key-value format. As the key, specify the field of the active list (for example,
Tenant), and in the value field, specify the variable (for example,$TenantName).
When this rule triggers, the name of the tenant mapped by the dict function to the ID in the tenant dictionary is placed in the active list. When creating widgets based on active lists, the widget displays the name of the tenant instead of the tenant ID.
Page topWorking with alerts
Alerts are created when a sequence of events is received that triggers a correlation rule. You can find more information about alerts in this section.
In the Alerts section of the KUMA web interface, you can view and process the alerts registered by the program. Alerts can be filtered. When you click the alert name, a window with its details opens.
The alert date format depends on the localization language selected in the application settings. Possible date format options:
- English localization: YYYY-MM-DD.
- Russian localization: DD.MM.YYYY.
Alert life cycle
Below is the life cycle of an alert:
- KUMA creates an alert when a correlation rule is triggered. The alert is named after the correlation rule that generated it. Alert is assigned the New status.
Alerts with the New status continue to be updated with data when correlation rules are triggered. If the alert status changes, the alert is no longer updated with new events, and if the correlation rule is triggered again, a new alert is created.
- A security officer assigns the alert to an operator for investigation. The alert status changes to assigned.
- The operator performs one of the following actions:
- Close the alert as false a positive (alert status changes to closed).
- Respond to the threat and close the alert (alert status changes to closed).
- Creates an incident based on the alert (the alert status changes to In incident).
Alert overflow
Each alert and its related events cannot exceed the size of 16 MB. When this limit is reached:
- New events can no longer be linked to the alert.
- The alert has an Overflowed tag displayed in the Detected column. The same tag is displayed in the Details on alert section of the alert details window.
Overflowed alerts should be handled as soon as possible because new events are not added to overflowed alerts. You can filter out all events that could be linked to an alert after the overflow by clicking the All possible related events link.
Alert segmentation
Using the segmentation rules, the stream of correlation events of the same type can be divided to create more than one alert.
Configuring alerts table
The main part of the Alerts section shows a table containing information about registered alerts.
The following columns are displayed in the alerts table:
- Priority (
 )—shows the importance of a possible security threat: Critical
  , High
  , Medium
  , or Low
  .
. - Name—alert name.
If Overflowed tag is displayed next to the alert name, it means the alert size has reached or is about to reach the limit and should be processed as soon as possible.
- Status—current status of an alert:
- New—a new alert that hasn't been processed yet.
- Assigned—the alert has been processed and assigned to a security officer for investigation or response.
- Closed—the alert was closed. Either it was a false alert, or the security threat was eliminated.
- Escalated—an incident was generated based on this alert.
- Assigned to—the name of the security officer the alert was assigned to for investigation or response.
- Incident—name of the incident to which this alert is linked.
- First seen—the date and time when the first correlation event of the event sequence was created, triggering creation of the alert.
- Last seen—the date and time when the last correlation event of the event sequence was created, triggering creation of the alert.
- Categories—categories of alert-related assets with the highest severity. No more than three categories are displayed.
- Tenant—the name of the tenant that owns the alert.
- CII—an indication whether the related to the alert assets are the CII objects. The column is hidden from the users who do not have access to CII objects.
You can view the alert filtering tools by clicking the column headers. When filtering alerts based on a specific parameter, the corresponding header of the alerts table is highlighted in yellow.
Click the button to configure the displayed columns of the alerts table.
In the Search field, you can enter a regular expression for searching alerts based on their related assets, users, tenants, and correlation rules. Parameters that can be used for a search:
- Assets: name, FQDN, IP address.
- Active Directory accounts: attributes displayName, SAMAccountName, and UserPrincipalName.
- Correlation rules: name.
- KUMA users who were assigned alerts: name, login, email address.
- Tenants: name.
Filtering alerts
In KUMA, you can perform alert selection by using the filtering and sorting tools in the Alerts section.
The filter settings can be saved. Existing filters can be deleted.
Page topSaving and selecting an alert filter
In KUMA, you can save changes to the alert table settings as filters. Filters are saved on the KUMA Core server and are available to all KUMA users of the tenant for which they were created.
To save the current filter settings:
- In the Alerts section of KUMA open the Filters drop-down list.
- Select Save current filter.
A field will appear for entering the name of the new filter and selecting the tenant that will own it.
- Enter a name for the filter. The name must be unique for alert filters, incident filters, and event filters.
- In the Tenant drop-down list, select the tenant that will own the filter and click Save.
The filter is saved.
To select a previously saved filter:
- In the Alerts section of KUMA open the Filters drop-down list.
- Select the relevant filter.
To select the default filter, put an asterisk to the left of the relevant filter name in the Filters drop-down list.
The filter is selected.
To reset the current filter settings,
Open the Filters drop-down list and select Clear filters.
Page topDeleting an alert filter
To delete a previously saved filter:
- In the Alerts section of KUMA open the Filters drop-down list.
- Click next to the configuration that you want to delete.
- Click OK.
The filter is deleted for all KUMA users.
Page topViewing details on an alert
To view details on an alert:
- In the program web interface window, select the Alerts section.
The alerts table is displayed.
- Click the name of the alert whose details you want to view.
This opens a window containing information about the alert.
The upper part of the alert details window contains a toolbar and shows the alert severity and the user name to which the alert is assigned. In this window, you can process the alert: change its severity, assign it to a user, and close and create an incident based on the alert.
Details on alert section
This section lets you view basic information about an alert. It contains the following data:
- Correlation rule severity is the severity of the correlation rule that triggered the creation of the alert.
- Max asset category priority—the highest priority of an asset category assigned to assets related to this alert. If multiple assets are related to the alert, the largest value is displayed.
- Linked to incident—if the alert is linked to an incident, the name and status of the alert are displayed. If the alert is not linked to an incident, the field is blank.
- First seen—the date and time when the first correlation event of the event sequence was created, triggering creation of the alert.
- Last seen—the date and time when the last correlation event of the event sequence was created, triggering creation of the alert.
- Alert ID—the unique identifier of an alert in KUMA.
- Tenant—the name of the tenant that owns the alert.
- Correlation rule—the name of the correlation rule that triggered the creation of the alert. The rule name is represented as a link that can be used to open the settings of this correlation rule.
- Overflowed is a tag meaning that the alert size has reached or will soon reach the limit of 16 MB and the alert must be handled. New events are not added to the overflowed alerts, but you can click the All possible related events link to filter all events that could be related to the alert if there were no overflow.
A quick alert overflow may mean that the corresponding correlation rule is configured incorrectly, and this leads to frequent triggers. Overflowed alerts should be handled as soon as possible to correct the correlation rule if necessary.
Related events section
This section contains a table of events related to the alert. If you click the ![]() icon near a correlation rule, the base events from this correlation rule will be displayed. Events can be sorted by severity and time.
icon near a correlation rule, the base events from this correlation rule will be displayed. Events can be sorted by severity and time.
Selecting an event in the table opens the details area containing information about the selected event. The details area also displays the Detailed view button, which opens a window containing information about the correlation event.
The Find in events links below correlation events and the Find in events button to the right of the section heading are used to go to alert investigation.
You can use the Download events button to download information about related events into a CSV file (in UTF-8 encoding). The file contains columns that are populated in at least one related event.
Some CSV file editors interpret the separator value (for example, \n) in the CSV file exported from KUMA as a line break, not as a separator. This may disrupt the line division of the file. If you encounter a similar issue, you may need to additionally edit the CSV file received from KUMA.
In the events table, in the event details area, in the alert window, and in the widgets, the names of assets, accounts, and services are displayed instead of the IDs as the values of the SourceAssetID, DestinationAssetID, DeviceAssetID, SourceAccountID, DestinationAccountID, and ServiceID fields. When exporting events to a file, the IDs are saved, but columns with names are added to the file. The IDs are also displayed when you point the mouse over the names of assets, accounts, or services.
Searching for fields with IDs is only possible using IDs.
Related endpoints section
This section contains a table of assets related to the alert. Asset information comes from events that are related to the alert. You can search for assets by using the Search for IP addresses or FQDN field. Assets can be sorted using the Count and Endpoint columns.
This section also displays the assets related to the alert. Clicking the name of the asset opens the Asset details window.
You can use the Download assets button to download information about related assets into a CSV file (in UTF-8 encoding). The following columns are available in the file: Count, Name, IP address, FQDN, Categories.
Related users section
This section contains a table of users related to the alert. User information comes from events that are related to the alert. You can search for users using the Search for users field. Users can be sorted by the Count, User, User principal name and Email columns.
You can use the Download users button to download information about related users into a CSV file (in UTF-8 encoding). The following columns are available in the file: Count, User, User principal name, Email, Domain, Tenant.
Change log section
This section contains entries about changes made to the alert by users. Changes are automatically logged, but it is also possible to add comments manually. Comments can be sorted by using the Time column.
If necessary, you can enter a comment for the alert in the Comment field and click Add to save it.
Changing alert names
To change the alert name:
- In the KUMA web interface window, select the Alerts section.
The alerts table is displayed.
- Click the name of the alert whose details you want to view.
This opens a window containing information about the alert.
- In the upper part of the window, click
 and in the field that opens, enter the new name of the alert. To confirm the name, press ENTER or click outside the entry field.
Alert name is changed.
Processing alerts
You can change the alert severity, assign an alert to a user, close the alert, or create an incident based on the alert.
To process an alert:
- Select required alerts using one of the methods below:
- In the Alerts section of the KUMA web interface, click the alert whose information you want to view.
The Alert window opens and provides an alert processing toolbar at the top.
- In the Alerts section of the KUMA web interface, select the check box next to the required alert. It is possible to select more than one alert.
Alerts with the closed status cannot be selected for processing.
A toolbar will appear at the bottom of the window.
- In the Alerts section of the KUMA web interface, click the alert whose information you want to view.
- If you want to change the severity of an alert, select the required value in the Priority drop-down list:
- Low
- Medium
- High
- Critical
The severity of the alert changes to the selected value.
- If you want to assign an alert to a user, select the relevant user from the Assign to drop-down list.
You can assign the alert to yourself by selecting Me.
The status of the alert will change to Assigned and the name of the selected user will be displayed in the Assign to drop-down list.
- In the Related users section, select a user and configure Active Directory response settings.
- After the related user is selected, in the Account details window that opens, click Response via Active Directory.
- In the AD command drop-down list, select one of the following values:
- Add account to group
- Remove account from group
- Reset account password
- Block account
- Click Apply.
- If required, create an incident based on the alert:
- Click Create incident.
The window for creating an incident will open. The alert name is used as the incident name.
- Update the desired incident parameters and click the Save button.
The incident is created, and the alert status is changed to Escalated. An alert can be unlinked from an incident by selecting it and clicking Unlink.
- Click Create incident.
- If you want to close the alert:
- Click Close alert.
A confirmation window opens.
- Select the reason for closing the alert:
- Responded. This means the appropriate measures were taken to eliminate the security threat.
- Incorrect data. This means the alert was a false positive and the received events do not indicate a security threat.
- Incorrect correlation rule. This means the alert was a false positive and the received events do not indicate a security threat. The correlation rule may need to be updated.
- Click OK.
The status of the alert is changed to Closed. Alerts with this status are no longer updated with new correlation events and aren't displayed in the alerts table unless the Closed check box is selected in the Status drop-down list in the alerts table. You cannot change the status of a closed alert or assign it to another user.
- Click Close alert.
Alert investigation
Alert investigation is used when you need to find more information about the threat that triggered the alert — is the threat real, what is its origin, what elements of the network environment are affected by it, how should the threat be dealt with. Studying the events related to the correlation events that triggered an alert can help you determine the course of action.
The alert investigation mode is enabled in KUMA when you click the Find in events link in the alert window or the correlation event window. When the alert investigation mode is enabled, the events table is shown with filters automatically set to match the events from the alert or correlation event. The filters also match the time period of the alert duration or the time when the correlation event was registered. You can change these filters to find other events and learn more about the processes related to the threat.
An additional drop-down list becomes available in alert investigation mode:
- All events—view all events.
- Related to alert (selected by default)—view only events related to the alert.
When filtering events related to an alert, there are limitations on the complexity of SQL search queries.
You can manually assign an event of any type except the correlation event to an alert. Only events that are not related to the alert can be linked to it.
You can create and save event filters in alert investigation mode. When using this filter in normal mode, all events that match the filter criteria are selected regardless of whether or not they are related to the alert that was selected for alert investigation.
To link an event to an alert:
- In the Alerts section of the KUMA web interface, click the alert that you want to link to the event.
The Alert window opens.
- In the Related events section, click the Find in events button.
The events table is opened and displayed with active date and time filters matching the date and time of events linked to the alert. The columns show the settings used by the correlation rule to generate the alert. The Link to alert column is also added to the events table showing the events linked to the alert.
- In the drop-down list select All events.
- If necessary, modify the filters to find the event that you need to link to the alert.
- Select the relevant event and click the Link to alert button in the lower part of the event details area.
The event will be linked to the alert. You can unlink this event from the alert by clicking in the Unlink from alert detailed view.
When an event is linked to or unlinked from an alert, a corresponding entry is added to the Change log section in the Alert window. You can click the link in this entry to open the details area and unlink or link the event to the alert by clicking the corresponding button.
Page topRetention period for alerts and incidents
Alerts and incidents are stored in KUMA for a year by default. This period can be changed by editing the application startup parameters in the file /usr/lib/systemd/system/kuma-core.service on the KUMA Core server.
To change the retention period for alerts and incidents:
- Log in to the OS of the server where the KUMA Core is installed.
- In the /usr/lib/systemd/system/kuma-core.service file, edit the following string by inserting the necessary number of days:
ExecStart=/opt/kaspersky/kuma/kuma core --alerts.retention <number of days to store alerts and incidents> --external :7220 --internal :7210 --mongo mongodb://localhost:27017 - Restart KUMA by running the following commands in sequence:
systemctl daemon-reloadsystemctl restart kuma-core
The retention period for alerts and incidents will be changed.
Page topAlert notifications
Standard KUMA notifications are sent by email when alerts are generated and assigned. You can configure delivery of alert generation notifications based on a custom email template.
To configure delivery of alert generation notifications based on a custom template:
- In the KUMA web interface, open Settings → Alerts → Notification rules.
- Select the tenant for which you want to create a notification rule:
- If the tenant already has notification rules, select it in the table.
- If the tenant has no notification rules, click Add tenant and select the relevant tenant from the Tenant drop-down list.
- In the Notification rules settings block, click Add and specify the notification rule settings:
- Name (required)—specify the notification rule name in this field.
- Recipient emails (required)—in this settings block, you can use the Email button to add the email addresses to which you need to send notifications about alert generation. Addresses are added one at a time.
Cyrillic domains are not supported. For example, a notification cannot be sent to
login@domain.us. - Correlation rules (required)—in this settings block, you must select one or more correlation rules that, when triggered, will cause notification sending.
The window displays a tree structure representing the correlation rules from the shared tenant and the user-selected tenant. To select a rule, select the check box next to it. You can select the check box next to a folder to select all correlation rules in that folder and its subfolders.
- Template (required)—in this settings block, you must select an email template that will be used to create the notifications. To select a template, click the icon, select the required template in the opened window, and click Save.
You can create a template by clicking the plus icon or edit the selected template by clicking the pencil icon.
- Disabled—by selecting this check box, you can disable the notification rule.
- Click Save.
The notification rule is created. When an alert is created based on the selected correlation rules, notifications created based on custom email templates will be sent to the specified email addresses. Standard KUMA notifications about the same event will not be sent to the specified addresses.
To disable notification rules for a tenant:
- In the KUMA web interface, open Settings → Alerts → Notification rules and select the tenant whose notification rules you want to disable.
- Select the Disabled check box.
- Click Save.
The notification rules of the selected tenant are disabled.
For disabled notification rules, the correctness of the specified parameters is not checked; at the same time, notifications cannot be enabled for a tenant if incorrect rules exist. If you create or edit individual notification rules with tenant notification rules disabled, before enabling tenant notification rules, it is recommended to: 1) disable all individual notification rules, 2) enable tenant notification rules, 3) enable individual notification rules one by one.
Page topWorking with incidents
In the Incidents section of the KUMA web interface, you can create, view and process incidents. You can also filter incidents if needed. Clicking the name of an incident opens a window containing information about the incident.
Incidents can be exported to RuCERT.
The retention period for incidents is one year, but this setting can be changed.
The date format of the incident depends on the localization language selected in the application settings. Possible date format options:
- English localization: YYYY-MM-DD.
- Russian localization: DD.MM.YYYY.
About the incidents table
The main part of the Incidents section shows a table containing information about registered incidents. If required, you can change the set of columns and the order in which they are displayed in the table.
How to customize the incidents table
- Click the icon in the top right corner of the incidents table.
The table customization window opens.
- Select the check boxes opposite the settings that you want to view in the table.
When you select a check box, the events table is updated and a new column is added. When a check box is cleared, the column disappears.
You can search for table parameters using the Search field.
By pressing the Default button, the following columns are selected for display:
- Name.
- Threat duration.
- Assigned.
- Created.
- Tenant.
- Status.
- Hits count.
- Priority.
- Affected asset categories.
- Change the display order of the columns as needed by dragging the column headings.
- If you want to sort the incidents by a specific column, click its title and select one of the available options in the drop-down list: Ascending or Descending.
- To filter incidents by a specific parameter, click on the column header and select the required filters from the drop-down list. The set of filters available in the drop-down list depends on the selected column.
- To remove filters, click the relevant column heading and select Clear filter.
Available columns of the incidents table:
- Name—the name of the incident.
- Threat duration—the time span during which the incident occurred (the time between the first and the last event related to the incident).
- Assigned to—the name of the security officer to whom the incident was assigned for investigation or response.
- Created—the date and time when the incident was created. This column allows you to filter incidents by the time they were created.
- The following preset periods are available: Today, Yesterday, This week, Previous week.
- If required, you can set an arbitrary period by using the calendar that opens when you select Before date, After date, or In period.
- Tenant—the name of the tenant that owns the incident.
- Status—current status of the incident:
- Opened—new incident that has not been processed yet.
- Assigned—the incident has been processed and assigned to a security officer for investigation or response.
- Closed—the incident is closed; the security threat has been resolved.
- Alerts number—the number of alerts included in the incident. Only the alerts of those tenants to which you have access are taken into account.
- Priority shows how important a possible security threat is: Critical , High , Medium , Low .
- Affected asset categories—categories of alert-related assets with the highest severity. No more than three categories are displayed.
- Updated—the date and time of the last change made in the incident.
- First event and Last event—dates and times of the first and last events in the incident.
- Incident category and Incident type—category and type of threat assigned to the incident.
- Export to RuCERT—the status of incident data export to RuCERT:
- Not exported—the data was not forwarded to RuCERT.
- Export failed—an attempt to forward data to RuCERT ended with an error, and the data was not transmitted.
- Exported—data on the incident has been successfully transmitted to RuCERT.
- Branch—data on the specific node where the incident was created. Incidents of your node are displayed by default. This column is displayed only when hierarchy mode is enabled.
- CII—an indication of whether the incident involves assets that are CII objects. The column is hidden from the users who do not have access to CII objects.
In the Search field, you can enter a regular expression for searching incidents based on their related assets, users, tenants, and correlation rules. Parameters that can be used for a search:
- Assets: name, FQDN, IP address.
- Active Directory accounts: attributes displayName, SAMAccountName, and UserPrincipalName.
- Correlation rules: name.
- KUMA users who were assigned alerts: name, login, email address.
- Tenants: name.
When filtering incidents based on a specific parameter, the corresponding column in the incidents table is highlighted in yellow.
Page topSaving and selecting incident filter configuration
In KUMA, you can save changes to incident table settings as filters. Filter configurations are saved on the KUMA Core server and are available to all KUMA users of the tenant for which they were created.
To save the current filter configuration settings:
- In the Incidents section of KUMA, open the Select filter drop-down list.
- Select Save current filter.
A window will open for entering the name of the new filter and selecting the tenant that will own the filter.
- Enter a name for the filter configuration. The name must be unique for alert filters, incident filters, and event filters.
- In the Tenant drop-down list, select the tenant that will own the filter and click Save.
The filter configuration is now saved.
To select a previously saved filter configuration:
- In the Incidents section of KUMA, open the Select filter drop-down list.
- Select the configuration you want.
The filter configuration is now active.
You can select the default filter by putting an asterisk to the left of the required filter configuration name in the Filters drop-down list.
To reset the current filter settings,
open the Filters drop-down and select Clear filter.
Page topDeleting incident filter configurations
To delete a previously saved filter configuration:
- In the Incidents section of KUMA, open the Filters drop-down list.
- Click the button next to the configuration you want to delete.
- Click OK.
The filter configuration is now deleted for all KUMA users.
Page topViewing information about an incident
To view information about an incident:
- In the program web interface window, select the Incidents section.
- Select the incident whose information you want to view.
This opens a window containing information about the incident.
Some incident parameters are editable.
In the upper part of the Incident details window, there is a toolbar and the name of the user to whom the incident is assigned. The window sections are displayed as tabs. You can click a tab to move to the relevant section. In this window, you can process the incident: assign it to a user, combine it with another incident, or close it.
The Description section contains the following data:
- Created—the date and time when the incident was created.
- Name—the name of the incident.
You can change the name of an incident by entering a new name in the field and clicking Save The name must contain 1 to 128 Unicode characters.
- Tenant—the name of the tenant that owns the incident.
The tenant can be changed by selecting the required tenant from the drop-down list and clicking Save
- Status—current status of the incident:
- Opened—new incident that has not been processed yet.
- Assigned—the incident has been processed and assigned to a security officer for investigation or response.
- Closed—the incident is closed; the security threat has been resolved.
- Priority—the severity of the threat posed by the incident. Possible values:
- Critical
- High
- Medium
- Low
Priority can be changed by selecting the required value from the drop-down list and clicking Save.
- Affected asset categories—the assigned categories of assets associated with the incident.
- First event time and Last event time—dates and times of the first and last events in the incident.
- Type and Category—type and category of the threat assigned to the incident. You can change these values by selecting the relevant value from the drop-down list and clicking Save.
- Export to RuCERT—information on whether or not this incident was exported to RuCERT.
- Description—description of the incident.
To change the description, edit the text in the field and click Save. The description can contain no more than 256 Unicode characters.
- Related tenants—tenants associated with incident-related alerts, assets, and users.
- Available tenants—tenants whose alerts can be linked to the incident automatically.
The list of available tenants can be changed by checking the boxes next to the required tenants in the drop-down list and clicking Save.
The Related alerts section contains a table of alerts related to the incident. When you click on the alert name, a window opens with detailed information about this alert.
The Related endpoints and Related users sections contain tables with data on assets and users related to the incident. This information comes from alerts that are related to the incident.
You can add data to the tables in the Related alerts, Related endpoints and Related users sections by clicking the Link button in the appropriate section and selecting the object to be linked to the incident in the opened window. If required, you can unlink objects from the incident. To do this, select the objects as required, click Unlink in the section to which they belong, and save the changes. If objects were automatically added to the incident, they cannot be unlinked until the alert mentioning those objects is unlinked. The composition of the fields in the tables can be changed by clicking the button in the relevant section. You can search the data in the tables of these sections using the Search fields.
The Change log section contains a record of the changes you and your users made to the incident. Changes are automatically logged, but it is also possible to add comments manually.
In the RuCERT integration section, you can monitor the incident status in RuCERT. In this section, you can also export incident data to RuCERT, send files to RuCERT, and exchange messages with RuCERT experts.
If incident settings have been modified on the RuCERT side, a corresponding notification is displayed in the incident window in KUMA. In this case, for the settings whose values were modified, the window displays the values from KUMA and the values from RuCERT.
Page topIncident creation
To create an incident:
- Open the KUMA web interface and select the Incidents section.
- Click Create incident.
The window for creating an incident will open.
- Fill in the mandatory parameters of the incident:
- In the Name field enter the name of the incident. The name must contain 1 to 128 Unicode characters.
- In the Tenant drop-down list, select the tenant that owns the created incident.
- If necessary, provide other parameters for the incident:
- In the Priority drop-down list, select the severity of the incident. Available options: Low, Medium, High, Critical.
- In the First event time and Last event time fields, specify the time range in which events related to the incident were received.
- In the Category and Type drop-down lists, select the category and type of the incident. The available incident types depend on the selected category.
- Add the incident Description. The description can contain no more than 256 Unicode characters.
- In the Available tenants drop-down list, select the tenants whose alerts can be linked to the incident automatically.
- In the Related alerts section, add alerts related to the incident.
- In the Related endpoints section, add assets related to the incident.
- In the Related users section, add users related to the incident.
- Add a Comment to the incident.
- Click Save.
The incident has been created.
Page topIncident processing
You can assign an incident to a user, aggregate it with other incidents, or close it.
To process an incident:
- Select required incidents using one of the methods below:
- In the Incidents section of the KUMA web interface, click on the incident to be processed.
The incident window will open, displaying a toolbar on the top.
- In the Incidents section of the KUMA web console, select the check box next to the required incidents.
A toolbar will appear at the bottom of the window.
- In the Incidents section of the KUMA web interface, click on the incident to be processed.
- In the Assign to drop-down list, select the user to whom you want to assign the incident.
You can assign the incident to yourself by selecting Me.
The status of the incident changes to assigned and the name of the selected user is displayed in the Assign to drop-down list.
- In the Related users section, select a user and configure Active Directory response settings.
- After the related user is selected, in the Account details window that opens, click Response via Active Directory.
- In the AD command drop-down list, select one of the following values:
- Add account to group
- Remove account from group
- Reset account password
- Block account
- Click Apply.
- If required, edit the incident parameters.
- After investigating, close the incident:
- Click Close.
A confirmation window opens.
- Select the reason for closing the incident:
- Approved. This means the appropriate measures were taken to eliminate the security threat.
- Not approved. This means the incident was a false positive and the received events do not indicate a security threat.
- Click Close.
The Closed status will be assigned to the incident. Incidents with this status cannot be edited, and they are displayed in the incidents table only if you selected the Closed check box in the Status drop-down list when filtering the table. You cannot change the status of a closed incident or assign it to another user, but you can aggregate it with another incident.
- Click Close.
- If requited, aggregate the selected incidents with another incident:
- Click Merge. In the opened window, select the incident in which all data from the selected incidents should be placed.
- Confirm your selection by clicking Merge.
The incidents will be aggregated.
The incident has been processed.
Page topChanging incidents
To change the parameters of an incident:
- In the Incidents section of the KUMA web interface, click on the incident you want to modify.
The Incident window opens.
- Make the necessary changes to the parameters. All incident parameters that can be set when creating it are available for editing.
- Click Save.
The incident will be modified.
Page topAutomatic linking of alerts to incidents
In KUMA, you can configure automatic linking of generated alerts to existing incidents if alerts and incidents have related assets or users in common. If this setting is enabled, when creating an alert the program searches for incidents falling into a specified time interval that includes assets or users from the alert. In addition, the program checks whether the generated alert pertains to the tenants specified in the incidents' Available tenants parameter. If a matching incident is found, the program links the generated alert to the incident it found.
To set up automatic linking of alerts to incidents:
- In the KUMA web interface, open Settings → Incidents → Automatic linking of alerts to incidents.
- Select the Enable check box in the Link by assets and/or Link by accounts parameter blocks depending on the types of connections between incidents and alerts that you are looking for.
- Define the Incidents must not be older than value for the parameters that you want to use when searching links. The generated alerts will be compared with incidents no older than the specified interval.
Automatic linking of alerts to incidents is configured.
To disable automatic linking of alerts to incidents,
In the KUMA web interface, under Settings → Incidents → Automatic linking of alerts to incidents, select the Disabled check box.
Page topCategories and types of incidents
For your convenience, you can assign categories and types. If an incident has been assigned a RuCERT category, it can be exported to RuCERT.
Categories and types of incidents that can be exported to RuCERT
The categories of incidents can be viewed or changed under Settings → Incidents → Incident types, in which they are displayed as a table. By clicking on the column headers, you can change the table sorting options. The resource table contains the following columns:
- Category—a common characteristic of an incident or cyberattack. The table can be filtered by the values in this column.
- Type—the class of the incident or cyberattack.
- RuCERT category—incident type according to RuCERT nomenclature. Incidents that have been assigned custom types and categories cannot be exported to RuCERT. The table can be filtered by the values in this column.
- Vulnerability—specifies whether the incident type indicates a vulnerability.
- Created—the date the incident type was created.
- Updated—the date the incident type was modified.
To add an incident type:
- In the KUMA web interface, under Settings → Incidents → Incident types, click Add.
The incident type creation window will open.
- Fill in the Type and Category fields.
- If the created incident type matches the RuCERT nomenclature, select the RuCERT category check box.
- If the incident type indicates a vulnerability, check Vulnerability.
- Click Save.
The incident type has been created.
Page topInteraction with RuCERT
In KUMA, you can interact with the National Computer Incident Response & Coordination Center (hereinafter RuCERT) in the following ways:
- Export incidents to RuCERT.
- Supplement the exported incident with data when requested by RuCERT.
- Send files to RuCERT.
- Exchange messages with RuCERT experts.
- View the changes made by RuCERT to the exported incidents settings.
Data in KUMA and RuCERT is synchronized every 5-10 minutes.
Conditions for RuCERT interaction
To interact with RuCERT, the following conditions must be met:
- The application license includes the GosSOPKA module.
- RuCERT integration is configured.
- The Can interact with RuCERT check box is selected in the settings of the users whose responsibilities include interaction with RuCERT.
RuCERT interaction workflow
In KUMA, the process of sending incidents to RuCERT to be processed consists of the following stages:
- Creating an incident and checking it for compliance with RuCERT requirements
You can create an incident or get it from a child KUMA node. Before sending data to the RuCERT, make sure that the incident category meets RuCERT requirements.
- Exporting the incident to RuCERT
If the incident is successfully exported to RuCERT, its Export to RuCERT setting is set to Exported. In the lower part of the incident window, a chat with RuCERT experts becomes available.
At RuCERT, the incident received from you is assigned a registration number and status. This information is displayed in the incident window in the RuCERT integration section and in automatic chat messages.
If all the necessary data is provided to RuCERT, the incident is assigned the Under examination status. The settings of the incident having this status can be edited, but the updated information cannot be sent from KUMA to RuCERT. You can view the difference between the incident data in KUMA and in RuCERT.
- Supplementing incident data
If RuCERT experts do not have enough information to process an incident, they can assign it the More information required status. In KUMA, this status is displayed in the incident window in the RuCERT integration section. Users are notified about the status change.
You can attach a file to the incidents with this status.
When the data is supplemented, the incident is re-exported to RuCERT with earlier information updated. The incidents in the child nodes cannot be modified from the parent KUMA node. It must be done by employees of the child KUMA nodes.
If the incident is successfully supplemented with data, it is assigned the Under examination status.
- Completing incident processing
After the RuCERT experts process the incident, the RuCERT status is changed to Decision made. In KUMA, this status is displayed in the incident window in the RuCERT integration section.
Upon receiving this status, the incident is automatically closed in KUMA. Interaction with RuCERT on this incident by means of KUMA becomes impossible.
Special consideration for successful export from the KUMA hierarchical structure to RuCERT
If multiple KUMA nodes combined into a hierarchical structure are deployed in your organization, you can forward incidents, which are received from the child KUMA nodes, from the KUMA parent nodes to RuCERT. For this purpose, the following conditions must be met:
- Integration with RuCERT is configured in the parent and child KUMA nodes. The URL and Token settings in the Settings → RuCERT section are required for the parent node but are not required for the child node.
- RuCERT integration is enabled in both nodes.
In this case, interaction with RuCERT is performed only at the level of the node exporting the incident to RuCERT.
Settings of the incident received from a child KUMA node cannot be changed from a parent KUMA node. If there is not enough data for performing RuCERT export, the incident must be changed at the child KUMA node, and then exported to RuCERT from the parent KUMA node.
Page topExporting data to RuCERT
It is impossible to export incidents that are closed in KUMA to RuCERT if the Description field was not filled in at the time of closing.
To export an incident to RuCERT:
- In the Incidents section of the KUMA web interface, open the incident you want to export.
- Click the Export to RuCERT button in the lower part of the window.
- If you have not specified the category and type of incident, specify this information in the window that opens and click the Export to RuCERT button.
This opens the export settings window.
- Specify the settings on the Basic tab of the Export to RuCERT window:
- Category and Type—specify the type and category of the incident. Only incidents of specific categories and types can be exported to RuCERT.
- TLP (required)—assign a Traffic Light Protocol marker to an incident to define the nature of information about the incident. The default value is RED. Available values:
- WHITE—disclosure is not restricted.
- GREEN—disclosure is only for the community.
- AMBER—disclosure is only for organizations.
- RED—disclosure is only for a specific group of people.
- Affected system name (required)—specify the name of the information resource where the incident occurred. You can enter up to 500,000 characters in the field.
- Affected system category (required)—specify the critical information infrastructure (CII) category of your organization. If your organization does not have a CII category, select Information resource is not a CII object.
- Affected system function (required)—specify the scope of activity of your organization. The value specified in RuCERT integration settings is used by default.
- Location (required)—select the location of your organization from the drop-down list.
- Affected system has Internet connection—select this check box if the assets related to this incident have an Internet connection. By default, this check box is cleared.
If this check box is selected, the Technical details tab is available. This tab displays information about the assets related to the incident. See below for more details.
- Product info (required)—this table becomes available if you selected Notification about a detected vulnerability as the incident category.
You can use the Add new element button to add a string to the table. In the Name column, you must indicate the name of the application (for example,
MS Office). Specify the application version in the Version column (for example,2.4). - Vulnerability ID—if necessary, specify the identifier of the detected vulnerability. For example,
CVE-2020-1231.This field becomes available if you selected Notification about a detected vulnerability as the incident category.
- Product category—if necessary, specify the name and version of the vulnerable product. For example,
Microsoft operating systems and their components.This field becomes available if you selected Notification about a detected vulnerability as the incident category.
- If required, define the settings on the Advanced tab of the Export to RuCERT window.
The available settings on the tab depend on the selected category and type of incident:
- Detection tool—specify the name of the product that was used to register the incident. For example,
KUMA 1.5. - Assistance required—select this check box if you need help from GosSOPKA employees.
- Incident end time—specify the date and time when the critical information infrastructure (CII object) was restored to normal operation after a computer incident, computer attack was ended, or a vulnerability was fixed.
- Availability impact—assess the degree of impact that the incident had on system availability:
- High
- Low
- None
- Integrity impact—assess the degree of impact that the incident had on system integrity:
- High
- Low
- None
- Confidentiality impact—assess the degree of impact that the incident had on data confidentiality:
- High
- Low
- None
- Custom impact—specify other significant impacts from the incident.
- City—indicate the city where your organization is located.
- Detection tool—specify the name of the product that was used to register the incident. For example,
- If assets are attached to the incident, you can specify their settings on the Technical details tab.
This tab is active only if you select the Affected system has Internet connection check box.
You should change or supplement the information previously specified on the Technical details tab in your personal GosSOPKA dashboard, even if the RuCERT experts request from you additional information, and you can change the exported incident.
The categories of the listed assets must match the category of the affected CII in your system.
- Click Export.
- Confirm the export.
Information about the incident is submitted to RuCERT, and the Export to RuCERT incident setting is changed to Exported. At RuCERT, the incident received from you is assigned a registration number and status. This information is displayed in the incident window in the RuCERT integration section.
It is possible to change the data in the exported incident only if the RuCERT experts requested additional information from you. If no additional information was requested, but you need to update the exported incident, you should do it in your GosSOPKA dashboard.
After the incident is successfully exported, the Compare KUMA incident to RuCERT data button is displayed at the bottom of the screen. When you click this button, a window opens, where the differences in the incident data between KUMA and RuCERT are highlighted.
Page topSupplementing incident data on request
If RuCERT experts need additional information about the incident, they may request it from you. In this case, the incident status changes to More information required in the RuCERT integration section of the incident window. The following KUMA users receive email notifications about the status change: the user to whom the incident is assigned and the user who exported the incident to RuCERT.
If an incident is assigned the "More information required" status in RuCERT, the following actions are available for this incident in KUMA:
- Upload files to RuCERT.
- Re-export the incident data to RuCERT with updates or additions to the previously provided information. This action completes supplementing the incident data.
Sending files to RuCERT
If an incident is assigned the More information required status in RuCERT, you can attach a file to it. The file will be available both in RuCERT and in the KUMA web interface.
For a hierarchical deployment of KUMA, files can only be uploaded to RuCERT from the parent KUMA node. At the same time, log entries about the file download are visible in the child nodes of KUMA.
In the incident change log, messages about the files uploaded to RuCERT by KUMA users are added. Messages about adding files by RuCERT are not added to the log.
To attach a file to an incident:
- In the Incidents section of the KUMA web interface, open the incident you want to attach a file to. The incident must have the More information required status in RuCERT.
- In the RuCERT integration section of the incident window, select the File tab and click the Send file to RuCERT button.
The file selection window opens.
- Select the required file no larger than 50 MB and confirm your selection.
The file is attached to the incident and available for both RuCERT experts and KUMA users.
Data in KUMA and RuCERT is synchronized every 5-10 minutes.
Page topSending incidents involving personal information leaks to RuCERT
KUMA 2.1.x does not have a separate section with incident parameters for submitting information about personal information leaks to RuCERT. Since such incidents do occur and a need exists to submit information to RuCERT, use the following solution.
To submit incidents involving personal information leaks:
- In the KUMA web interface, in the Incidents section, when creating an incident involving a personal information leak, in the Category field, select Notification about a computer incident.
- In the Type field, select one of the options that involves submission of information about personal information leak:
- Malware infection
- Compromised user account
- Unauthorized disclosure of information
- Successful exploitation of a vulnerability
- Event is not related to a computer attack
- In the Description field, enter "The incident involves a leak of personal information. Please set the status to "More information required"".
- Click Save.
- Export the incident to RuCERT.
After RuCERT employees set the status to "More information required" and return the incident for further editing, in your RuCERT account, you can provide additional information about the incident in the "Details of the personal information leak" section.
Page topCommunication with RuCERT experts
After the incident is successfully exported to RuCERT, a chat with RuCERT experts becomes available at the bottom of the screen. You can exchange messages since successful incident export to RuCERT until it is closed in RuCERT.
The chat window with the message history and the field for entering new messages is available on the Chat tab in the RuCERT integration section of the incident window.
Data in KUMA and RuCERT is synchronized every 5-10 minutes.
Supported categories and types of RuCERT incidents
The table below lists the categories and types of incidents that can be exported to RuCERT:
Incident category |
Incident type |
Computer incident notification |
Involvement of a controlled resource in malicious software infrastructure |
Slowed operation of the resource due to a DDoS attack |
|
Malware infection |
|
Network traffic interception |
|
Use of a controlled resource for phishing |
|
Compromised user account |
|
Unauthorized data modification |
|
Unauthorized disclosure of information |
|
Publication of illegal information on the resource |
|
Distribution of spam messages from the controlled resource |
|
Successful exploitation of a vulnerability |
|
Notification about a computer attack |
DDoS attack |
Unsuccessful authorization attempts |
|
Malware injection attempts |
|
Attempts to exploit a vulnerability |
|
Publication of fraudulent information |
|
Network scanning |
|
Social engineering |
|
Notification about a detected vulnerability |
Vulnerable resource |
Notifications about the incident status change in RuCERT
In the event of certain changes in the status or data of an incident at RuCERT, KUMA users receive the following notifications by email:
- Notification about receiving a message from RuCERT.
- Additional data request notification.
- Notification about the incident status change in RuCERT.
- Notification about automatic closure of an incident.
The following users receive notifications:
- The user to whom the incident was assigned.
- The user who exported the incident to RuCERT.
Retroscan
In normal mode, the correlator handles only events coming from collectors in real time. Retroscan lets you apply correlation rules to historical events if you want to debug correlation rules or analyze historical data.
To test a rule, you do not need to replay the incident in real time, instead you can run the rule in Retroscan mode to process historical events which include the incident of interest.
You can use a search query to define a list of historical events to retrospectively scan, you can also specify a search period and the storage that you want to search for events. You can configure a task to have alerts generated and response rules applied during the retroscan of events.
Retroscanned events are not enriched with data from CyberTrace or the Kaspersky Threat Intelligence Portal.
Active lists are updated during retroscanning.
A retroscan cannot be performed on selections of events obtained using SQL queries that group data and contain arithmetic expressions.
To use Retroscan:
- In the Events section of the KUMA web interface, create the required event selection:
- Select the storage.
- Configure search expression using the constructor or search query.
- Select the required period.
- Open the drop-down list and choose Retroscan.
The Retroscan window opens.
- In the Correlator drop-down list, select the Correlator to feed selected events to.
- In the Correlation rules drop-down list, select the Correlation rules that must be used when processing events.
- If you want responses to be executed when processing events, turn on the Execute responses toggle switch.
- If you want alerts to be generated during event processing, turn on the Create alerts toggle switch.
- Click the Create task button.
The retroscan task is created in the Task manager section.
To view scan results, in the Task manager section of the KUMA web interface, click the task you created and select Go to Events from the drop-down list.
This opens a new browser tab containing a table of events that were processed during the retroscan and the aggregation and correlation events that were created during event processing. Correlation events generated by the retroscan have an additional ReplayID field that stores the unique ID of the retrospective scan run. An analyst can restart the retroscan from the context menu of the task. New correlation events will have a different ReplayID.
Depending on your browser settings, you may be prompted for confirmation before your browser can open the new tab containing the retroscan results. For more details, please refer to the documentation for your specific browser.
Page top