Contents
- Analytics
- Dashboard
- Reports
- Widgets
- Working with alerts
- Working with incidents
- About the incidents table
- Saving and selecting incident filter configuration
- Deleting incident filter configurations
- Viewing information about an incident
- Incident creation
- Incident processing
- Changing incidents
- Automatic linking of alerts to incidents
- Categories and types of incidents
- Interaction with RuCERT
- Special consideration for successful export from the KUMA hierarchical structure to RuCERT
- Exporting data to RuCERT
- Supplementing incident data on request
- Sending files to RuCERT
- Sending incidents involving personal information leaks to RuCERT
- Communication with RuCERT experts
- Supported categories and types of RuCERT incidents
- Notifications about the incident status change in RuCERT
- Retroscan
Analytics
KUMA provides extensive analytics on the data available to the program from the following sources:
- Events in storage
- Alerts
- Assets
- Accounts imported from Active Directory
- Data from collectors on the number of processed events
- Metrics
You can configure and receive analytics in the Dashboard, Reports, and Source status sections of the KUMA web interface. Analytics are built by using only the data from tenants that the user can access.
The date format depends on the localization language selected in the application settings. Possible date format options:
- English localization: YYYY-MM-DD.
- Russian localization: DD.MM.YYYY.
Dashboard
In the Dashboard section, you can monitor the security status of your organization's network.
The dashboard is a set of widgets that display network security data analytics. You can view data only for those tenants to which you have access.
A selection of widgets used in the dashboard is called a layout. You can create layouts manually or use predefined layouts. You can edit widget settings in predefined layouts as necessary. By default, the dashboard displays the Alerts Overview predefined layout.
Only users with the Administrator and Analyst roles can create, edit, or delete layouts. Users accounts with all roles can view layouts and set default layouts. If a layout is set as default, that layout is displayed for the account every time the user navigates to the Dashboard section. The selected default layout is saved for the current user account.
The information on the dashboard is updated in accordance with the schedule configured in layout settings. If necessary, you can force the update of the data.
For convenient presentation of information on the dashboard, you can enable TV mode. This mode lets you view the dashboard in full-screen mode in FullHD resolution. In TV mode, you can also configure a slide show display for the selected layouts.
Creating a dashboard layout
To create a layout:
- Open the KUMA web interface and select the Dashboard section.
- Open the drop-down list in the top right corner of the Dashboard window and select Create layout.
The New layout window opens.
- In the Tenants drop-down list, select the tenants that will own the created layout and whose data will be used to fill the widgets of the layout.
The selection of tenants in this drop-down list does not matter if you want to create a universal layout (see below).
- In the Time period drop-down list, select the time period from which you require analytics:
- 1 hour
- 1 day (this value is selected by default)
- 7 days
- 30 days
- In period—receive analytics for the custom time period. The time period is set using the calendar that is displayed when this option is selected.
The upper boundary of the period is not included in the time slice defined by it. In other words, to receive analytics for a 24-hour period, you should configure the period as Day 1, 00:00:00 – Day 2, 00:00:00 instead of Day 1, 00:00:00 – Day 1, 23:59:59.
- In the Refresh every drop-down list, select how often data should be updated in layout widgets:
- 1 minute
- 5 minutes
- 15 minutes
- 1 hour (this value is selected by default)
- 24 hours
- In the Add widget drop-down list, select the required widget and configure its settings.
You can add multiple widgets to the layout.
You can also drag widgets around the window and resize them using the
 button that appears when you hover the mouse over a widget.
You can edit or delete widgets added to the layout by clicking the
 icon and selecting Edit to change their configuration or Delete to delete them from the layout.
- Adding widgets
- Editing widget
To edit widget:
- Hover the mouse over the required widget and clicking the icon that appears.
- In the drop-down list select Edit.
The window with widget parameters opens. You can see how the widget will look like by clicking the Preview button.
- Update widget parameters and click the Save button.
- Hover the mouse over the required widget and clicking the
- In the Layout name field, enter a unique name for this layout. Must contain 1 to 128 Unicode characters.
- If necessary, click the icon on the right of the layout name field and select the check boxes next to the additional layout settings:
- Universal—if you select this check box, layout widgets display data from tenants that you select in the Selected tenants section in the menu on the left. This means that the data in the layout widgets will change based on your selected tenants without having to edit the layout settings. For universal layouts, tenants selected in the Tenants drop-down list are not taken into account.
If this check box is cleared, layout widgets display data from the tenants that are selected in the Tenants drop-down list in the layout settings. If any of the tenants selected in the layout are not available to you, their data will not be displayed in the layout widgets.
You cannot use the Active Lists widget in universal layouts.
Universal layouts can only be created and edited by General administrators. Such layouts can be viewed by all users.
- Show CII-related data—if you select this check box, layout widgets will also show data on assets, alerts, and incidents related to critical information infrastructure (CII). In this case, these layouts will be available for viewing only by users whose settings have the Access to CII facilities check box selected.
If this check box is cleared, layout widgets will not display data on CII-related assets, alerts, and incidents, even if the user has access to CII objects.
- Universal—if you select this check box, layout widgets display data from tenants that you select in the Selected tenants section in the menu on the left. This means that the data in the layout widgets will change based on your selected tenants without having to edit the layout settings. For universal layouts, tenants selected in the Tenants drop-down list are not taken into account.
- Click Save.
The new layout is created and is displayed in the Dashboard section of the KUMA web interface.
Page topSelecting a dashboard layout
To select a dashboard layout:
- Expand the list in the upper right corner of the Dashboard window.
- Select the relevant layout.
The selected layout is displayed in the Dashboard section of the KUMA web interface.
Page topSelecting a dashboard layout as the default
To set a dashboard layout as the default:
- In the KUMA web interface, select the Dashboard section.
- Expand the list in the upper right corner of the Dashboard window.
- Hover the mouse cursor over the relevant layout.
- Click the
 icon.
icon.
The selected layout is displayed on the dashboard by default.
Page topEditing a dashboard layout
To edit a dashboard layout:
- In the KUMA web interface, select the Dashboard section.
- Expand the list in the upper right corner of the window.
- Hover the mouse cursor over the relevant layout.
- Click the
 icon.
icon.The Customizing layout window opens.
- Make the necessary changes. The settings that are available for editing are the same as the settings available when creating a layout.
- Click the Save button.
The dashboard layout is edited and displayed in the Dashboard section of the KUMA web interface.
If the layout is deleted or assigned to a different tenant while are making changes to it, an error is displayed when you click Save. The layout is not saved. Refresh the KUMA web interface page to see the list of available layouts in the drop-down list.
Page topDeleting a dashboard layout
To delete layout:
- In the KUMA web interface, select the Dashboard section.
- Expand the list in the upper right corner of the window.
- Hover the mouse cursor over the relevant layout.
- Click the
 icon and confirm this action.
The layout is deleted.
Page topEnabling and disabling TV mode
It is recommended to create a separate user with the minimum required set of right to display analytics in TV mode.
To enable TV mode:
- In the KUMA web interface, select the Dashboard section.
- Click the
 button in the upper-right corner.
The Settings window opens.
- Move the TV mode toggle switch to the Enabled position.
- To configure the slideshow display of the layouts, do the following:
- Move the Slideshow toggle switch to the Enabled position.
- In the Timeout field, indicate how many seconds to wait before switching layouts.
- In the Queue drop-down list, select the layouts to view. If no layout is selected, the slideshow mode displays all layouts available to the user one after another.
- If necessary, change the order in which the layouts are displayed using the
 button to drag and drop them.
- Click the Save button.
TV mode will be enabled. To return to working with the KUMA web interface, disable TV mode.
To disable TV mode:
- Open the KUMA web interface and select the Dashboard section.
- Click the button in the upper-right corner.
The Settings window opens.
- Move the TV mode toggle switch to the Disabled position.
- Click the Save button.
TV mode will be disabled. The left part of the screen shows a pane containing sections of the KUMA web interface.
When you make changes to the layouts selected for the slideshow, those changes will automatically be applied to the active slideshow sessions.
Page topPreconfigured dashboard layouts
The KUMA distribution kit includes a set of predefined layouts that contain the following widgets:
- Alerts Overview layout (Alert overview):
- Active alerts—number of alerts that have not been closed.
- Unassigned alerts—number of alerts that have the New status.
- Latest alerts—table with information about the last 10 unclosed alerts belonging to the tenants selected in the layout.
- Alerts distribution—number of alerts created during the period configured for the widget.
- Alerts by priority—number of unclosed alerts grouped by their priority.
- Alerts by assignee—number of alerts with the Assigned status. The grouping is by account name.
- Alerts by status—number of alerts that have the New, Opened, Assigned, or Escalated status. The grouping is by status.
- Affected users in alerts—number of users associated with alerts that have the New, Assigned, or Escalated status. The grouping is by account name.
- Affected assets—table with information about the level of importance of assets and the number of unclosed alerts they are associated with.
- Affected assets categories—categories of assets associated with unclosed alerts.
- Top event source by alerts number—number of alerts with the New, Assigned, or Escalated status, grouped by alert source (DeviceProduct event field).
The widget displays up to 10 event sources.
- Alerts by rule—number of alerts with the New, Assigned, or Escalated status, grouped by correlation rules.
- Incidents Overview layout (Incidents overview):
- Active incidents—number of incidents that have not been closed.
- Unassigned incidents—number of incidents that have the Opened status.
- Latest incidents—table with information about the last 10 unclosed incidents belonging to the tenants selected in the layout.
- Incidents distribution—number of incidents created during the period configured for the widget.
- Incidents by priority—number of unclosed incidents grouped by their priority.
- Incidents by assignee—number of incidents with the Assigned status. The grouping is by user account name.
- Incidents by status—number of incidents grouped by their status.
- Affected assets in incidents—number of assets associated with unclosed incidents.
- Affected users in incidents—users associated with incidents.
- Affected asset categories in incidents—categories of assets associated with unclosed incidents.
- Active incidents by tenant—number of incidents of all statuses, grouped by tenant.
- Network Overview layout (Network activity overview):
- Netflow top internal IPs—total volume of netflow traffic received by the asset, in bytes. The data is grouped by internal IP addresses of assets.
The widget displays up to 10 IP addresses.
- Netflow top external IPs—total volume of netflow traffic received by the asset, in bytes. The data is grouped by external IP addresses of assets.
- Netflow top hosts for remote control—number of events associated with access attempts to one of the following ports: 3389, 22, 135. The data is grouped by asset name.
- Netflow total bytes by internal ports—number of bytes sent to internal ports of assets. The data is grouped by port number.
- Top Log Sources by Events count—top 10 sources from which the greatest number of events was received.
- Netflow top internal IPs—total volume of netflow traffic received by the asset, in bytes. The data is grouped by internal IP addresses of assets.
The default refresh period for predefined layouts is Never. You can edit these layouts as needed.
Page topReports
You can configure KUMA to regularly generate reports about KUMA processes.
Reports are generated using report templates that are created and stored on the Templates tab of the Reports section.
Generated reports are stored on the Generated reports tab of the Reports section.
To save the generated reports in HTML and PDF formats, install the required packages on the device with the KUMA Core.
When deploying KUMA in a fault-tolerant version, the time zone of the Application Core server and the time in the user's browser may differ. This difference is manifested by the discrepancy between the time in reports generated by schedule and the data that the user can export from widgets. To avoid this discrepancy, it is recommended to configure the report generation schedule to take into account the difference between the users' time zone and UTC.
Report template
Report templates are used to specify the analytical data to include in the report, and to configure how often reports must be generated. Administrators and analysts can create, edit, and delete report templates. Reports that were generated using report templates are displayed in the Generated reports tab.
Report templates are available in the Templates tab of the Reports section, where the table of existing templates is displayed. The table has the following columns:
You can configure a set of table columns and their order, as well as change data sorting:
- You can enable or disable the display of columns in the menu that can be opened by clicking the icon .
- You can change the order of columns by dragging the column headers.
- If a table column header is green, you can click it to sort the table based on that column's data.
- Name—the name of the report template.
You can sort the table by this column by clicking the title and selecting Ascending or Descending.
You can also search report templates by using the Search field that opens when you click the Name column title.
Regular expressions are used when searching for report templates.
- Schedule—the rate at which reports must be generated using the template. If the report schedule was not configured, the
disabledvalue is displayed. - Created by—the name of the user who created the report template.
- Updated—the date when the report template was last updated.
You can sort the table by this column by clicking the title and selecting Ascending or Descending.
- Last report—the date and time when the last report was generated based on the report template.
- Send by email—the check mark is displayed in this column for the report templates that notify users about generated reports via email notifications.
- Tenant—the name of the tenant that owns the report template.
You can click the name of the report template to open the drop-down list with available commands:
- Run report—use this option to generate report immediately. The generated reports are displayed in the Generated reports tab.
- Edit schedule—use this command to configure the schedule for generating reports and to define users that must receive email notifications about generated reports.
- Edit report template—use this command to configure widgets and the time period for extracting analytics.
- Duplicate report template—use this command to create a copy of the existing report template.
- Delete report template—use this command to delete the report template.
Creating report template
To create report template:
- Open the KUMA web interface and select Reports → Templates.
- Click the New template button.
The New report template window opens.
- In the Tenants drop-down list, select one or more tenants that will own the layout being created.
- In the Time period drop-down list, select the time period from which you require analytics:
- This day (this value is selected by default)
- This week
- This month
- In period—receive analytics for the custom time period.
The upper boundary of the period is not included in the time slice defined by it. In other words, to receive analytics for a 24-hour period, you should configure the period as Day 1, 00:00:00 – Day 2, 00:00:00 instead of Day 1, 00:00:00 – Day 1, 23:59:59.
- Custom—receive analytics for the last N days/weeks/months/years.
- In the Retention field, specify how long you want to store reports that are generated according to this template.
- In the Template name field, enter a unique name for the report template. Must contain 1 to 128 Unicode characters.
- In the Add widget drop-down list, select the required widget and configure its settings.
You can add multiple widgets to the report template.
You can also drag widgets around the window and resize them using the
button that appears when you hover the mouse over a widget.You can edit or delete widgets added to the layout by hovering the mouse over them, clicking the
icon that appears and selecting Edit to change their configuration or Delete to delete them from layout.- Adding widgets
- Editing widget
To edit widget:
- Hover the mouse over the required widget and clicking the icon that appears.
- In the drop-down list select Edit.
The window with widget parameters opens. You can see how the widget will look like by clicking the Preview button.
- Update widget parameters and click the Save button.
- Hover the mouse over the required widget and clicking the
- You can change logo in the report template by clicking the Upload logo button.
When you click the Upload logo button, the Upload window opens and lets you choose the image file for the logo. The image must be a .jpg, .png, or .gif file no larger than 3 MB.
The added logo is displayed in the report instead of KUMA logo.
- If necessary, select the Show CII-related data check box to display data on assets, alerts, and incidents related to critical information infrastructure (CII) in the layout widgets. In this case, these layouts will be available for viewing only by users whose settings have the Access to CII facilities check box selected.
If this check box is cleared, layout widgets will not display data on CII-related assets, alerts, and incidents, even if the user has access to CII objects.
- Click Save.
The new report template is created and is displayed in the Reports → Templates tab of the KUMA web interface. You can run this report manually. If you want to have the reports generated automatically, you must configure the schedule for that.
Page topConfiguring report schedule
To configure the report schedule:
- Open the KUMA web interface and select Reports → Templates.
- In the report templates table, click the name of an existing report template and select Edit schedule in the drop-down list.
The Report settings window opens.
- If you want the report to be generated regularly:
- Turn on the Schedule toggle switch.
In the Recur every group of settings, define how often the report must be generated.
You can specify the frequency of generating reports by days, weeks, months, or years. Depending on the selected period, you should specify the time, day of the week, day of the month or the date of the report generation.
- In the Time field, enter the time when the report must be generated. You can enter the value manually or using the clock icon.
- Turn on the Schedule toggle switch.
- To select the report format and specify the report recipients, configure the following settings:
- In the Send to group of settings, click Add.
- In the Add emails window that opens, in the User group section, click Add group.
- In the field that appears, specify the email address and press Enter or click outside the entry field—the email address will be added. You can add more than one address. Reports are sent to the specified addresses every time you generate a report manually or KUMA generates a report automatically on schedule.
You should configure an SMTP connection so that generated reports can be forwarded by email.
If the recipients who received the report by email are KUMA users, they can download or view the report by clicking the links in the email. If the recipients are not KUMA users, they can follow the links but cannot log in to KUMA, so only attachments are available to them.
We recommend viewing HTML reports by clicking links in the web interface, because at some screen resolutions, the HTML report from the attachment may not be displayed correctly.
If you send an email without attachments, the recipients will have access to reports only by links and only with authorization in KUMA, without restrictions on roles or tenants.
- In the drop-down list, select the report format to send. Available formats: PDF, HTML, , Excel.
- Click Save.

Report schedule is configured.
Page topEditing report template
To edit report template:
- Open the KUMA web interface and select Reports → Templates.
- In the report templates table click the name of the report template and select Edit report template in the drop-down list.
The Edit report template window opens.
You can also open this window in the Reports → Generated reports tab by clicking the name of a generated report and selecting in the drop-down list Edit report template.
- Make the necessary changes:
- Change the list of tenants that own the report template.
- Update the time period from which you require analytics.
- Add widgets
- Change widgets positions by dragging them.
- Resize widgets using the button that appears when you hover the mouse over a widget.
- Edit widgets
To edit widget:
- Hover the mouse over the required widget and clicking the icon that appears.
- In the drop-down list select Edit.
The window with widget parameters opens. You can see how the widget will look like by clicking the Preview button.
- Update widget parameters and click the Save button.
- Hover the mouse over the required widget and clicking the
- Delete widgets by hovering the mouse over them, clicking the icon that appears, and selecting Delete.
- In the field to the right from the Add widget drop-down list enter a new name of the report template. Must contain 1 to 128 Unicode characters.
- Change the report logo by uploading it using the Upload logo button. If the template already contains a logo, you must first delete it.
- Change how long reports generated using this template must be stored.
- If necessary, select or clear the Show CII-related data check box.
- Click Save.
The report template is updated and is displayed in the Reports → Templates tab of the KUMA web interface.
Page topCopying report template
To create a copy of a report template:
- Open the KUMA web interface and select Reports → Templates.
- In the report templates table, click the name of an existing report template, and select Duplicate report template in the drop-down list.
The New report template window opens. The name of the widget is changed to
<Report template> - copy. - Make the necessary changes:
- Change the list of tenants that own the report template.
- Update the time period from which you require analytics.
- Add widgets
- Change widgets positions by dragging them.
- Resize widgets using the button that appears when you hover the mouse over a widget.
- Edit widgets
To edit widget:
- Hover the mouse over the required widget and clicking the icon that appears.
- In the drop-down list select Edit.
The window with widget parameters opens. You can see how the widget will look like by clicking the Preview button.
- Update widget parameters and click the Save button.
- Hover the mouse over the required widget and clicking the
- Delete widgets by hovering the mouse over them, clicking the icon that appears, and selecting Delete.
- In the field to the right from the Add widget drop-down list enter a new name of the report template. Must contain 1 to 128 Unicode characters.
- Change the report logo by uploading it using the Upload logo button. If the template already contains a logo, you must first delete it.
- Click Save.
The report template is created and is displayed in the Reports → Templates tab of the KUMA web interface.
Page topDeleting report template
To delete report template:
- Open the KUMA web interface and select Reports → Templates.
- In the report templates table, click the name of the report template, and select Delete report template in the drop-down list.
A confirmation window opens.
- If you want to delete only the report template, click the Delete button.
- If you want to delete a report template and all the reports that were generated using that template, click the Delete with reports button.
The report template is deleted.
Page topGenerated reports
All reports are generated using report templates. Generated reports are available in the Generated reports tab of the Reports section and are displayed in the table with the following columns:
You can configure a set of table columns and their order, as well as change data sorting:
- You can enable or disable the display of columns in the menu that can be opened by clicking the icon .
- You can change the order of columns by dragging the column headers.
- If a table column header is green, you can click it to sort the table based on that column's data.
- Name—the name of the report template.
You can sort the table by this column by clicking the title and selecting Ascending or Descending.
- Time period—the time period for which the report analytics were extracted.
- Last report—date and time when the report was generated.
You can sort the table by this column by clicking the title and selecting Ascending or Descending.
- Tenant—name of the tenant that owns the report.
- User—name of the user who generated the report manually. If the report was generated by schedule, the value is blank. If the report was generated in KUMA lower than 2.1, the value is blank.
You can click the name of a report to open the drop-down list with available commands:
- Open report—use this command to open the report data window.
- Save as—use this command to save the generated report in the desired format. Available formats: HTML, PDF, CSV, split CSV, Excel.
- Run report—use this option to generate report immediately. Refresh the browser window to see the newly generated report in the table.
- Edit report template—use this command to configure widgets and the time period for extracting analytics.
- Delete report—use this command to delete the report.
Viewing reports
To open report:
- Open the KUMA web interface and select Reports → Generated reports.
- In the report table, click the name of the generated report, and select Open report in the drop-down list.
The new browser window opens with the widgets displaying report analytics. If a widget displays data on events, alerts, incidents, or active lists, you can click its header to open the corresponding section of the KUMA web interface with an active filter and/or search query that is used to display data from the widget. Widgets are subject to default restrictions.
To download the data displayed on each widget in CSV format with UTF-8 encoding, press the CSV button. The downloaded file name has the format <widget name>_<download date (YYYYMMDD)>_<download time (HHMMSS)>.CSV.
To view the full data, download the report in the CSV format with the specified settings from the request.
- You can save the report in the desired format by using the Save as button.
Generating reports
You can generate report manually or configure a schedule to have it generated automatically.
To generate report manually:
- Open the KUMA web interface and select Reports → Templates.
- In the report templates table, click a report template name and select Run report in the drop-down list.
You can also generate report from the Reports → Generated reports tab by clicking the name of an existing report and in the drop-down list selecting Run report.
The report is generated and is displayed in the Reports → Generated reports tab.
To generate reports automatically, configure the report schedule.
Page topSaving reports
To save the report in the desired format:
- Open the KUMA web interface and select Reports → Generated reports.
- In the report table, click the name of the generated report, and in the drop-down list select Save as. Then select the desired format: HTML, PDF, CSV, split CSV, Excel.
The report is saved to the download folder configured in your browser.
You can also save the report in the desired format when you view it.
Page topDeleting reports
To delete report:
- Open the KUMA web interface and select Reports → Generated reports.
- In the report table, click the name of the generated report, and in the drop-down list select Delete report.
A confirmation window opens.
- Click OK.
Widgets
Widgets let you monitor the operation of the application.
Widgets are organized into widget groups, each one related to the analytics type they provide. The following widget groups and widgets are available in KUMA:
- Events—widget for creating analytics based on events.
- Active lists—widget for creating analytics based on active lists of correlators.
- Alerts—group for analytics related to alerts.
The group includes the following widgets:
- Active alerts—number of alerts that have not been closed.
- Active alerts by tenant—number of unclosed alerts for each tenant.
- Alerts by tenant—number of alerts of all statuses for each tenant.
- Unassigned alerts—number of alerts that have the New status.
- Alerts by assignee—number of alerts with the Assigned status. The grouping is by account name.
- Alerts by status—number of alerts that have the New, Opened, Assigned, or Escalated status. The grouping is by status.
- Alerts by severity—number of unclosed alerts grouped by their severity.
- Alerts by rule—number of unclosed alerts grouped by correlation rule.
- Latest alerts—table with information about the last 10 unclosed alerts belonging to the tenants selected in the layout.
- Alerts distribution—number of alerts created during the period configured for the widget.
- Assets—group for analytics related to assets from processed events. This group includes the following widgets:
- Affected assets—table with information about the level of importance of assets and the number of unclosed alerts they are associated with.
- Affected asset categories—categories of assets linked to unclosed alerts.
- Number of assets—number of assets that were added to KUMA.
- Assets in incidents by tenant—number of assets associated with unclosed incidents. The grouping is by tenant.
- Assets in alerts by tenant—number of assets associated with unclosed alerts, grouped by tenant.
- Incidents—group for analytics related to incidents.
The group includes the following widgets:
- Active incidents—number of incidents that have not been closed.
- Unassigned incidents—number of incidents that have the Opened status.
- Incidents distribution—number of incidents created during the period configured for the widget.
- Incidents by assignee—number of incidents with the Assigned status. The grouping is by user account name.
- Incidents by status—number of incidents grouped by status.
- Incidents by severity—number of unclosed incidents grouped by their severity.
- Active incidents by tenant—number of unclosed incidents grouped by tenant available to the user account.
- All incidents—number of incidents of all statuses.
- All incidents by tenant—number of incidents of all statuses, grouped by tenant.
- Affected assets in incidents—number of assets associated with unclosed incidents.
- Affected assets categories in incidents—asset categories associated with unclosed incidents.
- Affected users in Incidents—users associated with incidents.
- Latest incidents—table with information about the last 10 unclosed incidents belonging to the tenants selected in the layout.
- Event sources—group for analytics related to sources of events. The group includes the following widgets:
- Top event sources by alerts number—number of unclosed alerts grouped by event source.
- Top event sources by convention rate—number of events associated with unclosed alerts. The grouping is by event source.
In some cases, the number of alerts generated by sources may be inaccurate. To obtain accurate statistics, it is recommended to specify the Device Product event field as unique in the correlation rule, and enable storage of all base events in a correlation event. However, correlation rules with these settings consume more resources.
- Users—group for analytics related to users from processed events. The group includes the following widgets:
- Affected users in alerts—number of accounts related to unclosed alerts.
- Number of AD users—number of Active Directory accounts received via LDAP during the period configured for the widget.
In the events table, in the event details area, in the alert window, and in the widgets, the names of assets, accounts, and services are displayed instead of the IDs as the values of the SourceAssetID, DestinationAssetID, DeviceAssetID, SourceAccountID, DestinationAccountID, and ServiceID fields. When exporting events to a file, the IDs are saved, but columns with names are added to the file. The IDs are also displayed when you point the mouse over the names of assets, accounts, or services.
Searching for fields with IDs is only possible using IDs.
Basics of managing widgets
The principle of data display in the widget depends on the type of the graph. The following graph types are available in KUMA:
- Pie chart (
 ).
). - Counter (
 ).
). - Table (
 ).
). - Bar chart (
 ).
). - Date Histogram (
 ).
). - Line chart
Basics of general widget management
The name of the widget is displayed in the upper left corner of the widgets. By clicking the link with the name of the widget about events, alerts, incidents, or active lists, you can go to the corresponding section of the KUMA web interface.
A list of tenants for which data is displayed is located under the widget name.
In the upper right corner of the widget, the period for which data is displayed on the widget is indicated ( ). You can view the start and end dates of the period and the time of the last update by hovering the mouse cursor over this icon.
The CSV button is located to the left of the period icon. You can download the data displayed on the widget in CSV format (UTF-8 encoding). The downloaded file name has the format <widget name>_<download date (YYYYMMDD)>_<download time (HHMMSS)>.CSV.
The widget displays data for the period selected in widget or layout settings only for the tenants that are selected in widget or layout settings.
Basics of managing "Pie chart" graphs
A pie chart is displayed under the list of tenants. You can left-click the selected segment of the diagram to go to the relevant section of the KUMA web interface. The data in that section is sorted in accordance with the filters and/or search query specified in the widget.
Under the period icon, you can see the number of events, active lists, assets, alerts, or incidents grouped by the selected criteria for the data display period.
Examples:
|
Basics of managing "Counter" graphs
Graphs of this type display the sum total of selected data.
Example: The Number of assets widget displays the total number of assets added to KUMA. |
Basics of managing "Table" graphs
Graphs of this type display data in a table format.
Example: In the Events widget, for which the SQL query |
Basics of managing "Bar chart" graphs
A bar chart is displayed below the list of tenants. You can left-click the selected diagram section to go to the Events section of the KUMA web interface. The data in that section is sorted in accordance with the filters and/or search query specified in the widget. To the right of the chart, the same data is represented as a table.
Example: In the a Netflow top internal IPs widget for which the SQL query |
Basics of managing "Date Histogram" graphs
A date histogram is displayed below the list of tenants. You can left-click the selected section of the chart to go to the Events section of the KUMA web interface with the relevant data. The data in that section is sorted in accordance with the filters and/or search query specified in the widget. To the right of the chart, the same data is represented as a table.
Example: In the Events widget, for which the SQL query |
Basics of managing "Line chart" graphs
A line chart is displayed below the list of tenants. You can left-click the selected section of the chart to go to the Events section of the KUMA web interface with the relevant data. The data in that section is sorted in accordance with the filters and/or search query specified in the widget. To the right of the chart, the same data is represented as a table.
Example: In the Events widget, for which the SQL query |
Special considerations for displaying data in widgets
Limitations for the displayed data
For improved readability, KUMA has limitations on the data displayed in widgets depending on its type:
- Pie chart displays a maximum of 20 slices.
- Bar chart displays a maximum of 40 bars.
- Table displays a maximum of 500 entries.
- Date histogram displays a maximum of 365 days.
Data that exceeds the specified limitations is displayed in the widget in the Other category.
You can download the full data used for building analytics in the widget in CSV format.
Summing up the data
The format of displaying the total sum of data on date histogram, bar chart and pie chart depends on the locale:
- English locale: decades (every three digits) are separated by commas, the decimal part is separated by a period.
- Russian locale: decades (every three digits) are separated by spaces, the decimal part is separated by a comma.
Creating a widget
You can create a widget in a dashboard layout while creating or editing the layout.
To create a widget:
- Create a layout or switch to editing mode for the selected layout.
- Click Add widget.
- Select a widget type from the drop-down list.
This opens the widget settings window.
- Edit the widget settings.
- If you want to see how the data will be displayed in the widget, click Preview.
- Click Add.
The widget appears in the dashboard layout.
Page topEditing a widget
To edit widget:
- In the KUMA web interface, select the Dashboard section.
- Expand the list in the upper right corner of the window.
- Hover the mouse cursor over the relevant layout.
- Click the button.
The Customizing layout window opens.
- In the widget you want to edit, click .
- Select Edit.
This opens the widget settings window.
- Edit the widget settings.
- Click Save in the widget settings window.
- Click Save in the Customizing layout window.
The widget is edited.
Page topDeleting a widget
To delete a widget:
- In the KUMA web interface, select the Dashboard section.
- Expand the list in the upper right corner of the window.
- Hover the mouse cursor over the relevant layout.
- Click the button.
The Customizing layout window opens.
- In the widget you want to delete, click .
- Select Delete.
- This opens a confirmation window; in that window, click OK.
- Click the Save button.
The widget is deleted.
Page top"Events" widget
You can use the Events widget to get analytics based on SQL queries.
When creating this type of widget, you must set values for the following settings:
The  tab:
tab:
- Graph is the type of the graph. The following graph types are available:
- Pie chart.
- Bar chart.
- Counter.
- Line chart.
- Table.
- Date Histogram.
- Tenant is the tenant for which data is displayed in the widget.
You can select multiple tenants.
By default, data is displayed for tenants that have been selected in layout settings.
- Period is the period for which data is displayed in the widget. The following periods are available:
- As layout means data is displayed for the period selected for the layout.
This is the default setting.
- 1 hour—data is displayed for the previous hour.
- 1 day—data is displayed for the previous day.
- 7 days—data is displayed for the previous 7 days.
- 30 days—data is displayed for the previous 30 days.
- In period—data is displayed for a custom time period.
If you select this option, use the opened calendar to select the start and end dates of the period and click Apply Filter. The date and time format depends on your operating system's settings. You can also manually change the date values if necessary.
The upper boundary of the period is not included in the time slice defined by it. In other words, to receive analytics for a 24-hour period, you should configure the period as Day 1, 00:00:00 – Day 2, 00:00:00 instead of Day 1, 00:00:00 – Day 1, 23:59:59.
- As layout means data is displayed for the period selected for the layout.
- Show data for previous period—enable the display of data for two periods at the same time: for the current period and for the previous period.
- Storage is the storage that is searched for events.
- The SQL query field (
 ) lets you manually enter a query for filtering and searching events.
You can also create a query in Builder by clicking
.How to create a query in Builder
To create a query in Builder:
- Specify the values of the following parameters:
- SELECT—event fields that should be returned. The number of available fields depends on the selected graph type.
- In the drop-down list on the left, select the event fields for which you want to display data in the widget.
- The middle field displays what the selected field is used for in the widget: metric or value.
If you selected the Table graph type, in the middle fields, you must specify column names using ANSII-ASCII characters.
- In the drop-down list on the right, you can select an operation to be performed on the data:
- count—event count. This operation is available only for the ID event field. Used by default for line charts, pie charts, bar charts, and counters. This is the only option for date histogram.
- max is the maximum value of the event field from the event selection.
- min is the minimum value of the event field from the event selection.
- avg is the average value of the event field from the event selection.
- sum is the sum of event field values from the event selection.
- SOURCE is the type of the data source. Only the events value is available for selection.
- WHERE—conditions for filtering events.
- In the drop-down list on the left, select the event field that you want to use for filtering.
- Select the necessary operator from the middle drop-down list. The available operators depend on the type of value of the selected event field.
- In the drop-down list on the right, enter the value of the condition. Depending on the selected type of field, you may have to manually enter the value, select it from the drop-down list, or select it on the calendar.
You can add search conditions by clicking Add condition or remove search conditions by clicking
 .
.You can also add groups of conditions by clicking Add group. By default, groups of conditions are added with the AND operator, but you can change the it if necessary. Available values: AND, OR, NOT. Group conditions are deleted using the Delete group button.
- GROUP BY—event fields or aliases to be used for grouping the returned data. This parameter is not available for Counter graph type.
- ORDER BY—columns used as the basis for sorting the returned data. This parameter is not available for the Date Histogram and Counter graph types.
- In the drop-down list to the left, select the value that will be used for sorting.
- Select the sort order from the drop-down list on the right: ASC for ascending, DESC for descending.
- For Table type graphs, you can add sorting conditions by clicking Add column.
- LIMIT is the maximum number of data points for the widget. This parameter is not available for the Date Histogram and Counter graph types.
- SELECT—event fields that should be returned. The number of available fields depends on the selected graph type.
- Click Apply.
Example of search conditions in the query builder
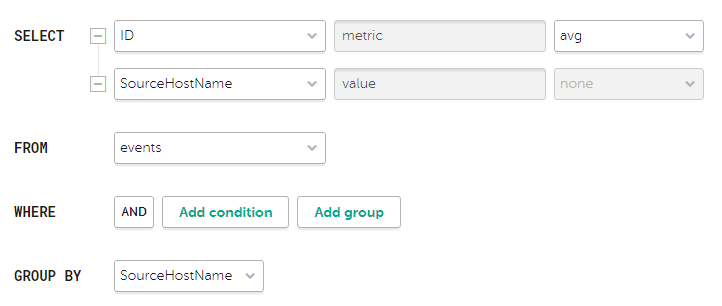
Search condition parameters for the widget showing average bytes received per host
The "metric" and "value" aliases in SQL queries cannot be edited for any type of event analytics widget, except tables.
Aliases in widgets of the Table type can contain Latin and Cyrillic characters, as well as spaces. When using spaces or Cyrillic, the alias must be enclosed in quotation marks:
"An alias with a space",`Another alias`.When displaying data for the previous period, sorting by the
count(ID)parameter may not work correctly. It is recommended to sort by the metric parameter. For example,SELECT count(ID) AS "metric", Name AS "value" FROM `events` GROUP BY Name ORDER BY metric ASC LIMIT 250.In the Counter type widgets you must specify the method of data processing for the values of the
SELECTfunction:count,max,min,avg,sum. - Specify the values of the following parameters:
The  tab:
tab:
The tab is displayed if on the tab in the Graph field you have selected one of the following values: Bar chart, Line chart, Date Histogram.
- The Y-min and Y-max values set the scale of the Y axis.
- The X-min and X-max values set the scale of the X axis.
Negative values can be displayed on chart axes. This is due to the scaling of charts on the widget and can be fixed by setting zero as the minimum chart values instead of Auto.
- Line-width is the width of the line on the graph. This field is displayed for the "Line chart" graph type.
- Point size is the size of the pointer on the graph. This field is displayed for the "Line chart" graph type.
The  tab:
tab:
- Name is the name of the widget.
- Description is the description of the widget.
- Color is a drop-down list where you can select the color for displaying information:
- default for your browser's default font color
- green
- red
- blue
- yellow
- Horizontal makes the histogram horizontal instead of vertical.
When this option is enabled, when a widget displays a large amount of data, horizontal scrolling is not available and all available information is fit into the fixed size of the widget. If there is a lot of data to display, it is recommended to increase the widget size.
- Show total shows sums total of the values.
- Legend displays a legend for analytics.
The toggle switch is turned on by default.
- Show nulls in legend displays parameters with a null value in the legend for analytics.
The toggle switch is turned off by default.
- Decimals—the field to enter the number of decimals to which the displayed value must be rounded off.
- Period segments length (available for graphs of the Date Histogram type) sets the length of segments into which you want to divide the period.
"Active lists" widget
You can use the Active lists widget to get analytics based on SQL queries.
When creating this type of widget, you must set values for the following settings:
The tab:
- Graph is the type of the graph. The following graph types are available:
- Bar chart.
- Pie chart.
- Counter.
- Table.
- Tenant is the tenant for which data is displayed in the widget.
You can select multiple tenants.
By default, data is displayed for tenants that have been selected in layout settings.
- Correlator is the name of the correlator that contains the active list for which you want to receive data.
- Active list is the name of the active list for which you want to receive data.
The same active list can be used by different correlators. However, a separate entity of the active list is created for each correlator. Therefore, the contents of the active lists used by different correlators differ even if the active lists have the same names and IDs.
- The SQL query field lets you manually enter a query for filtering and searching active list data.
The query structure is similar to that used in event search.
When creating a query based on active lists, you must consider the following:
- For the FROM function, you must specify the `records` value.
- If you want to receive data for fields whose names contain spaces and Cyrillic characters, you must also enclose such names in quotes in the query:
- In the SELECT function, enclose aliases in double quotes or backticks: "alias", `another alias`.
- In the ORDER BY function, enclose aliases in backticks: `another alias`.
- Event field values are enclosed in straight quotes: WHERE DeviceProduct = 'Microsoft'.
Names of event fields do not need to be enclosed in quotes.
If the name of an active list field begins or ends with spaces, these spaces are not displayed by the widget. The field name must not contain spaces only.
If the values of the active list fields contain trailing or leading spaces, it is recommended to use the LIKE '%field value%' function to search by them.
- In your query, you can use service fields: _key (the field with the keys of active list records) and _count (the number of times this record has been added to the active list), as well as custom fields.
- The "metric" and "value" aliases in SQL queries cannot be edited for any type of active lists analytics widget, except tables.
- If a date and time conversion function is used in an SQL query (for example, fromUnixTimestamp64Milli) and the field being processed does not contain a date and time, an error will be displayed in the widget. To avoid this, use functions that can handle a null value. Example: SELECT _key, fromUnixTimestamp64Milli(toInt64OrNull(DateTime)) as Date FROM `records` LIMIT 250.
- Large values for the LIMIT function may lead to browser errors.
- If you select Counter as the graph type, you must specify the method of data processing for the values of the SELECT function: count, max, min, avg, sum.
- You can get the names of the tenants in the widget instead of their IDs.
Special considerations apply when using aliases in SQL functions and SELECT, you can use double quotes and backticks: ", `.
If you selected Counter as the graph type, aliases can contain Latin and Cyrillic characters, as well as spaces. When using spaces or Cyrillic, the alias must be enclosed in quotation marks: "An alias with a space", `Another alias`.
When displaying data for the previous period, sorting by the count(ID) parameter may not work correctly. It is recommended to sort by the metric parameter. For example, SELECT count(ID) AS "metric", Name AS "value" FROM `events` GROUP BY Name ORDER BY metric ASC LIMIT 250.
Sample SQL queries for receiving analytics based on active lists:
SELECT * FROM `records` WHERE "Event source" = 'Johannesburg' LIMIT 250This query returns the key of the active list where the field name is "Event source" and the value of this field is "Johannesburg".
SELECT count(_key) AS metric, Status AS value FROM `records` GROUP BY value ORDER BY metric DESC LIMIT 250Query for a pie chart, which returns the number of keys in the active list ('count' aggregation over the '_key' field) and all variants of the Status custom field. The widget displays a pie chart with the total number of records in the active list, divided proportionally by the number of possible values for the Status field.
SELECT Name, Status, _count AS Number FROM `records` WHERE Description ILIKE '%ftp%' ORDER BY Name DESC LIMIT 250Query for a table, which returns the values of the Name and Status custom fields, as well as the service field '_count' for those records of the active list in which the value of the Description custom field matches ILIKE '%ftp%'. The widget displays a table with the Status, Name, and Number columns.
The tab:
This tab is displayed if on the tab, in the Graph field, you have selected Bar chart.
- The Y-min and Y-max values set the scale of the Y axis.
- The X-min and X-max values set the scale of the X axis.
Negative values can be displayed on chart axes. This is due to the scaling of charts on the widget and can be fixed by setting zero as the minimum chart values instead of Auto.
The tab:
- Name is the name of the widget.
- Description is the description of the widget.
- Color is a drop-down list where you can select the color for displaying information:
- default for your browser's default font color
- green
- red
- blue
- yellow
- Horizontal makes the histogram horizontal instead of vertical.
When this setting is enabled, all available information is fitted into the configured widget size. If the amount of data is great, you can increase the size of the widget to display it optimally.
- Show total shows sums total of the values.
- Legend displays a legend for analytics.
The toggle switch is turned on by default.
- Show nulls in legend displays parameters with a null value in the legend for analytics.
The toggle switch is turned off by default.
Other widgets
This section describes the settings of all widgets except the Events widgets and Active lists widget.
The set of parameters available for a widget depends on the type of graph that is displayed on the widget. The following graph types are available in KUMA:
- Pie chart ().
- Counter ().
- Table ().
- Bar chart ().
- Date Histogram ().
- Line chart.
Settings for pie charts
- Name is the name of the widget.
- Description is the description of the widget.
- Tenant is the tenant for which data is displayed in the widget.
You can select multiple tenants.
By default, data is displayed for tenants that have been selected in layout settings.
- Period is the period for which data is displayed in the widget. The following periods are available:
- As layout means data is displayed for the period selected for the layout.
This is the default setting.
- 1 hour—data is displayed for the previous hour.
- 1 day—data is displayed for the previous day.
- 7 days—data is displayed for the previous 7 days.
- 30 days—data is displayed for the previous 30 days.
- In period—data is displayed for a custom time period.
If you select this option, use the opened calendar to select the start and end dates of the period and click Apply Filter. The date and time format depends on your operating system's settings. You can also manually change the date values if necessary.
The upper boundary of the period is not included in the time slice defined by it. In other words, to receive analytics for a 24-hour period, you should configure the period as Day 1, 00:00:00 – Day 2, 00:00:00 instead of Day 1, 00:00:00 – Day 1, 23:59:59.
- As layout means data is displayed for the period selected for the layout.
- Show total shows sums total of the values.
- Legend displays a legend for analytics.
The toggle switch is turned on by default.
- Show nulls in legend displays parameters with a null value in the legend for analytics.
The toggle switch is turned off by default.
- Decimals—the field to enter the number of decimals to which the displayed value must be rounded off.
Settings for counters
- Name is the name of the widget.
- Description is the description of the widget.
- Tenant is the tenant for which data is displayed in the widget.
You can select multiple tenants.
By default, data is displayed for tenants that have been selected in layout settings.
- Period is the period for which data is displayed in the widget. The following periods are available:
- As layout means data is displayed for the period selected for the layout.
This is the default setting.
- 1 hour—data is displayed for the previous hour.
- 1 day—data is displayed for the previous day.
- 7 days—data is displayed for the previous 7 days.
- 30 days—data is displayed for the previous 30 days.
- In period—data is displayed for a custom time period.
If you select this option, use the opened calendar to select the start and end dates of the period and click Apply Filter. The date and time format depends on your operating system's settings. You can also manually change the date values if necessary.
The upper boundary of the period is not included in the time slice defined by it. In other words, to receive analytics for a 24-hour period, you should configure the period as Day 1, 00:00:00 – Day 2, 00:00:00 instead of Day 1, 00:00:00 – Day 1, 23:59:59.
- As layout means data is displayed for the period selected for the layout.
Settings for tables
- Name is the name of the widget.
- Description is the description of the widget.
- Tenant is the tenant for which data is displayed in the widget.
You can select multiple tenants.
By default, data is displayed for tenants that have been selected in layout settings.
- Period is the period for which data is displayed in the widget. The following periods are available:
- As layout means data is displayed for the period selected for the layout.
This is the default setting.
- 1 hour—data is displayed for the previous hour.
- 1 day—data is displayed for the previous day.
- 7 days—data is displayed for the previous 7 days.
- 30 days—data is displayed for the previous 30 days.
- In period—data is displayed for a custom time period.
If you select this option, use the opened calendar to select the start and end dates of the period and click Apply Filter. The date and time format depends on your operating system's settings. You can also manually change the date values if necessary.
The upper boundary of the period is not included in the time slice defined by it. In other words, to receive analytics for a 24-hour period, you should configure the period as Day 1, 00:00:00 – Day 2, 00:00:00 instead of Day 1, 00:00:00 – Day 1, 23:59:59.
- As layout means data is displayed for the period selected for the layout.
- Show data for previous period—enable the display of data for two periods at the same time: for the current period and for the previous period.
- Color is a drop-down list where you can select the color for displaying information:
- default for your browser's default font color
- green
- red
- blue
- yellow
- Decimals—the field to enter the number of decimals to which the displayed value must be rounded off.
Settings for Bar charts and Date Histograms
The tab:
- The Y-min and Y-max values set the scale of the Y axis.
- The X-min and X-max values set the scale of the X axis.
Negative values can be displayed on chart axes. This is due to the scaling of charts on the widget and can be fixed by setting zero as the minimum chart values instead of Auto.
- Decimals—the field to enter the number of decimals to which the displayed value must be rounded off.
The tab:
- Name is the name of the widget.
- Description is the description of the widget.
- Tenant is the tenant for which data is displayed in the widget.
You can select multiple tenants.
By default, data is displayed for tenants that have been selected in layout settings.
- Period is the period for which data is displayed in the widget. The following periods are available:
- As layout means data is displayed for the period selected for the layout.
This is the default setting.
- 1 hour—data is displayed for the previous hour.
- 1 day—data is displayed for the previous day.
- 7 days—data is displayed for the previous 7 days.
- 30 days—data is displayed for the previous 30 days.
- In period—data is displayed for a custom time period.
If you select this option, use the opened calendar to select the start and end dates of the period and click Apply Filter. The date and time format depends on your operating system's settings. You can also manually change the date values if necessary.
The upper boundary of the period is not included in the time slice defined by it. In other words, to receive analytics for a 24-hour period, you should configure the period as Day 1, 00:00:00 – Day 2, 00:00:00 instead of Day 1, 00:00:00 – Day 1, 23:59:59.
- As layout means data is displayed for the period selected for the layout.
- Show data for previous period—enable the display of data for two periods at the same time: for the current period and for the previous period.
- Color is a drop-down list where you can select the color for displaying information:
- default for your browser's default font color
- green
- red
- blue
- yellow
- Horizontal makes the histogram horizontal instead of vertical.
When this setting is enabled, all available information is fitted into the configured widget size. If the amount of data is great, you can increase the size of the widget to display it optimally.
- Show total shows sums total of the values.
- Legend displays a legend for analytics.
The toggle switch is turned on by default.
- Show nulls in legend displays parameters with a null value in the legend for analytics.
The toggle switch is turned off by default.
- Period segments length (available for graphs of the Date Histogram type) sets the length of segments into which you want to divide the period.
Displaying tenant names in "Active list" type widgets
If you want the names of tenants to be displayed in 'Active list' type widgets instead of tenant IDs, in correlation rules of the correlator, configure the function for populating the active list with information about the corresponding tenant.
The configuration process involves the following steps:
- Export the list of tenants.
- Create a dictionary of the Table type.
- Import the list of tenants obtained at step 1 into the dictionary created at step 2 of these instructions.
- Add a local variable with the dict function for mapping the tenant name to tenant ID to the correlation rule.
Example:
- Variable:
TenantName - Value:
dict ('<Name of the previously created dictionary with tenants>', TenantID)
- Variable:
- Add a Set action to the correlation rule, which writes the value of the previously created variable to the active list in the key-value format. As the key, specify the field of the active list (for example,
Tenant), and in the value field, specify the variable (for example,$TenantName).
When this rule triggers, the name of the tenant mapped by the dict function to the ID in the tenant dictionary is placed in the active list. When creating widgets based on active lists, the widget displays the name of the tenant instead of the tenant ID.
Page topWorking with alerts
Alerts are created when a sequence of events is received that triggers a correlation rule. You can find more information about alerts in this section.
In the Alerts section of the KUMA web interface, you can view and process the alerts registered by the program. Alerts can be filtered. When you click the alert name, a window with its details opens.
The alert date format depends on the localization language selected in the application settings. Possible date format options:
- English localization: YYYY-MM-DD.
- Russian localization: DD.MM.YYYY.
Alert life cycle
Below is the life cycle of an alert:
- KUMA creates an alert when a correlation rule is triggered. The alert is named after the correlation rule that generated it. Alert is assigned the New status.
Alerts with the New status continue to be updated with data when correlation rules are triggered. If the alert status changes, the alert is no longer updated with new events, and if the correlation rule is triggered again, a new alert is created.
- A security officer assigns the alert to an operator for investigation. The alert status changes to assigned.
- The operator performs one of the following actions:
- Close the alert as false a positive (alert status changes to closed).
- Respond to the threat and close the alert (alert status changes to closed).
- Creates an incident based on the alert (the alert status changes to In incident).
Alert overflow
Each alert and its related events cannot exceed the size of 16 MB. When this limit is reached:
- New events can no longer be linked to the alert.
- The alert has an Overflowed tag displayed in the Detected column. The same tag is displayed in the Details on alert section of the alert details window.
Overflowed alerts should be handled as soon as possible because new events are not added to overflowed alerts. You can filter out all events that could be linked to an alert after the overflow by clicking the All possible related events link.
Alert segmentation
Using the segmentation rules, the stream of correlation events of the same type can be divided to create more than one alert.
Configuring alerts table
The main part of the Alerts section shows a table containing information about registered alerts.
The following columns are displayed in the alerts table:
- Priority (
 )—shows the importance of a possible security threat: Critical
  , High
  , Medium
  , or Low
  .
. - Name—alert name.
If Overflowed tag is displayed next to the alert name, it means the alert size has reached or is about to reach the limit and should be processed as soon as possible.
- Status—current status of an alert:
- New—a new alert that hasn't been processed yet.
- Assigned—the alert has been processed and assigned to a security officer for investigation or response.
- Closed—the alert was closed. Either it was a false alert, or the security threat was eliminated.
- Escalated—an incident was generated based on this alert.
- Assigned to—the name of the security officer the alert was assigned to for investigation or response.
- Incident—name of the incident to which this alert is linked.
- First seen—the date and time when the first correlation event of the event sequence was created, triggering creation of the alert.
- Last seen—the date and time when the last correlation event of the event sequence was created, triggering creation of the alert.
- Categories—categories of alert-related assets with the highest severity. No more than three categories are displayed.
- Tenant—the name of the tenant that owns the alert.
- CII—an indication whether the related to the alert assets are the CII objects. The column is hidden from the users who do not have access to CII objects.
You can view the alert filtering tools by clicking the column headers. When filtering alerts based on a specific parameter, the corresponding header of the alerts table is highlighted in yellow.
Click the button to configure the displayed columns of the alerts table.
In the Search field, you can enter a regular expression for searching alerts based on their related assets, users, tenants, and correlation rules. Parameters that can be used for a search:
- Assets: name, FQDN, IP address.
- Active Directory accounts: attributes displayName, SAMAccountName, and UserPrincipalName.
- Correlation rules: name.
- KUMA users who were assigned alerts: name, login, email address.
- Tenants: name.
Filtering alerts
In KUMA, you can perform alert selection by using the filtering and sorting tools in the Alerts section.
The filter settings can be saved. Existing filters can be deleted.
Page topSaving and selecting an alert filter
In KUMA, you can save changes to the alert table settings as filters. Filters are saved on the KUMA Core server and are available to all KUMA users of the tenant for which they were created.
To save the current filter settings:
- In the Alerts section of KUMA open the Filters drop-down list.
- Select Save current filter.
A field will appear for entering the name of the new filter and selecting the tenant that will own it.
- Enter a name for the filter. The name must be unique for alert filters, incident filters, and event filters.
- In the Tenant drop-down list, select the tenant that will own the filter and click Save.
The filter is saved.
To select a previously saved filter:
- In the Alerts section of KUMA open the Filters drop-down list.
- Select the relevant filter.
To select the default filter, put an asterisk to the left of the relevant filter name in the Filters drop-down list.
The filter is selected.
To reset the current filter settings,
Open the Filters drop-down list and select Clear filters.
Page topDeleting an alert filter
To delete a previously saved filter:
- In the Alerts section of KUMA open the Filters drop-down list.
- Click next to the configuration that you want to delete.
- Click OK.
The filter is deleted for all KUMA users.
Page topViewing details on an alert
To view details on an alert:
- In the program web interface window, select the Alerts section.
The alerts table is displayed.
- Click the name of the alert whose details you want to view.
This opens a window containing information about the alert.
The upper part of the alert details window contains a toolbar and shows the alert severity and the user name to which the alert is assigned. In this window, you can process the alert: change its severity, assign it to a user, and close and create an incident based on the alert.
Details on alert section
This section lets you view basic information about an alert. It contains the following data:
- Correlation rule severity is the severity of the correlation rule that triggered the creation of the alert.
- Max asset category priority—the highest priority of an asset category assigned to assets related to this alert. If multiple assets are related to the alert, the largest value is displayed.
- Linked to incident—if the alert is linked to an incident, the name and status of the alert are displayed. If the alert is not linked to an incident, the field is blank.
- First seen—the date and time when the first correlation event of the event sequence was created, triggering creation of the alert.
- Last seen—the date and time when the last correlation event of the event sequence was created, triggering creation of the alert.
- Alert ID—the unique identifier of an alert in KUMA.
- Tenant—the name of the tenant that owns the alert.
- Correlation rule—the name of the correlation rule that triggered the creation of the alert. The rule name is represented as a link that can be used to open the settings of this correlation rule.
- Overflowed is a tag meaning that the alert size has reached or will soon reach the limit of 16 MB and the alert must be handled. New events are not added to the overflowed alerts, but you can click the All possible related events link to filter all events that could be related to the alert if there were no overflow.
A quick alert overflow may mean that the corresponding correlation rule is configured incorrectly, and this leads to frequent triggers. Overflowed alerts should be handled as soon as possible to correct the correlation rule if necessary.
Related events section
This section contains a table of events related to the alert. If you click the ![]() icon near a correlation rule, the base events from this correlation rule will be displayed. Events can be sorted by severity and time.
icon near a correlation rule, the base events from this correlation rule will be displayed. Events can be sorted by severity and time.
Selecting an event in the table opens the details area containing information about the selected event. The details area also displays the Detailed view button, which opens a window containing information about the correlation event.
The Find in events links below correlation events and the Find in events button to the right of the section heading are used to go to alert investigation.
You can use the Download events button to download information about related events into a CSV file (in UTF-8 encoding). The file contains columns that are populated in at least one related event.
Some CSV file editors interpret the separator value (for example, \n) in the CSV file exported from KUMA as a line break, not as a separator. This may disrupt the line division of the file. If you encounter a similar issue, you may need to additionally edit the CSV file received from KUMA.
In the events table, in the event details area, in the alert window, and in the widgets, the names of assets, accounts, and services are displayed instead of the IDs as the values of the SourceAssetID, DestinationAssetID, DeviceAssetID, SourceAccountID, DestinationAccountID, and ServiceID fields. When exporting events to a file, the IDs are saved, but columns with names are added to the file. The IDs are also displayed when you point the mouse over the names of assets, accounts, or services.
Searching for fields with IDs is only possible using IDs.
Related endpoints section
This section contains a table of assets related to the alert. Asset information comes from events that are related to the alert. You can search for assets by using the Search for IP addresses or FQDN field. Assets can be sorted using the Count and Endpoint columns.
This section also displays the assets related to the alert. Clicking the name of the asset opens the Asset details window.
You can use the Download assets button to download information about related assets into a CSV file (in UTF-8 encoding). The following columns are available in the file: Count, Name, IP address, FQDN, Categories.
Related users section
This section contains a table of users related to the alert. User information comes from events that are related to the alert. You can search for users using the Search for users field. Users can be sorted by the Count, User, User principal name and Email columns.
You can use the Download users button to download information about related users into a CSV file (in UTF-8 encoding). The following columns are available in the file: Count, User, User principal name, Email, Domain, Tenant.
Change log section
This section contains entries about changes made to the alert by users. Changes are automatically logged, but it is also possible to add comments manually. Comments can be sorted by using the Time column.
If necessary, you can enter a comment for the alert in the Comment field and click Add to save it.
Changing alert names
To change the alert name:
- In the KUMA web interface window, select the Alerts section.
The alerts table is displayed.
- Click the name of the alert whose details you want to view.
This opens a window containing information about the alert.
- In the upper part of the window, click
 and in the field that opens, enter the new name of the alert. To confirm the name, press ENTER or click outside the entry field.
Alert name is changed.
Processing alerts
You can change the alert severity, assign an alert to a user, close the alert, or create an incident based on the alert.
To process an alert:
- Select required alerts using one of the methods below:
- In the Alerts section of the KUMA web interface, click the alert whose information you want to view.
The Alert window opens and provides an alert processing toolbar at the top.
- In the Alerts section of the KUMA web interface, select the check box next to the required alert. It is possible to select more than one alert.
Alerts with the closed status cannot be selected for processing.
A toolbar will appear at the bottom of the window.
- In the Alerts section of the KUMA web interface, click the alert whose information you want to view.
- If you want to change the severity of an alert, select the required value in the Priority drop-down list:
- Low
- Medium
- High
- Critical
The severity of the alert changes to the selected value.
- If you want to assign an alert to a user, select the relevant user from the Assign to drop-down list.
You can assign the alert to yourself by selecting Me.
The status of the alert will change to Assigned and the name of the selected user will be displayed in the Assign to drop-down list.
- In the Related users section, select a user and configure Active Directory response settings.
- After the related user is selected, in the Account details window that opens, click Response via Active Directory.
- In the AD command drop-down list, select one of the following values:
- Add account to group
- Remove account from group
- Reset account password
- Block account
- Click Apply.
- If required, create an incident based on the alert:
- Click Create incident.
The window for creating an incident will open. The alert name is used as the incident name.
- Update the desired incident parameters and click the Save button.
The incident is created, and the alert status is changed to Escalated. An alert can be unlinked from an incident by selecting it and clicking Unlink.
- Click Create incident.
- If you want to close the alert:
- Click Close alert.
A confirmation window opens.
- Select the reason for closing the alert:
- Responded. This means the appropriate measures were taken to eliminate the security threat.
- Incorrect data. This means the alert was a false positive and the received events do not indicate a security threat.
- Incorrect correlation rule. This means the alert was a false positive and the received events do not indicate a security threat. The correlation rule may need to be updated.
- Click OK.
The status of the alert is changed to Closed. Alerts with this status are no longer updated with new correlation events and aren't displayed in the alerts table unless the Closed check box is selected in the Status drop-down list in the alerts table. You cannot change the status of a closed alert or assign it to another user.
- Click Close alert.
Alert investigation
Alert investigation is used when you need to find more information about the threat that triggered the alert — is the threat real, what is its origin, what elements of the network environment are affected by it, how should the threat be dealt with. Studying the events related to the correlation events that triggered an alert can help you determine the course of action.
The alert investigation mode is enabled in KUMA when you click the Find in events link in the alert window or the correlation event window. When the alert investigation mode is enabled, the events table is shown with filters automatically set to match the events from the alert or correlation event. The filters also match the time period of the alert duration or the time when the correlation event was registered. You can change these filters to find other events and learn more about the processes related to the threat.
An additional  drop-down list becomes available in alert investigation mode:
- All events—view all events.
- Related to alert (selected by default)—view only events related to the alert.
When filtering events related to an alert, there are limitations on the complexity of SQL search queries.
You can manually assign an event of any type except the correlation event to an alert. Only events that are not related to the alert can be linked to it.
You can create and save event filters in alert investigation mode. When using this filter in normal mode, all events that match the filter criteria are selected regardless of whether or not they are related to the alert that was selected for alert investigation.
To link an event to an alert:
- In the Alerts section of the KUMA web interface, click the alert that you want to link to the event.
The Alert window opens.
- In the Related events section, click the Find in events button.
The events table is opened and displayed with active date and time filters matching the date and time of events linked to the alert. The columns show the settings used by the correlation rule to generate the alert. The Link to alert column is also added to the events table showing the events linked to the alert.
- In the drop-down list select All events.
- If necessary, modify the filters to find the event that you need to link to the alert.
- Select the relevant event and click the Link to alert button in the lower part of the event details area.
The event will be linked to the alert. You can unlink this event from the alert by clicking in the Unlink from alert detailed view.
When an event is linked to or unlinked from an alert, a corresponding entry is added to the Change log section in the Alert window. You can click the link in this entry to open the details area and unlink or link the event to the alert by clicking the corresponding button.
Page topRetention period for alerts and incidents
Alerts and incidents are stored in KUMA for a year by default. This period can be changed by editing the application startup parameters in the file /usr/lib/systemd/system/kuma-core.service on the KUMA Core server.
To change the retention period for alerts and incidents:
- Log in to the OS of the server where the KUMA Core is installed.
- In the /usr/lib/systemd/system/kuma-core.service file, edit the following string by inserting the necessary number of days:
ExecStart=/opt/kaspersky/kuma/kuma core --alerts.retention <number of days to store alerts and incidents> --external :7220 --internal :7210 --mongo mongodb://localhost:27017 - Restart KUMA by running the following commands in sequence:
systemctl daemon-reloadsystemctl restart kuma-core
The retention period for alerts and incidents will be changed.
Page topAlert notifications
Standard KUMA notifications are sent by email when alerts are generated and assigned. You can configure delivery of alert generation notifications based on a custom email template.
To configure delivery of alert generation notifications based on a custom template:
- In the KUMA web interface, open Settings → Alerts → Notification rules.
- Select the tenant for which you want to create a notification rule:
- If the tenant already has notification rules, select it in the table.
- If the tenant has no notification rules, click Add tenant and select the relevant tenant from the Tenant drop-down list.
- In the Notification rules settings block, click Add and specify the notification rule settings:
- Name (required)—specify the notification rule name in this field.
- Recipient emails (required)—in this settings block, you can use the Email button to add the email addresses to which you need to send notifications about alert generation. Addresses are added one at a time.
Cyrillic domains are not supported. For example, a notification cannot be sent to
login@domain.us. - Correlation rules (required)—in this settings block, you must select one or more correlation rules that, when triggered, will cause notification sending.
The window displays a tree structure representing the correlation rules from the shared tenant and the user-selected tenant. To select a rule, select the check box next to it. You can select the check box next to a folder to select all correlation rules in that folder and its subfolders.
- Template (required)—in this settings block, you must select an email template that will be used to create the notifications. To select a template, click the
 icon, select the required template in the opened window, and click Save.
You can create a template by clicking the plus icon or edit the selected template by clicking the pencil icon.
- Disabled—by selecting this check box, you can disable the notification rule.
- Click Save.
The notification rule is created. When an alert is created based on the selected correlation rules, notifications created based on custom email templates will be sent to the specified email addresses. Standard KUMA notifications about the same event will not be sent to the specified addresses.
To disable notification rules for a tenant:
- In the KUMA web interface, open Settings → Alerts → Notification rules and select the tenant whose notification rules you want to disable.
- Select the Disabled check box.
- Click Save.
The notification rules of the selected tenant are disabled.
For disabled notification rules, the correctness of the specified parameters is not checked; at the same time, notifications cannot be enabled for a tenant if incorrect rules exist. If you create or edit individual notification rules with tenant notification rules disabled, before enabling tenant notification rules, it is recommended to: 1) disable all individual notification rules, 2) enable tenant notification rules, 3) enable individual notification rules one by one.
Page topWorking with incidents
In the Incidents section of the KUMA web interface, you can create, view and process incidents. You can also filter incidents if needed. Clicking the name of an incident opens a window containing information about the incident.
Incidents can be exported to RuCERT.
The retention period for incidents is one year, but this setting can be changed.
The date format of the incident depends on the localization language selected in the application settings. Possible date format options:
- English localization: YYYY-MM-DD.
- Russian localization: DD.MM.YYYY.
About the incidents table
The main part of the Incidents section shows a table containing information about registered incidents. If required, you can change the set of columns and the order in which they are displayed in the table.
How to customize the incidents table
- Click the icon in the top right corner of the incidents table.
The table customization window opens.
- Select the check boxes opposite the settings that you want to view in the table.
When you select a check box, the events table is updated and a new column is added. When a check box is cleared, the column disappears.
You can search for table parameters using the Search field.
By pressing the Default button, the following columns are selected for display:
- Name.
- Threat duration.
- Assigned.
- Created.
- Tenant.
- Status.
- Hits count.
- Priority.
- Affected asset categories.
- Change the display order of the columns as needed by dragging the column headings.
- If you want to sort the incidents by a specific column, click its title and select one of the available options in the drop-down list: Ascending or Descending.
- To filter incidents by a specific parameter, click on the column header and select the required filters from the drop-down list. The set of filters available in the drop-down list depends on the selected column.
- To remove filters, click the relevant column heading and select Clear filter.
Available columns of the incidents table:
- Name—the name of the incident.
- Threat duration—the time span during which the incident occurred (the time between the first and the last event related to the incident).
- Assigned to—the name of the security officer to whom the incident was assigned for investigation or response.
- Created—the date and time when the incident was created. This column allows you to filter incidents by the time they were created.
- The following preset periods are available: Today, Yesterday, This week, Previous week.
- If required, you can set an arbitrary period by using the calendar that opens when you select Before date, After date, or In period.
- Tenant—the name of the tenant that owns the incident.
- Status—current status of the incident:
- Opened—new incident that has not been processed yet.
- Assigned—the incident has been processed and assigned to a security officer for investigation or response.
- Closed—the incident is closed; the security threat has been resolved.
- Alerts number—the number of alerts included in the incident. Only the alerts of those tenants to which you have access are taken into account.
- Priority shows how important a possible security threat is: Critical , High , Medium , Low .
- Affected asset categories—categories of alert-related assets with the highest severity. No more than three categories are displayed.
- Updated—the date and time of the last change made in the incident.
- First event and Last event—dates and times of the first and last events in the incident.
- Incident category and Incident type—category and type of threat assigned to the incident.
- Export to RuCERT—the status of incident data export to RuCERT:
- Not exported—the data was not forwarded to RuCERT.
- Export failed—an attempt to forward data to RuCERT ended with an error, and the data was not transmitted.
- Exported—data on the incident has been successfully transmitted to RuCERT.
- Branch—data on the specific node where the incident was created. Incidents of your node are displayed by default. This column is displayed only when hierarchy mode is enabled.
- CII—an indication of whether the incident involves assets that are CII objects. The column is hidden from the users who do not have access to CII objects.
In the Search field, you can enter a regular expression for searching incidents based on their related assets, users, tenants, and correlation rules. Parameters that can be used for a search:
- Assets: name, FQDN, IP address.
- Active Directory accounts: attributes displayName, SAMAccountName, and UserPrincipalName.
- Correlation rules: name.
- KUMA users who were assigned alerts: name, login, email address.
- Tenants: name.
When filtering incidents based on a specific parameter, the corresponding column in the incidents table is highlighted in yellow.
Page topSaving and selecting incident filter configuration
In KUMA, you can save changes to incident table settings as filters. Filter configurations are saved on the KUMA Core server and are available to all KUMA users of the tenant for which they were created.
To save the current filter configuration settings:
- In the Incidents section of KUMA, open the Select filter drop-down list.
- Select Save current filter.
A window will open for entering the name of the new filter and selecting the tenant that will own the filter.
- Enter a name for the filter configuration. The name must be unique for alert filters, incident filters, and event filters.
- In the Tenant drop-down list, select the tenant that will own the filter and click Save.
The filter configuration is now saved.
To select a previously saved filter configuration:
- In the Incidents section of KUMA, open the Select filter drop-down list.
- Select the configuration you want.
The filter configuration is now active.
You can select the default filter by putting an asterisk to the left of the required filter configuration name in the Filters drop-down list.
To reset the current filter settings,
open the Filters drop-down and select Clear filter.
Page topDeleting incident filter configurations
To delete a previously saved filter configuration:
- In the Incidents section of KUMA, open the Filters drop-down list.
- Click the button next to the configuration you want to delete.
- Click OK.
The filter configuration is now deleted for all KUMA users.
Page topViewing information about an incident
To view information about an incident:
- In the program web interface window, select the Incidents section.
- Select the incident whose information you want to view.
This opens a window containing information about the incident.
Some incident parameters are editable.
In the upper part of the Incident details window, there is a toolbar and the name of the user to whom the incident is assigned. The window sections are displayed as tabs. You can click a tab to move to the relevant section. In this window, you can process the incident: assign it to a user, combine it with another incident, or close it.
The Description section contains the following data:
- Created—the date and time when the incident was created.
- Name—the name of the incident.
You can change the name of an incident by entering a new name in the field and clicking Save The name must contain 1 to 128 Unicode characters.
- Tenant—the name of the tenant that owns the incident.
The tenant can be changed by selecting the required tenant from the drop-down list and clicking Save
- Status—current status of the incident:
- Opened—new incident that has not been processed yet.
- Assigned—the incident has been processed and assigned to a security officer for investigation or response.
- Closed—the incident is closed; the security threat has been resolved.
- Priority—the severity of the threat posed by the incident. Possible values:
- Critical
- High
- Medium
- Low
Priority can be changed by selecting the required value from the drop-down list and clicking Save.
- Affected asset categories—the assigned categories of assets associated with the incident.
- First event time and Last event time—dates and times of the first and last events in the incident.
- Type and Category—type and category of the threat assigned to the incident. You can change these values by selecting the relevant value from the drop-down list and clicking Save.
- Export to RuCERT—information on whether or not this incident was exported to RuCERT.
- Description—description of the incident.
To change the description, edit the text in the field and click Save. The description can contain no more than 256 Unicode characters.
- Related tenants—tenants associated with incident-related alerts, assets, and users.
- Available tenants—tenants whose alerts can be linked to the incident automatically.
The list of available tenants can be changed by checking the boxes next to the required tenants in the drop-down list and clicking Save.
The Related alerts section contains a table of alerts related to the incident. When you click on the alert name, a window opens with detailed information about this alert.
The Related endpoints and Related users sections contain tables with data on assets and users related to the incident. This information comes from alerts that are related to the incident.
You can add data to the tables in the Related alerts, Related endpoints and Related users sections by clicking the Link button in the appropriate section and selecting the object to be linked to the incident in the opened window. If required, you can unlink objects from the incident. To do this, select the objects as required, click Unlink in the section to which they belong, and save the changes. If objects were automatically added to the incident, they cannot be unlinked until the alert mentioning those objects is unlinked. The composition of the fields in the tables can be changed by clicking the button in the relevant section. You can search the data in the tables of these sections using the Search fields.
The Change log section contains a record of the changes you and your users made to the incident. Changes are automatically logged, but it is also possible to add comments manually.
In the RuCERT integration section, you can monitor the incident status in RuCERT. In this section, you can also export incident data to RuCERT, send files to RuCERT, and exchange messages with RuCERT experts.
If incident settings have been modified on the RuCERT side, a corresponding notification is displayed in the incident window in KUMA. In this case, for the settings whose values were modified, the window displays the values from KUMA and the values from RuCERT.
Page topIncident creation
To create an incident:
- Open the KUMA web interface and select the Incidents section.
- Click Create incident.
The window for creating an incident will open.
- Fill in the mandatory parameters of the incident:
- In the Name field enter the name of the incident. The name must contain 1 to 128 Unicode characters.
- In the Tenant drop-down list, select the tenant that owns the created incident.
- If necessary, provide other parameters for the incident:
- In the Priority drop-down list, select the severity of the incident. Available options: Low, Medium, High, Critical.
- In the First event time and Last event time fields, specify the time range in which events related to the incident were received.
- In the Category and Type drop-down lists, select the category and type of the incident. The available incident types depend on the selected category.
- Add the incident Description. The description can contain no more than 256 Unicode characters.
- In the Available tenants drop-down list, select the tenants whose alerts can be linked to the incident automatically.
- In the Related alerts section, add alerts related to the incident.
- In the Related endpoints section, add assets related to the incident.
- In the Related users section, add users related to the incident.
- Add a Comment to the incident.
- Click Save.
The incident has been created.
Page topIncident processing
You can assign an incident to a user, aggregate it with other incidents, or close it.
To process an incident:
- Select required incidents using one of the methods below:
- In the Incidents section of the KUMA web interface, click on the incident to be processed.
The incident window will open, displaying a toolbar on the top.
- In the Incidents section of the KUMA web console, select the check box next to the required incidents.
A toolbar will appear at the bottom of the window.
- In the Incidents section of the KUMA web interface, click on the incident to be processed.
- In the Assign to drop-down list, select the user to whom you want to assign the incident.
You can assign the incident to yourself by selecting Me.
The status of the incident changes to assigned and the name of the selected user is displayed in the Assign to drop-down list.
- In the Related users section, select a user and configure Active Directory response settings.
- After the related user is selected, in the Account details window that opens, click Response via Active Directory.
- In the AD command drop-down list, select one of the following values:
- Add account to group
- Remove account from group
- Reset account password
- Block account
- Click Apply.
- If required, edit the incident parameters.
- After investigating, close the incident:
- Click Close.
A confirmation window opens.
- Select the reason for closing the incident:
- Approved. This means the appropriate measures were taken to eliminate the security threat.
- Not approved. This means the incident was a false positive and the received events do not indicate a security threat.
- Click Close.
The Closed status will be assigned to the incident. Incidents with this status cannot be edited, and they are displayed in the incidents table only if you selected the Closed check box in the Status drop-down list when filtering the table. You cannot change the status of a closed incident or assign it to another user, but you can aggregate it with another incident.
- Click Close.
- If requited, aggregate the selected incidents with another incident:
- Click Merge. In the opened window, select the incident in which all data from the selected incidents should be placed.
- Confirm your selection by clicking Merge.
The incidents will be aggregated.
The incident has been processed.
Page topChanging incidents
To change the parameters of an incident:
- In the Incidents section of the KUMA web interface, click on the incident you want to modify.
The Incident window opens.
- Make the necessary changes to the parameters. All incident parameters that can be set when creating it are available for editing.
- Click Save.
The incident will be modified.
Page topAutomatic linking of alerts to incidents
In KUMA, you can configure automatic linking of generated alerts to existing incidents if alerts and incidents have related assets or users in common. If this setting is enabled, when creating an alert the program searches for incidents falling into a specified time interval that includes assets or users from the alert. In addition, the program checks whether the generated alert pertains to the tenants specified in the incidents' Available tenants parameter. If a matching incident is found, the program links the generated alert to the incident it found.
To set up automatic linking of alerts to incidents:
- In the KUMA web interface, open Settings → Incidents → Automatic linking of alerts to incidents.
- Select the Enable check box in the Link by assets and/or Link by accounts parameter blocks depending on the types of connections between incidents and alerts that you are looking for.
- Define the Incidents must not be older than value for the parameters that you want to use when searching links. The generated alerts will be compared with incidents no older than the specified interval.
Automatic linking of alerts to incidents is configured.
To disable automatic linking of alerts to incidents,
In the KUMA web interface, under Settings → Incidents → Automatic linking of alerts to incidents, select the Disabled check box.
Page topCategories and types of incidents
For your convenience, you can assign categories and types. If an incident has been assigned a RuCERT category, it can be exported to RuCERT.
Categories and types of incidents that can be exported to RuCERT
The categories of incidents can be viewed or changed under Settings → Incidents → Incident types, in which they are displayed as a table. By clicking on the column headers, you can change the table sorting options. The resource table contains the following columns:
- Category—a common characteristic of an incident or cyberattack. The table can be filtered by the values in this column.
- Type—the class of the incident or cyberattack.
- RuCERT category—incident type according to RuCERT nomenclature. Incidents that have been assigned custom types and categories cannot be exported to RuCERT. The table can be filtered by the values in this column.
- Vulnerability—specifies whether the incident type indicates a vulnerability.
- Created—the date the incident type was created.
- Updated—the date the incident type was modified.
To add an incident type:
- In the KUMA web interface, under Settings → Incidents → Incident types, click Add.
The incident type creation window will open.
- Fill in the Type and Category fields.
- If the created incident type matches the RuCERT nomenclature, select the RuCERT category check box.
- If the incident type indicates a vulnerability, check Vulnerability.
- Click Save.
The incident type has been created.
Page topInteraction with RuCERT
In KUMA, you can interact with the National Computer Incident Response & Coordination Center (hereinafter RuCERT) in the following ways:
- Export incidents to RuCERT.
- Supplement the exported incident with data when requested by RuCERT.
- Send files to RuCERT.
- Exchange messages with RuCERT experts.
- View the changes made by RuCERT to the exported incidents settings.
Data in KUMA and RuCERT is synchronized every 5-10 minutes.
Conditions for RuCERT interaction
To interact with RuCERT, the following conditions must be met:
- The application license includes the GosSOPKA module.
- RuCERT integration is configured.
- The Can interact with RuCERT check box is selected in the settings of the users whose responsibilities include interaction with RuCERT.
RuCERT interaction workflow
In KUMA, the process of sending incidents to RuCERT to be processed consists of the following stages:
- Creating an incident and checking it for compliance with RuCERT requirements
You can create an incident or get it from a child KUMA node. Before sending data to the RuCERT, make sure that the incident category meets RuCERT requirements.
- Exporting the incident to RuCERT
If the incident is successfully exported to RuCERT, its Export to RuCERT setting is set to Exported. In the lower part of the incident window, a chat with RuCERT experts becomes available.
At RuCERT, the incident received from you is assigned a registration number and status. This information is displayed in the incident window in the RuCERT integration section and in automatic chat messages.
If all the necessary data is provided to RuCERT, the incident is assigned the Under examination status. The settings of the incident having this status can be edited, but the updated information cannot be sent from KUMA to RuCERT. You can view the difference between the incident data in KUMA and in RuCERT.
- Supplementing incident data
If RuCERT experts do not have enough information to process an incident, they can assign it the More information required status. In KUMA, this status is displayed in the incident window in the RuCERT integration section. Users are notified about the status change.
You can attach a file to the incidents with this status.
When the data is supplemented, the incident is re-exported to RuCERT with earlier information updated. The incidents in the child nodes cannot be modified from the parent KUMA node. It must be done by employees of the child KUMA nodes.
If the incident is successfully supplemented with data, it is assigned the Under examination status.
- Completing incident processing
After the RuCERT experts process the incident, the RuCERT status is changed to Decision made. In KUMA, this status is displayed in the incident window in the RuCERT integration section.
Upon receiving this status, the incident is automatically closed in KUMA. Interaction with RuCERT on this incident by means of KUMA becomes impossible.
Special consideration for successful export from the KUMA hierarchical structure to RuCERT
If multiple KUMA nodes combined into a hierarchical structure are deployed in your organization, you can forward incidents, which are received from the child KUMA nodes, from the KUMA parent nodes to RuCERT. For this purpose, the following conditions must be met:
- Integration with RuCERT is configured in the parent and child KUMA nodes. The URL and Token settings in the Settings → RuCERT section are required for the parent node but are not required for the child node.
- RuCERT integration is enabled in both nodes.
In this case, interaction with RuCERT is performed only at the level of the node exporting the incident to RuCERT.
Settings of the incident received from a child KUMA node cannot be changed from a parent KUMA node. If there is not enough data for performing RuCERT export, the incident must be changed at the child KUMA node, and then exported to RuCERT from the parent KUMA node.
Page topExporting data to RuCERT
It is impossible to export incidents that are closed in KUMA to RuCERT if the Description field was not filled in at the time of closing.
To export an incident to RuCERT:
- In the Incidents section of the KUMA web interface, open the incident you want to export.
- Click the Export to RuCERT button in the lower part of the window.
- If you have not specified the category and type of incident, specify this information in the window that opens and click the Export to RuCERT button.
This opens the export settings window.
- Specify the settings on the Basic tab of the Export to RuCERT window:
- Category and Type—specify the type and category of the incident. Only incidents of specific categories and types can be exported to RuCERT.
- TLP (required)—assign a Traffic Light Protocol marker to an incident to define the nature of information about the incident. The default value is RED. Available values:
- WHITE—disclosure is not restricted.
- GREEN—disclosure is only for the community.
- AMBER—disclosure is only for organizations.
- RED—disclosure is only for a specific group of people.
- Affected system name (required)—specify the name of the information resource where the incident occurred. You can enter up to 500,000 characters in the field.
- Affected system category (required)—specify the critical information infrastructure (CII) category of your organization. If your organization does not have a CII category, select Information resource is not a CII object.
- Affected system function (required)—specify the scope of activity of your organization. The value specified in RuCERT integration settings is used by default.
- Location (required)—select the location of your organization from the drop-down list.
- Affected system has Internet connection—select this check box if the assets related to this incident have an Internet connection. By default, this check box is cleared.
If this check box is selected, the Technical details tab is available. This tab displays information about the assets related to the incident. See below for more details.
- Product info (required)—this table becomes available if you selected Notification about a detected vulnerability as the incident category.
You can use the Add new element button to add a string to the table. In the Name column, you must indicate the name of the application (for example,
MS Office). Specify the application version in the Version column (for example,2.4). - Vulnerability ID—if necessary, specify the identifier of the detected vulnerability. For example,
CVE-2020-1231.This field becomes available if you selected Notification about a detected vulnerability as the incident category.
- Product category—if necessary, specify the name and version of the vulnerable product. For example,
Microsoft operating systems and their components.This field becomes available if you selected Notification about a detected vulnerability as the incident category.
- If required, define the settings on the Advanced tab of the Export to RuCERT window.
The available settings on the tab depend on the selected category and type of incident:
- Detection tool—specify the name of the product that was used to register the incident. For example,
KUMA 1.5. - Assistance required—select this check box if you need help from GosSOPKA employees.
- Incident end time—specify the date and time when the critical information infrastructure (CII object) was restored to normal operation after a computer incident, computer attack was ended, or a vulnerability was fixed.
- Availability impact—assess the degree of impact that the incident had on system availability:
- High
- Low
- None
- Integrity impact—assess the degree of impact that the incident had on system integrity:
- High
- Low
- None
- Confidentiality impact—assess the degree of impact that the incident had on data confidentiality:
- High
- Low
- None
- Custom impact—specify other significant impacts from the incident.
- City—indicate the city where your organization is located.
- Detection tool—specify the name of the product that was used to register the incident. For example,
- If assets are attached to the incident, you can specify their settings on the Technical details tab.
This tab is active only if you select the Affected system has Internet connection check box.
You should change or supplement the information previously specified on the Technical details tab in your personal GosSOPKA dashboard, even if the RuCERT experts request from you additional information, and you can change the exported incident.
The categories of the listed assets must match the category of the affected CII in your system.
- Click Export.
- Confirm the export.
Information about the incident is submitted to RuCERT, and the Export to RuCERT incident setting is changed to Exported. At RuCERT, the incident received from you is assigned a registration number and status. This information is displayed in the incident window in the RuCERT integration section.
It is possible to change the data in the exported incident only if the RuCERT experts requested additional information from you. If no additional information was requested, but you need to update the exported incident, you should do it in your GosSOPKA dashboard.
After the incident is successfully exported, the Compare KUMA incident to RuCERT data button is displayed at the bottom of the screen. When you click this button, a window opens, where the differences in the incident data between KUMA and RuCERT are highlighted.
Page topSupplementing incident data on request
If RuCERT experts need additional information about the incident, they may request it from you. In this case, the incident status changes to More information required in the RuCERT integration section of the incident window. The following KUMA users receive email notifications about the status change: the user to whom the incident is assigned and the user who exported the incident to RuCERT.
If an incident is assigned the "More information required" status in RuCERT, the following actions are available for this incident in KUMA:
- Upload files to RuCERT.
- Re-export the incident data to RuCERT with updates or additions to the previously provided information. This action completes supplementing the incident data.
Sending files to RuCERT
If an incident is assigned the More information required status in RuCERT, you can attach a file to it. The file will be available both in RuCERT and in the KUMA web interface.
For a hierarchical deployment of KUMA, files can only be uploaded to RuCERT from the parent KUMA node. At the same time, log entries about the file download are visible in the child nodes of KUMA.
In the incident change log, messages about the files uploaded to RuCERT by KUMA users are added. Messages about adding files by RuCERT are not added to the log.
To attach a file to an incident:
- In the Incidents section of the KUMA web interface, open the incident you want to attach a file to. The incident must have the More information required status in RuCERT.
- In the RuCERT integration section of the incident window, select the File tab and click the Send file to RuCERT button.
The file selection window opens.
- Select the required file no larger than 50 MB and confirm your selection.
The file is attached to the incident and available for both RuCERT experts and KUMA users.
Data in KUMA and RuCERT is synchronized every 5-10 minutes.
Page topSending incidents involving personal information leaks to RuCERT
KUMA 2.1.x does not have a separate section with incident parameters for submitting information about personal information leaks to RuCERT. Since such incidents do occur and a need exists to submit information to RuCERT, use the following solution.
To submit incidents involving personal information leaks:
- In the KUMA web interface, in the Incidents section, when creating an incident involving a personal information leak, in the Category field, select Notification about a computer incident.
- In the Type field, select one of the options that involves submission of information about personal information leak:
- Malware infection
- Compromised user account
- Unauthorized disclosure of information
- Successful exploitation of a vulnerability
- Event is not related to a computer attack
- In the Description field, enter "The incident involves a leak of personal information. Please set the status to "More information required"".
- Click Save.
- Export the incident to RuCERT.
After RuCERT employees set the status to "More information required" and return the incident for further editing, in your RuCERT account, you can provide additional information about the incident in the "Details of the personal information leak" section.
Page topCommunication with RuCERT experts
After the incident is successfully exported to RuCERT, a chat with RuCERT experts becomes available at the bottom of the screen. You can exchange messages since successful incident export to RuCERT until it is closed in RuCERT.
The chat window with the message history and the field for entering new messages is available on the Chat tab in the RuCERT integration section of the incident window.
Data in KUMA and RuCERT is synchronized every 5-10 minutes.
Supported categories and types of RuCERT incidents
The table below lists the categories and types of incidents that can be exported to RuCERT:
Incident category |
Incident type |
Computer incident notification |
Involvement of a controlled resource in malicious software infrastructure |
Slowed operation of the resource due to a DDoS attack |
|
Malware infection |
|
Network traffic interception |
|
Use of a controlled resource for phishing |
|
Compromised user account |
|
Unauthorized data modification |
|
Unauthorized disclosure of information |
|
Publication of illegal information on the resource |
|
Distribution of spam messages from the controlled resource |
|
Successful exploitation of a vulnerability |
|
Notification about a computer attack |
DDoS attack |
Unsuccessful authorization attempts |
|
Malware injection attempts |
|
Attempts to exploit a vulnerability |
|
Publication of fraudulent information |
|
Network scanning |
|
Social engineering |
|
Notification about a detected vulnerability |
Vulnerable resource |
Notifications about the incident status change in RuCERT
In the event of certain changes in the status or data of an incident at RuCERT, KUMA users receive the following notifications by email:
- Notification about receiving a message from RuCERT.
- Additional data request notification.
- Notification about the incident status change in RuCERT.
- Notification about automatic closure of an incident.
The following users receive notifications:
- The user to whom the incident was assigned.
- The user who exported the incident to RuCERT.
Retroscan
In normal mode, the correlator handles only events coming from collectors in real time. Retroscan lets you apply correlation rules to historical events if you want to debug correlation rules or analyze historical data.
To test a rule, you do not need to replay the incident in real time, instead you can run the rule in Retroscan mode to process historical events which include the incident of interest.
You can use a search query to define a list of historical events to retrospectively scan, you can also specify a search period and the storage that you want to search for events. You can configure a task to have alerts generated and response rules applied during the retroscan of events.
Retroscanned events are not enriched with data from CyberTrace or the Kaspersky Threat Intelligence Portal.
Active lists are updated during retroscanning.
A retroscan cannot be performed on selections of events obtained using SQL queries that group data and contain arithmetic expressions.
To use Retroscan:
- In the Events section of the KUMA web interface, create the required event selection:
- Select the storage.
- Configure search expression using the constructor or search query.
- Select the required period.
- Open the
 drop-down list and choose Retroscan.
The Retroscan window opens.
- In the Correlator drop-down list, select the Correlator to feed selected events to.
- In the Correlation rules drop-down list, select the Correlation rules that must be used when processing events.
- If you want responses to be executed when processing events, turn on the Execute responses toggle switch.
- If you want alerts to be generated during event processing, turn on the Create alerts toggle switch.
- Click the Create task button.
The retroscan task is created in the Task manager section.
To view scan results, in the Task manager section of the KUMA web interface, click the task you created and select Go to Events from the drop-down list.
This opens a new browser tab containing a table of events that were processed during the retroscan and the aggregation and correlation events that were created during event processing. Correlation events generated by the retroscan have an additional ReplayID field that stores the unique ID of the retrospective scan run. An analyst can restart the retroscan from the context menu of the task. New correlation events will have a different ReplayID.
Depending on your browser settings, you may be prompted for confirmation before your browser can open the new tab containing the retroscan results. For more details, please refer to the documentation for your specific browser.
Page top