Contents
Configuring DNS server event reception using the ETW connector
The Event Tracing for Windows connector (hereinafter also referred to as the ETW connector) is a mechanism for logging events generated by applications and drivers on the DNS server. You can use the ETW connector to troubleshoot errors during development or to look for malicious activity.
The impact of the ETW connector on DNS server performance is insignificant. For example, a DNS server running on modern hardware and getting up to 100,000 queries per second (QPS) may experience a 5% performance drop while using the ETW connector. If the DNS server gets up to 50,000 requests per second, no performance drop is observed. We recommend monitoring DNS server performance when using the ETW connector, regardless of the number of requests per second.
By default, you can use the ETW connector on Windows Server 2016 or later. The ETW connector is also supported by Windows Server 2012 R2 if the update for event logging and change auditing is installed. The update is available on the Microsoft Support website.
The ETW connector consists of the following components:
- Provider is the software that generates events and sends the events to the ETW connector. For example, Windows kernels or device drivers can act as providers. When working with code, developers must specify which events the providers must send to the ETW connector. An event may represent the execution of a function that the developer considers important, for example, a function that allows access to the Security Account Manager (SAM).
- Consumer is the software that receives and uses events generated by providers from the ETW connector. For example, KUMA can act as a consumer.
- Controller is the software that manages the interaction between providers and consumers. For example, the Logman or Wevtutil utilities can be controllers. Providers register with the controller to send events to consumers. The controller can enable or disable a provider. If a provider is disabled, it does not generate events.
Controllers use trace sessions for communication between providers and consumers. Trace sessions are also used for filtering data based on specified parameters because consumers may need different events.
Configuring DNS server event reception using the ETW connector involves the following steps:
- Configuration on the Windows side.
- Creating a KUMA collector.
When creating a KUMA collector, follow these steps:
- At step 2 of the Collector Installation Wizard:
- In the Type drop-down list, select the tcp connector type. You can also specify the http connector type and other connector types with verification for secure transmission.
- In the URL field, enter the FQDN and port number on which the KUMA collector will listen for a connection from the KUMA agent. You can specify any unoccupied port number.
- In the Delimiter field, enter \n.
- At the step 3 of the Collector Installation Wizard, in the Normalizer drop-down list, select a normalizer. We recommend selecting the predefined extended normalizer for Windows events, [OOTB] Microsoft DNS ETW logs json.
- At step 7 of the Collector Installation Wizard, add a Storage type destination for storing events. If you plan to use event correlation, you also need to add a Correlator type destination.
- At step 8 of the Collector Installation Wizard, click Create and save service, and in the lower part of the window, copy the command for installing the KUMA collector on the server.
- At step 2 of the Collector Installation Wizard:
- Installing the KUMA collector on the server.
Do the following:
- Connect to the KUMA command line interface using a user account with root privileges.
- Install the KUMA collector by running the command that you copied at step 8 of the Collector Installation Wizard.
- If you want to add the KUMA collector port to the firewall exclusions and update the firewall settings, run the following commands:
firewall-cmd --add-port=<collector port number>/tcp --permanentfirewall-cmd --reload
The KUMA collector is installed and the status of the KUMA collector service is changed to green in the KUMA Console.
- Creating a KUMA agent.
When creating a KUMA agent, follow these steps:
- Go to the Connection 1 tab.
- Under Connector, in the Connector drop-down list, select Create and specify the following settings:
- In the Type drop-down list, select the etw connector type.
- In the Session name field, enter the provider name that you specified when you configured the reception of DNS server events using the ETW connector on the Windows side.
- Under Destinations, in the Destination drop-down list, select Create and specify the following settings:
- In the Type drop-down list, select the tcp destination type.
- In the URL field, enter the FQDN and port number on which the KUMA collector will listen for a connection from the KUMA agent. The value must match the value that you specified at step 2 of the Collector Installation Wizard.
- Go to the Advanced settings tab, and in the Disk buffer size limit field, enter 1073741824.
- Creating a KUMA agent service.
You need to copy the ID of the created KUMA agent service. To do that, click the KUMA agent service, and then select Copy ID in the context menu.
- Creating an account for the KUMA agent.
Create a domain or local Windows user account for running the KUMA agent and reading the analytic log. You need to add the created user account to the Performance Log Users group and grant the Log on service permission to that user account.
- Installing a KUMA agent on a Windows server.
You need to install the KUMA agent on the Windows server that will be receiving events from the provider. To do so:
- Add the FQDN of the KUMA Core server to the hosts file on the Windows server or to the DNS server.
- Create the C:\Users\<user name>\Desktop\KUMA folder on the Windows server.
- Copy the kuma.exe file from the KUMA installation package archive to the C:\Users\<user name>\Desktop\KUMA folder.
- Run the command interpreter as administrator.
- Change to the C:\Users\<user name>\Desktop\KUMA folder and run the following command:
C:\Users\<user name>\Desktop\KUMA>kuma.exe agent --core https://<DOMAIN-NAME-KUMA-CORE-Server>:7210 --id <KUMA agent service ID>In the KUMA Console, in the Resources → Active services section, make sure that the KUMA agent service is running and its status is now green, and then abort the command.
- Start the KUMA Agent installation in one of the following ways:
- If you want to start the KUMA agent installation using a domain user account, run the following command:
C:\Users\<user name>\Desktop\KUMA>kuma.exe agent --core https://<DOMAIN-NAME-KUMA-CORE-Server>:7210 --id <KUMA agent service ID> –-user <domain>\<user account name for the KUMA agent> --install - If you want to start the KUMA agent installation using a local user account, run the following command:
C:\Users\<user name>\Desktop\KUMA>kuma.exe agent --core https://<DOMAIN-NAME-KUMA-CORE-Server>:7210 --id <KUMA agent service ID> –-user <user account name for the KUMA agent> --install
You will need to enter the password of the KUMA agent user account.
- If you want to start the KUMA agent installation using a domain user account, run the following command:
The KUMA Windows Agent service <KUMA agent service ID> is installed on the Windows server. In the KUMA Console, in the Resources → Active services section, if the KUMA agent service is not running and has the red status, you need to make sure that port 7210 is available, as well as the Windows collector port in the direction from the KUMA agent to the KUMA collector.
To remove the KUMA agent service on the Windows server, run the following command:
C:\Users\<user name>\Desktop\KUMA>kuma.exe agent --id <KUMA agent service ID> --uninstall - Verifying receipt of DNS server events in the KUMA collector.
You can verify that you have correctly configured the reception of DNS server events using the ETW connector in the Searching for related events section of the KUMA Console.
Configuration on the Windows side
To configure the reception of DNS server events using the ETW connector on the Windows side:
- Start the Event viewer by running the following command:
eventvwr.msc
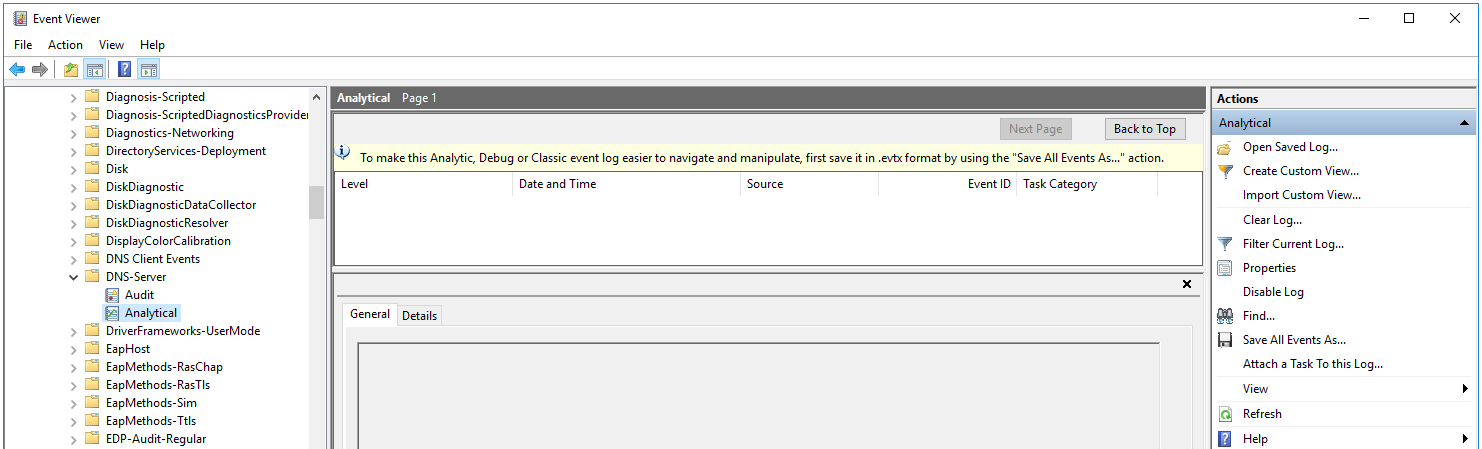
- In the window that opens, go to the Applications and Services Logs → Microsoft → Windows → DNS-Server folder.
- Open the context menu of the DNS-Server folder and select View → Show Analytic and Debug Logs.
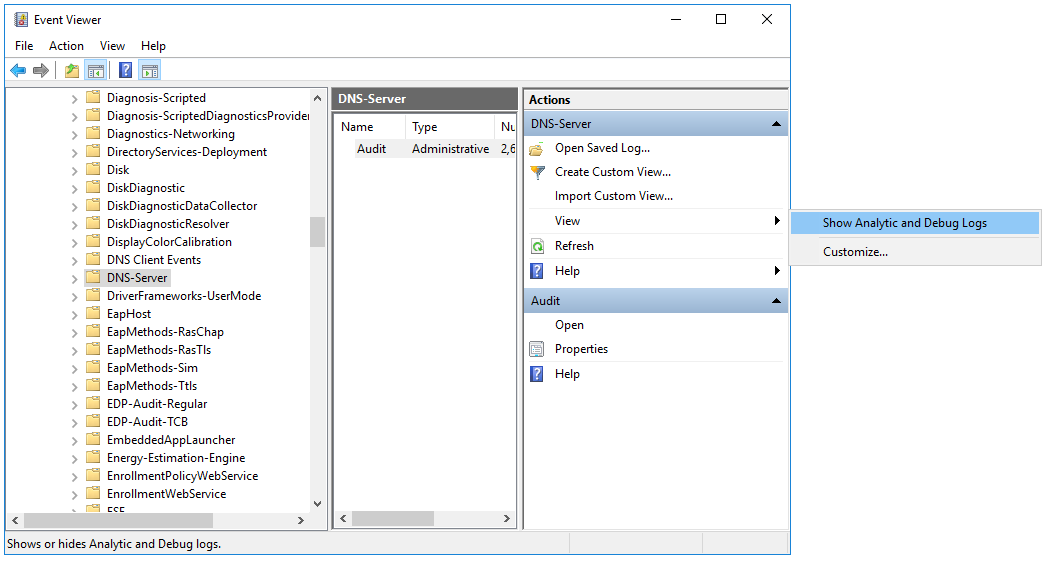
The Audit debug log and Analytical log are displayed.
- Configure the analytic log:
- Open the context menu of the Analytical log and select Properties.
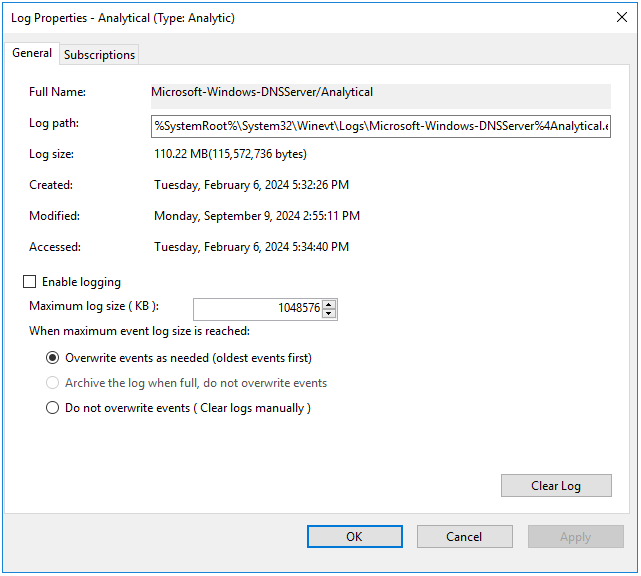
- In the window that opens, make sure that in the Max Log Size (KB) field, the value is 1048576.
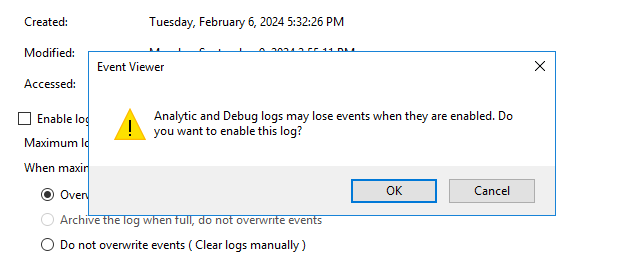
- Select the Enable logging check box and in the confirmation window, click OK.
The analytic log must be configured as follows:
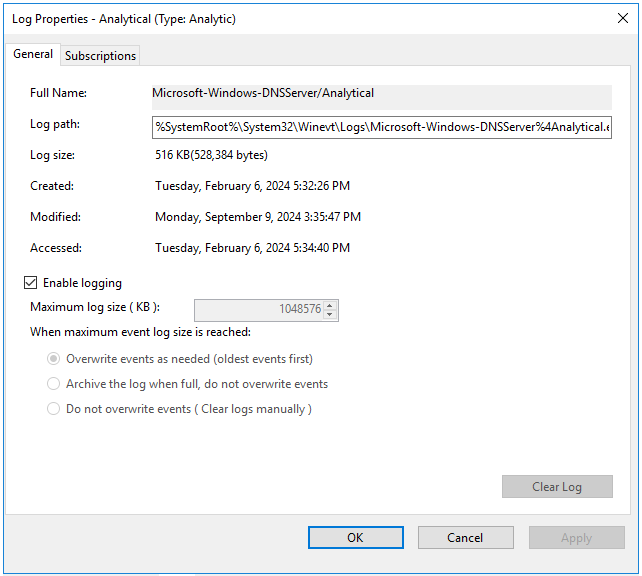
- Click Apply, then click OK.
An error window is displayed.
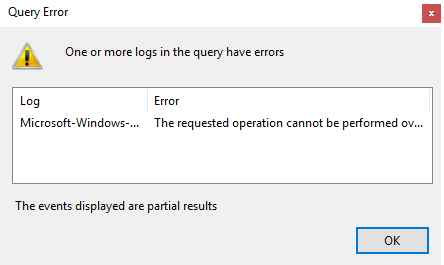
When analytic log rotation is enabled, events are not displayed. To view events, in the Actions pane, click Stop logging.
- Start Computer management as administrator.
- In the window that opens, go to the System Tools → Performance → Startup Event Trace Sessions folder.
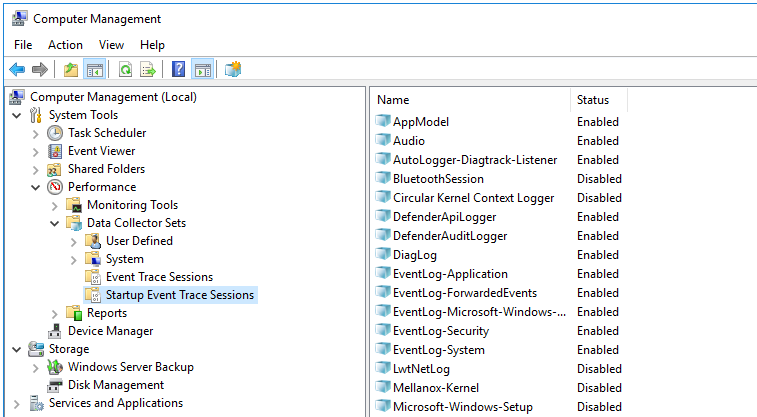
- Create a provider:
- Open the context menu of the Startup Event Trace Sessions folder and select Create → Data Collector Set.
- In the window that opens, enter the name of the provider and click Next.
- Click Add... and in the displayed window, select the Microsoft-Windows-DNSServer provider.
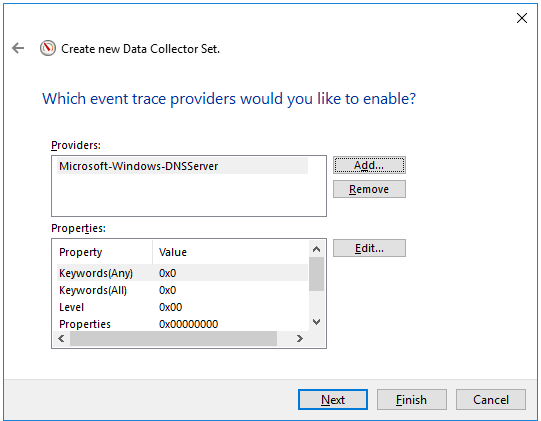
The KUMA agent with the ETW connector works only with System.Provider.Guid: {EB79061A-A566-4698-9119-3ED2807060E7} - Microsoft-Windows-DNSServer.
- Click Next twice, then click Finish.
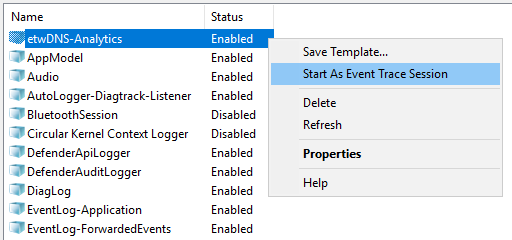
- Open the context menu of the created provider and select Start As Event Trace Session.
- Go to the Event Trace Sessions folder.
Event trace sessions are displayed.
- Open the context menu of the created event trace session and select Properties.
- In the window that opens, select the Trace Sessions tab and in the Stream Mode drop-down list, select Real Time.
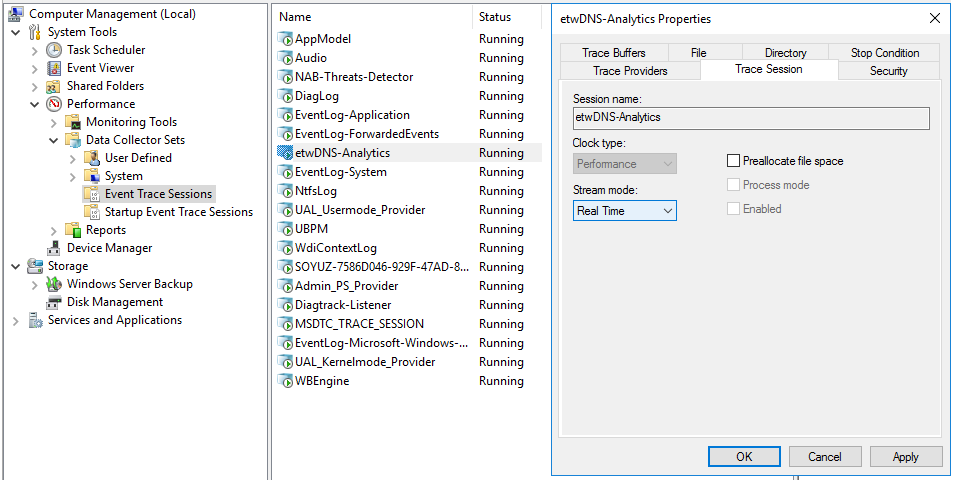
- Click Apply, then click OK.
DNS server event reception using the ETW connector is configured.
Page top