Contents
- Monitoring, reporting, and audit
- Scenario: Monitoring and reporting
- About types of monitoring and reporting
- Triggering of rules in Smart Training mode
- Dashboard and widgets
- Reports
- Events and event selections
- About events in Open Single Management Platform
- Events of Open Single Management Platform components
- Using event selections
- Creating an event selection
- Editing an event selection
- Viewing a list of an event selection
- Exporting an event selection
- Importing an event selection
- Viewing details of an event
- Exporting events to a file
- Viewing an object history from an event
- Deleting events
- Deleting event selections
- Setting the storage term for an event
- Blocking frequent events
- Event processing and storage on the Administration Server
- Notifications and device statuses
- Kaspersky announcements
- Exporting events to SIEM systems
- Scenario: Configuring event export to SIEM systems
- Before you begin
- About event export
- About configuring event export in a SIEM system
- Marking of events for export to SIEM systems in Syslog format
- About exporting events using Syslog format
- Configuring Open Single Management Platform for export of events to a SIEM system
- Exporting events directly from the database
- Viewing export results
- Managing object revisions
- Rolling back an object to a previous revision
- Deletion of objects
- Downloading and deleting files from Quarantine and Backup
- Operation diagnostics of the Kaspersky Next XDR Expert components
Monitoring, reporting, and audit
This section describes the monitoring and reporting capabilities of Open Single Management Platform. These capabilities give you an overview of your infrastructure, protection statuses, and statistics.
After Open Single Management Platform deployment or during the operation, you can configure the monitoring and reporting features to best suit your needs.
Scenario: Monitoring and reporting
This section provides a scenario for configuring the monitoring and reporting feature in Open Single Management Platform.
Prerequisites
After you deploy Open Single Management Platform in an organization's network, you can start to monitor it and generate reports on its functioning.
Monitoring and reporting in an organization's network proceeds in stages:
- Configuring the switching of device statuses
Get acquainted with the settings for device statuses depending on specific conditions. By changing these settings, you can change the number of events with Critical or Warning importance levels. When configuring the switching of device statuses, be sure of the following:
- New settings do not conflict with the information security policies of your organization.
- You are able to react to important security events in your organization's network in a timely manner.
- Configuring notifications about events on client devices
How-to instructions:
- Performing recommended actions for Critical and Warning notifications
How-to instructions:
- Reviewing the security status of your organization's network
How-to instructions:
- Locating client devices that are not protected
How-to instructions:
- Checking protection of client devices
How-to instructions:
- Evaluating and limiting the event load on the database
Information about events that occur during operation of managed applications is transferred from a client device and registered in the Administration Server database. To reduce the load on the Administration Server, evaluate and limit the maximum number of events that can be stored in the database.
How-to instructions:
- Reviewing license information
How-to instructions:
Results
Upon completion of the scenario, you are informed about protection of your organization's network and, thus, can plan actions for further protection.
Page topAbout types of monitoring and reporting
Information on security events in an organization's network is stored in the Administration Server database. Based on the events, OSMP Console provides the following types of monitoring and reporting in your organization's network:
- Dashboard
- Reports
- Event selections
- Notifications
Dashboard
The dashboard allows you to monitor security trends on your organization's network by providing you with a graphical display of information.
Reports
The Reports feature allows you to get detailed numerical information about the security of your organization's network, save this information to a file, send it by email, and print it.
Event selections
Event selections provide an onscreen view of named sets of events that are selected from the Administration Server database. These sets of events are grouped according to the following categories:
- By importance level—Critical events, Functional failures, Warnings, and Info events
- By time—Recent events
- By type—User requests and Audit events
You can create and view user-defined event selections based on the settings available, in the OSMP Console interface, for configuration.
Notifications
Notifications alert you about events and help you to speed up your responses to these events by performing recommended actions or actions you consider as appropriate.
Page topTriggering of rules in Smart Training mode
This section provides information about the detections performed by the Adaptive Anomaly Control rules in Kaspersky Endpoint Security for Windows on client devices.
The rules detect anomalous behavior on client devices and may block it. If the rules work in Smart Training mode, they detect anomalous behavior and send reports about every such occurrence to Administration Server. This information is stored as a list in the Triggering of rules in Smart Training state subfolder of the Repositories folder. You can confirm detections as correct or add them as exclusions, so that this type of behavior is not considered anomalous anymore.
Information about detections is stored in the event log on the Administration Server (along with other events) and in the Adaptive Anomaly Control report.
For more information about Adaptive Anomaly Control, the rules, their modes and statuses, refer to Kaspersky Endpoint Security for Windows Help.
Viewing the list of detections performed using Adaptive Anomaly Control rules
To view the list of detections performed by Adaptive Anomaly Control rules:
- In the console tree, select the node of the Administration Server that you require.
- Select the Triggering of rules in Smart Training state subfolder (by default, this is a subfolder of Advanced → Repositories).
The list displays the following information about detections performed using Adaptive Anomaly Control rules:
To view properties of each information element:
- In the console tree, select the node of the Administration Server that you require.
- Select the Triggering of rules in Smart Training state subfolder (by default, this is a subfolder of Advanced → Repositories).
- In the Triggering of rules in Smart Training state workspace, select the object that you want.
- Do one of the following:
- Click the Properties link in the information box that appears on the right side of the screen.
- Right-click and in the context menu select Properties.
The properties window of the object opens, displaying information about the selected element.
You can confirm or add to exclusions any element in the list of detections of Adaptive Anomaly Control rules.
To confirm an element,
Select an element (or several elements) in the list of detections and click the Confirm button.
The status of the element(s) will be changed to Confirming.
Your confirmation will contribute to the statistics used by the rules (for more information, refer to Kaspersky Endpoint Security 11 for Windows Help).
To add an element as an exclusion,
Right-click an element (or several elements) in the list of detections and select Add to exclusions in the context menu.
The Add exclusion wizard starts. Follow the wizard instructions.
If you reject or confirm an element, it will be excluded from the list of detections after the next synchronization of the client device with the Administration Server, and will no longer appear in the list.
Page topAdding exclusions from the Adaptive Anomaly Control rules
The Add exclusion wizard allows you to add exclusions from the Adaptive Anomaly Control rules for Kaspersky Endpoint Security.
You can start the wizard through one of the three procedures below.
To start the Add exclusion wizard through the Adaptive Anomaly Control node:
- In the console tree, select the node of the required Administration Server.
- Select Triggering of rules in Smart Training state (by default, this is a subfolder of Advanced → Repositories).
- In the workspace, right-click an element (or several elements) in the list of detections and select Add to exclusions.
You can add up to 1000 exclusions at a time. If you select more elements and try to add them to exclusions, an error message is displayed.
The Add exclusion wizard starts. Proceed through the wizard by using the Next button.
You can start the Add exclusion wizard from other nodes in the console tree:
- Events tab of the main window of the Administration Server (then the User requests option or Recent events option).
- Report on Adaptive Anomaly Control rules state, Detections count column.
To add exclusions from the Adaptive Anomaly Control rules using the Add exclusion wizard:
- On the first step of the wizard, select an application from the list of Kaspersky applications whose management plug-ins allow you to add exclusions to the policies for these applications.
This step can be skipped if you have only one Kaspersky Endpoint Security for Windows version and do not have other applications that support the Adaptive Anomaly Control rules.
- Select the policies and profiles to which you want to add exclusions.
The next step displays a progress bar as the policies are processed. You can interrupt the processing of policies by clicking Cancel.
Inherited policies cannot be updated. If you do not have the rights to modify a policy, this policy will not be updated either.
When all the policies are processed (or if you interrupt the processing), a report appears. It shows which policies were updated successfully (green icon) and which policies were not updated (red icon).
- Click Finish to close the wizard.
The exclusion from the Adaptive Anomaly Control rules is configured and applied.
Dashboard and widgets
This section contains information about the dashboard and the widgets that the dashboard provides. The section includes instructions on how to manage widgets and configure widget settings.
Using the dashboard
The dashboard allows you to monitor security trends on your organization's network by providing you with a graphical display of information.
The dashboard is available in the OSMP Console, in the Monitoring & reporting → Dashboard section.
The dashboard provides widgets that can be customized. You can choose a large number of different widgets, presented as pie charts or donut charts, tables, graphs, bar charts, and lists. The information displayed in the widgets is automatically updated, the update period is from one to two minutes. The interval between updates varies for different widgets. You can refresh data on a widget manually at any time by using the settings menu.
The dashboard includes the Administration and protection and Detection and response tabs, to which you can add widgets.
The Administration and protection tab
The Administration and protection tab can contain widgets that display information about all events stored in the database of Administration Server.
In the Administration and protection tab, the widgets of the following groups are available:
- Protection status
- Deployment
- Updating
- Threat statistics
- Other
The Detection and response tab
The Detection and response tab can contain widgets that display information about detected and registered alerts and incidents, and the response actions to them. You can view data only for those tenants to which you have access.
In the Detection and response tab, the widgets of the following groups are available:
- Events
- Active lists
- Alerts
- Assets
- Incidents
- Event sources
- Users
- Playbooks
Administration and protection widgets
When configuring the Administration and protection tab of the dashboard, you can add widgets, hide widgets, change the size or appearance of widgets, move widgets, and change their settings.
Some widgets have text information with links. You can view detailed information by clicking the link.
The following widget groups and widgets are available on the Administration and protection tab of the dashboard:
- Protection status
The group includes the following widgets:
- History of software vulnerabilities
- Number of vulnerable devices
- Distribution of devices by severity level of vulnerabilities
- Status of selected device
- Protection status
- Deployment
This group includes the New devices widget.
- Updating
This group includes the following widgets:
- Statistics about Windows Update updates
- Distribution of anti-virus databases
- Active alerts
- Statistics of update installation results by update category
- Statistics of update installation statuses by update category
- Statistics of update installation statuses
- Threat statistics
This group includes the following widgets:
- Detection of threats by a specified application component distributed by disinfection result
- Detection of threats by application components
- Prohibited applications
- Types of network attacks
- Types of detected viruses and disinfection results
- Quarantine history
- History of detection of probably infected objects
- History of network attacks
- History of threat activity sorted by application type
- Threat activity
- Users of the 10 most heavily infected devices
- Most heavily infected devices
- Virtual Administration Servers infected most frequently
- Most frequent threats
- Windows domains infected most frequently
- Groups infected most frequently
- Alerts
- Other
This group includes the following widgets:
- License key usage
- Notifications by selected severity level
- Top 10 most frequent events in database
- Current status of selected Administration Server task
- Task history
Adding widgets to the dashboard
To add widgets to the dashboard:
- In the main menu, go to Monitoring & reporting → Dashboard.
- Click the Add or restore web widget button.
- In the list of available widgets, select the widgets that you want to add to the dashboard.
Widgets are grouped by category. To view the list of widgets included in a category, click the chevron icon (
 ) next to the category name.
 - Click the Add button.
The selected widgets are added at the end of the dashboard.
You can now edit the representation and parameters of the added widgets.
Hiding a widget from the dashboard
To hide a displayed widget from the dashboard:
- In the main menu, go to Monitoring & reporting → Dashboard.
- Click the settings icon (
 ) next to the widget that you want to hide.
 - Select Hide web widget.
- In the Warning window that opens, click OK.
The selected widget is hidden. Later, you can add this widget to the dashboard again.
Moving a widget on the dashboard
To move a widget on the dashboard:
- In the main menu, go to Monitoring & reporting → Dashboard.
- Click the settings icon () next to the widget that you want to move.
- Select Move.
- Click the place to which you want to move the widget. You can select only another widget.
The places of the selected widgets are swapped.
Changing the widget size or appearance
For widgets that display a graph, you can change its representation—a bar chart or a line chart. For some widgets, you can change their size: compact, medium, or maximum.
To change the widget representation:
- In the main menu, go to Monitoring & reporting → Dashboard.
- Click the settings icon () next to the widget that you want to edit.
- Do one of the following:
- To display the widget as a bar chart, select Chart type: Bars.
- To display the widget as a line chart, select Chart type: Lines.
- To change the area occupied by the widget, select one of the values:
- Compact
- Compact (bar only)
- Medium (donut chart)
- Medium (bar chart)
- Maximum
The representation of the selected widget is changed.
Changing widget settings
To change settings of a widget:
- In the main menu, go to Monitoring & reporting → Dashboard.
- Click the settings icon () next to the widget that you want to change.
- Select Show settings.
- In the widget settings window that opens, change the widget settings as required.
- Click Save to save the changes.
The settings of the selected widget are changed.
The set of settings depends on the specific widget. Below are some of the common settings:
- Web widget scope (the set of objects for which the widget displays information)—for example, an administration group or device selection.
- Select task (the task for which the widget displays information).
- Time interval (the time interval during which the information is displayed in the widget)—between the two specified dates; from the specified date to the current day; or from the current day minus the specified number of days to the current day.
- Set to Critical if these are specified and Set to Warning if these are specified (the rules that determine the color of a traffic light).
After you change the widget settings, you can refresh data on the widget manually.
To refresh data on a widget:
- In the main menu, go to Monitoring & reporting → Dashboard.
- Click the settings icon () next to the widget that you want to move.
- Select Refresh.
The data on the widget is refreshed.
Detection and response widgets
On the Detection and response tab, you can add, configure, and delete widgets.
A selection of widgets used in the Detection and response tab is called a layout. All widgets must be placed in layouts. Kaspersky Next XDR Expert allows you to create, edit, and delete layouts. Preconfigured layouts are also available. You can edit widget settings in the preconfigured layouts as necessary. By default, the Alerts Overview layout is selected on the Detection and response tab.
The widget displays data for the period selected in the widget or layout settings only for the tenants that are selected in the widget or layout settings.
By clicking the link with the name of the widget about events, alerts, incidents, or active lists, you can go to the corresponding section of the Kaspersky Next XDR Expert interface. Note that this option is not available for some widgets.
The following widget groups and widgets are available on the Detection and response tab of the dashboard:
- Events. Widget for creating analytics based on events.
- Active lists. Widget for creating analytics based on active lists of correlators.
- Alerts. Group for analytics related to alerts. Includes information about alerts and incidents that is provided by Kaspersky Next XDR Expert.
The group includes the following widgets:
- Active alerts. Number of alerts that have not been closed.
- Active alerts by tenant. Number of unclosed alerts for each tenant.
- Alerts by tenant. Number of alerts of all statuses for each tenant.
- Unassigned alerts. Number of alerts that have the New status.
- Alerts by status. Number of alerts that have the New, Opened, Assigned, or Escalated status. The grouping is by status.
- Latest alerts. Table with information about the last 10 unclosed alerts belonging to the tenants selected in the layout.
- Alerts distribution. Number of alerts created during the period configured for the widget.
- Alerts by assignee. Number of alerts with the Assigned status. The grouping is by account name.
- Alerts by severity. Number of unclosed alerts grouped by their severity.
- Alerts by rule. Number of unclosed alerts grouped by correlation rule.
- Assets. Group for analytics related to assets from processed events. This group includes the following widgets:
- Affected assets in alerts. Table with the names of assets and related tenants, and the number of unclosed alerts that are associated with these assets. The moving from the widget to the section with the asset list is not available.
- Affected asset categories. Categories of assets linked to unclosed alerts.
- Number of assets. Number of assets that were added to Kaspersky Next XDR Expert.
- Assets in incidents by tenant. Number of assets associated with unclosed incidents. The grouping is by tenant.
- Assets in alerts by tenant. Number of assets associated with unclosed alerts, grouped by tenant.
- Incidents. Group for analytics related to incidents.
The group includes the following widgets:
- Active incidents. Number of incidents that have not been closed.
- Unassigned incidents. Number of incidents that have the Opened status.
- Incidents distribution. Number of incidents created during the period configured for the widget.
- Incidents by status. Number of incidents grouped by status.
- Active incidents by tenant. Number of unclosed incidents grouped by tenant available to the user account.
- All incidents. Number of incidents of all statuses.
- All incidents by tenant. Number of incidents of all statuses, grouped by tenant.
- Affected assets categories in incidents. Asset categories associated with unclosed incidents.
- Latest incidents. Table with information about the last 10 unclosed incidents belonging to the tenants selected in the layout.
- Incidents by assignee. Number of incidents with the Assigned status. The grouping is by user account name.
- Incidents by severity. Number of unclosed incidents grouped by their severity.
- Affected assets in incidents. Number of assets associated with unclosed incidents. The moving from the widget to the section with the asset list is not available.
- Affected users in incidents. Users associated with incidents. The moving from the widget to the section with the user list is not available.
- Event sources. Group for analytics related to sources of events. The group includes the following widgets:
- Top event sources by alerts number. Number of unclosed alerts grouped by event source.
- Top event sources by convention rate. Number of events associated with unclosed alerts. The grouping is by event source.
In some cases, the number of alerts generated by sources may be inaccurate. To obtain accurate statistics, it is recommended to specify the Device Product event field as unique in the correlation rule, and enable storage of all base events in a correlation event. However, correlation rules with these settings consume more resources.
- Users. Group for analytics related to users from processed events. The group includes the following widgets:
- Affected users in alerts. Number of accounts related to unclosed alerts. The moving from the widget to the section with the user list is not available.
- Number of AD users. Number of Active Directory accounts received via LDAP during the period configured for the widget.
In the events table, in the event details area, in the alert window, and in the widgets, the names of assets, accounts, and services are displayed instead of the IDs as the values of the SourceAssetID, DestinationAssetID, DeviceAssetID, SourceAccountID, DestinationAccountID, and ServiceID fields. When exporting events to a file, the IDs are saved, but columns with names are added to the file. The IDs are also displayed when you point the mouse over the names of assets, accounts, or services.
Searching for fields with IDs is only possible using IDs.
Creating a widget
You can create a widget in a dashboard layout while creating or editing the layout.
To create a widget:
- In the main menu, go to Monitoring & reporting → Dashboard, and the select the Detection and response tab.
- Create a layout or switch to editing mode for the selected layout.
- Click Add widget.
- Select a widget type from the drop-down list.
This opens the widget settings window.
- Edit the widget settings.
- If you want to see how the data will be displayed in the widget, click Preview.
- Click Add.
The widget appears in the dashboard layout.
Page topEditing a widget
To edit widget:
- In the main menu, go to Monitoring & reporting → Dashboard, and the select the Detection and response tab.
- Expand the list in the upper right corner of the window.
- Hover the mouse cursor over the relevant layout.
- Click the edit button (
 ).
).The Customizing layout window opens.
- In the widget you want to edit, click the settings icon (
 ).
). - Select Edit.
This opens the widget settings window.
- Edit the widget settings.
- Click Save in the widget settings window.
- Click Save in the Customizing layout window.
The widget is edited.
Page topDeleting a widget
To delete a widget:
- In the main menu, go to Monitoring & reporting → Dashboard, and the select the Detection and response tab.
- Expand the list in the upper right corner of the window.
- Hover the mouse cursor over the relevant layout.
- Click the edit button ().
The Customizing layout window opens.
- In the widget you want to delete, click the settings icon ().
- Select Delete.
- In the opened confirmation window, click OK.
- Click the Save button.
The widget is deleted.
Page topCreating a dashboard layout
To create a layout:
- In the main menu, go to Monitoring & reporting → Dashboard, and the select the Detection and response tab.
- Open the drop-down list in the top right corner of the window and select Create layout.
The New layout window opens.
- In the Tenants drop-down list, select the tenants that will own the created layout and whose data will be used to fill the widgets of the layout.
The selection of tenants in this drop-down list does not matter if you want to create a universal layout (see below).
- In the Time period drop-down list, select the time period from which you require analytics:
- 1 hour
- 1 day (this value is selected by default)
- 7 days
- 30 days
- In period—receive analytics for the custom time period. The time period is set using the calendar that is displayed when this option is selected.
The upper boundary of the period is not included in the time slice defined by it. In other words, to receive analytics for a 24-hour period, you should configure the period as Day 1, 00:00:00 – Day 2, 00:00:00 instead of Day 1, 00:00:00 – Day 1, 23:59:59.
- In the Refresh every drop-down list, select how often data should be updated in layout widgets:
- 1 minute
- 5 minutes
- 15 minutes
- 1 hour (this value is selected by default)
- 24 hours
- In the Add widget drop-down list, select the required widget and configure its settings.
You can add multiple widgets to the layout.
You can also drag widgets around the window and resize them using the
 button that appears when you hover the mouse over a widget.
You can edit or delete widgets added to the layout. To do this, click the settings icon (
 ) and select Edit to change their configuration or Delete to delete them from the layout.
 - In the Layout name field, enter a unique name for this layout. Must contain 1 to 128 Unicode characters.
- If necessary, click the settings icon () on the right of the layout name field and select the check boxes next to the additional layout settings:
- Universal—if you select this check box, layout widgets display data from tenants that you select in the Selected tenants section in the menu on the left. This means that the data in the layout widgets will change based on your selected tenants without having to edit the layout settings. For universal layouts, tenants selected in the Tenants drop-down list are not taken into account.
If this check box is cleared, layout widgets display data from the tenants that are selected in the Tenants drop-down list in the layout settings. If any of the tenants selected in the layout are not available to you, their data will not be displayed in the layout widgets.
You cannot use the Active Lists widget in universal layouts.
Universal layouts can only be created and edited by a user who has been assigned the Main administrator role. Such layouts can be viewed by all users.
- Show CII-related data—if you select this check box, layout widgets will also show data on assets, alerts, and incidents related to critical information infrastructure (CII). In this case, these layouts will be available for viewing only by users whose settings have the Access to CII facilities check box selected.
If this check box is cleared, layout widgets will not display data on CII-related assets, alerts, and incidents, even if the user has access to CII objects.
- Universal—if you select this check box, layout widgets display data from tenants that you select in the Selected tenants section in the menu on the left. This means that the data in the layout widgets will change based on your selected tenants without having to edit the layout settings. For universal layouts, tenants selected in the Tenants drop-down list are not taken into account.
- Click Save.
The new layout is created and is displayed on the Detection and response tab of the dashboard.
Page topSelecting a dashboard layout
To select a dashboard layout:
- In the main menu, go to Monitoring & reporting → Dashboard, and the select the Detection and response tab.
- Expand the list in the upper right corner of the window.
- Select the relevant layout.
The selected layout is displayed on the Detection and response tab of the dashboard.
Page topSelecting a dashboard layout as the default
To set a dashboard layout as the default:
- In the main menu, go to Monitoring & reporting → Dashboard, and the select the Detection and response tab.
- Expand the list in the upper right corner of the window.
- Hover the mouse cursor over the relevant layout.
- Click the star icon (
 ).
).
The selected layout is displayed on the Detection and response tab of the dashboard by default.
Page topEditing a dashboard layout
To edit a dashboard layout:
- In the main menu, go to Monitoring & reporting → Dashboard, and the select the Detection and response tab.
- Expand the list in the upper right corner of the window.
- Hover the mouse cursor over the relevant layout.
- Click the edit icon ().
The Customizing layout window opens.
- Edit the dashboard layout. The settings that are available for editing are the same as the settings available when creating a layout.
- Click Save.
The dashboard layout is edited and displayed on the Detection and response tab.
If the layout is deleted or assigned to a different tenant while you are editing it, an error is displayed when you click Save. The layout is not saved. Refresh the Kaspersky Next XDR Expert interface page to see the list of available layouts in the drop-down list.
Page topDeleting a dashboard layout
To delete layout:
- In the main menu, go to Monitoring & reporting → Dashboard, and the select the Detection and response tab.
- Expand the list in the upper right corner of the window.
- Hover the mouse cursor over the relevant layout.
- Click the delete icon (
 ) and confirm this action.
The layout is deleted.
Page topEnabling and disabling TV mode
For convenient information presentation of the Detection and response tab, you can enable TV mode. This mode lets you view the Detection and response tab of the dashboard in full-screen mode in FullHD resolution. In TV mode, you can also configure a slide show display for the selected layouts.
It is recommended to create a separate user with the minimum required set of right to display analytics in TV mode.
To enable TV mode:
- In the main menu, go to Monitoring & reporting → Dashboard, and the select the Detection and response tab.
- Click the settings icon () in the upper-right corner.
The Settings window opens.
- Move the TV mode toggle switch to the Enabled position.
- To configure the slideshow display of the layouts, do the following:
- Move the Slideshow toggle switch to the Enabled position.
- In the Timeout field, specify how many seconds to wait before switching layouts.
- In the Queue drop-down list, select the layouts to view. If no layout is selected, the slideshow mode displays all layouts available to the user one after another.
- If necessary, change the order in which the layouts are displayed using the button
 to drag and drop them.
- Click Save.
TV mode will be enabled. To return to working with the Kaspersky Next XDR Expert interface, disable TV mode.
To disable TV mode:
- In the main menu, go to Monitoring & reporting → Dashboard, and the select the Detection and response tab.
- Click the settings icon () in the upper-right corner.
The Settings window opens.
- Move the TV mode toggle switch to the Disabled position.
- Click Save.
TV mode will be disabled. The left part of the screen shows a pane containing sections of the Kaspersky Next XDR Expert interface.
When you make changes to the layouts selected for the slideshow, those changes will automatically be applied to the active slideshow sessions.
Page topPreconfigured dashboard layouts
Kaspersky Next XDR Expert includes a set of predefined layouts that contain the following widgets:
- Alerts Overview layout (Alert overview):
- Active alerts—number of alerts that have not been closed.
- Unassigned alerts—number of alerts that have no assignee.
- Latest alerts—table with information about the last 10 unclosed alerts belonging to the tenants selected in the layout.
- Alerts distribution—number of alerts created during the period configured for the widget.
- Alerts by priority—number of unclosed alerts grouped by their priority.
- Alerts by assignee—number of alerts with the Assigned status. The grouping is by account name.
- Alerts by status—number of alerts that have the New, Opened, Assigned, or Escalated status. The grouping is by status.
- Affected users in alerts—number of users associated with alerts that have the New, Assigned, or Escalated status. The grouping is by account name.
- Affected assets—table with information about the level of importance of assets and the number of unclosed alerts they are associated with.
- Affected assets categories—categories of assets associated with unclosed alerts.
- Top event source by alerts number—number of alerts with the New, Assigned, or Escalated status, grouped by alert source (DeviceProduct event field).
The widget displays up to 10 event sources.
- Alerts by rule—number of alerts with the New, Assigned, or Escalated status, grouped by correlation rules.
- Incidents Overview layout (Incidents overview):
- Active incidents—number of incidents that have not been closed.
- Unassigned incidents—number of incidents that have the Opened status.
- Latest incidents—table with information about the last 10 unclosed incidents belonging to the tenants selected in the layout.
- Incidents distribution—number of incidents created during the period configured for the widget.
- Incidents by priority—number of unclosed incidents grouped by their priority.
- Incidents by assignee—number of incidents with the Assigned status. The grouping is by user account name.
- Incidents by status—number of incidents grouped by their status.
- Affected assets in incidents—number of assets associated with unclosed incidents.
- Affected users in incidents—users associated with incidents.
- Affected asset categories in incidents—categories of assets associated with unclosed incidents.
- Active incidents by tenant—number of incidents of all statuses, grouped by tenant.
- Network Overview layout (Network activity overview):
- Netflow top internal IPs—total volume of netflow traffic received by the asset, in bytes. The data is grouped by internal IP addresses of assets.
The widget displays up to 10 IP addresses.
- Netflow top external IPs—total volume of netflow traffic received by the asset, in bytes. The data is grouped by external IP addresses of assets.
- Netflow top hosts for remote control—number of events associated with access attempts to one of the following ports: 3389, 22, 135. The data is grouped by asset name.
- Netflow total bytes by internal ports—number of bytes sent to internal ports of assets. The data is grouped by port number.
- Top Log Sources by Events count—top 10 sources from which the greatest number of events was received.
- Netflow top internal IPs—total volume of netflow traffic received by the asset, in bytes. The data is grouped by internal IP addresses of assets.
The default refresh period for predefined layouts is Never. You can edit these layouts as needed.
Page topAbout the Dashboard-only mode
You can configure the Dashboard-only mode for employees who do not manage the network but who want to view the network protection statistics in Open Single Management Platform (for example, a top manager). When a user has this mode enabled, only a dashboard with a predefined set of widgets is displayed to the user. Thus, he or she can monitor the statistics specified in the widgets, for example, the protection status of all managed devices, the number of recently detected threats, or the list of the most frequent threats in the network.
When a user works in the Dashboard-only mode, the following restrictions are applied:
- The main menu is not displayed to the user, so he or she cannot change the network protection settings.
- The user cannot perform any actions with widgets, for example, add or hide them. Therefore, you need to put all widgets required for the user on the dashboard and configure them, for instance, set the rule of counting objects or specify the time interval.
You cannot assign the Dashboard-only mode to yourself. If you want to work in this mode, contact a system administrator, Managed Service Provider (MSP), or a user with the Modify object ACLs right in the General features: User permissions functional area.
Configuring the Dashboard-only mode
Before you begin to configure the Dashboard-only mode, make sure that the following prerequisites are met:
- You have the Modify object ACLs right in the General features: User permissions functional area. If you do not have this right, the tab for configuring the mode will be missing.
- The user has the Read right in the General features: Basic functionality functional area.
If a hierarchy of Administration Servers is arranged in your network, for configuring the Dashboard-only mode go to the Server where the user account is available on the Users tab of the Users & roles → Users & groups section. It can be a primary server or physical secondary server. It is not possible to adjust the mode on a virtual server.
To configure the Dashboard-only mode:
- In the main menu, go to Users & roles → Users & groups, and then select the Users tab.
- Click the user account name for which you want to adjust the dashboard with widgets.
- In the account settings window that opens, select the Dashboard tab.
On the tab that opens, the same dashboard is displayed for you as for the user.
- If the Display the console in Dashboard-only mode option is enabled, switch the toggle button to disable it.
When this option is enabled, you are also unable to change the dashboard. After you disable the option, you can manage widgets.
- Configure the dashboard appearance. The set of widgets prepared on the Dashboard tab is available for the user with the customizable account. He or she cannot change any settings or size of the widgets, add, or remove any widgets from the dashboard. Therefore, adjust them for the user, so he or she can view the network protection statistics. For this purpose, on the Dashboard tab you can perform the same actions with widgets as in the Monitoring & reporting → Dashboard section:
- Add new widgets to the dashboard.
- Hide widgets that the user doesn't need.
- Move widgets into a specific order.
- Change the size or appearance of widgets.
- Change the widget settings.
- Switch the toggle button to enable the Display the console in Dashboard-only mode option.
After that, only the dashboard is available for the user. He or she can monitor statistics but cannot change the network protection settings and dashboard appearance. As the same dashboard is displayed for you as for the user, you are also unable to change the dashboard.
If you keep the option disabled, the main menu is displayed for the user, so he or she can perform various actions in Open Single Management Platform, including changing security settings and widgets.
- Click the Save button when you finish configuring the Dashboard-only mode. Only after that will the prepared dashboard be displayed to the user.
- If the user wants to view statistics of supported Kaspersky applications and needs access rights to do so, configure the rights for the user. After that, Kaspersky applications data is displayed for the user in the widgets of these applications.
Now the user can log in to Open Single Management Platform under the customized account and monitor the network protection statistics in the Dashboard-only mode.
Page topReports
This section describes how to use reports, manage custom report templates, use report templates to generate new reports, and create report delivery tasks.
Using reports
The Reports feature allows you to get detailed numerical information about the security of your organization's network, save this information to a file, send it by email, and print it.
Reports are available in the OSMP Console, in the Monitoring & reporting section, by clicking Reports.
By default, reports include information for the last 30 days.
Open Single Management Platform has a default set of reports for the following categories:
- Protection status
- Deployment
- Updating
- Threat statistics
- Other
You can create custom report templates, edit report templates, and delete them.
You can create reports that are based on existing templates, export reports to files, and create tasks for report delivery.
Creating a report template
To create a report template:
- In the main menu, go to Monitoring & reporting → Reports.
- Click Add.
The New report template wizard starts. Proceed through the wizard by using the Next button.
- Enter the report name and select the report type.
- On the Scope step of the wizard, select the set of client devices (administration group, device selection, selected devices, or all networked devices) whose data will be displayed in reports that are based on this report template.
- On the Reporting period step of the wizard, specify the report period. Available values are as follows:
- Between the two specified dates
- From the specified date to the report creation date
- From the report creation date, minus the specified number of days, to the report creation date
This page may not appear for some reports.
- Click OK to close the wizard.
- Do one of the following:
- Click the Save and run button to save the new report template and to run a report based on it.
The report template is saved. The report is generated.
- Click the Save button to save the new report template.
The report template is saved.
- Click the Save and run button to save the new report template and to run a report based on it.
You can use the new template for generating and viewing reports.
Viewing and editing report template properties
You can view and edit basic properties of a report template, for example, the report template name or the fields displayed in the report.
To view and edit properties of a report template:
- In the main menu, go to Monitoring & reporting → Reports.
- Select the check box next to the report template whose properties you want to view and edit.
As an alternative, you can first generate the report, and then click the Edit button.
- Click the Open report template properties button.
The Editing report <Report name> window opens with the General tab selected.
- Edit the report template properties:
- General tab:
- Report template name
- Maximum number of entries to display
- Group
Click the Settings button to change the set of client devices for which the report is created. For some types of the reports, the button may be unavailable. The actual settings depend on the settings specified during creation of the report template.
- Time interval
Click the Settings button to modify the report period. For some types of the reports, the button may be unavailable. Available values are as follows:
- Between the two specified dates
- From the specified date to the report creation date
- From the report creation date, minus the specified number of days, to the report creation date
- Include data from secondary and virtual Administration Servers
- Up to nesting level
- Data wait interval (min)
- Cache data from secondary Administration Servers
- Cache update frequency (h)
- Transfer detailed information from secondary Administration Servers
- Fields tab
Select the fields that will be displayed in the report, and use the Move up button and Move down button to change the order of these fields. Use the Add button or Edit button to specify whether the information in the report must be sorted and filtered by each of the fields.
In the Filters of Details fields section, you can also click the Convert filters button to start using the extended filtering format. This format enables you to combine filtering conditions specified in various fields by using the logical OR operation. After you click the button, the Convert filters panel opens on the right. Click the Convert filters button to confirm conversion. You can now define a converted filter with conditions from the Details fields section that are applied by using the logical OR operation.
Conversion of a report to the format supporting complex filtering conditions will make the report incompatible with the previous versions of Kaspersky Security Center (11 and earlier). Also, the converted report will not contain any data from secondary Administration Servers running such incompatible versions.
- General tab:
- Click Save to save the changes.
- Close the Editing report <Report name> window.
The updated report template appears in the list of report templates.
Page topExporting a report to a file
You can save one or multiple reports as XML, HTML, or PDF. Open Single Management Platform allows you to export up to 10 reports to files of the specified format at the same time.
PDF format is available only if you are connected to the secondary Administration Server in OSMP Console.
To export a report to a file:
- In the main menu, go to Monitoring & reporting → Reports.
- Choose the reports that you want to export.
If you choose more than 10 reports, the Export report button will be disabled.
- Click the Export report button.
- In the window that opens, specify the following export parameters:
- File name.
If you select one report to export, specify the report file name.
If you select more than one report, the report file names will coincide with the name of the selected report templates.
- Maximum number of entries.
Specify the maximum number of entries included in the report file. The default value is 10,000.
You can export a report with an unlimited number of entries. Note that if your report contains a large number of entries, the time required for generating and exporting the report increases.
- File format.
Select the report file format: XML, HTML, or PDF. If you export multiple reports, all selected reports are saved in the specified format as separate files.
PDF format is available only if you are connected to the secondary Administration Server in OSMP Console.
The wkhtmltopdf tool is required to convert a report to PDF. When you select the PDF option, secondary Administration Server checks whether the wkhtmltopdf tool is installed on the device. If the tool is not installed, the application displays a message about the necessity to install the tool on the Administration Server device. Install the tool manually, and then proceed to the next step.
- File name.
- Click the Export report button.
The report is saved to a file in the specified format.
Page topGenerating and viewing a report
To create and view a report:
- In the main menu, go to Monitoring & reporting → Reports.
- Click the name of the report template that you want to use to create a report.
A report using the selected template is generated and displayed.
Report data is displayed according to the localization set for the Administration Server.
In the generated reports, some fonts may be displayed incorrectly on the diagrams. To resolve this issue, install the fontconfig library. Also, please check that the fonts corresponding to your operating system locale are installed in the operating system.
The report displays the following data:
- On the Summary tab:
- The name and type of report, a brief description and the reporting period, as well as information about the group of devices for which the report is generated.
- Graph chart showing the most representative report data.
- Consolidated table with calculated report indicators.
- On the Details tab, a table with detailed report data is displayed.
Creating a report delivery task
You can create a task that will deliver selected reports.
To create a report delivery task:
- In the main menu, go to Monitoring & reporting → Reports.
- [Optional] Select the check boxes next to the report templates for which you want to create a report delivery task.
- Click the Create delivery task button.
- The New task wizard starts. Proceed through the wizard by using the Next button.
- On the first page of the wizard, enter the task name. The default name is Deliver reports (<N>), where <N> is the sequence number of the task.
- On the task settings page of the wizard, specify the following settings:
- Report templates to be delivered by the task. If you selected them at step 2, skip this step.
- The report format: HTML, XLS, or PDF.
PDF format is available only if you are connected to the secondary Administration Server in OSMP Console.
The wkhtmltopdf tool is required to convert a report to PDF. When you select the PDF option, secondary Administration Server checks whether the wkhtmltopdf tool is installed on the device. If the tool is not installed, the application displays a message about the necessity to install the tool on the Administration Server device. Install the tool manually, and then proceed to the next step.
- Whether the reports are to be sent by email, together with email notification settings.
- Whether the reports are to be saved to a folder, whether previously saved reports in this folder are to be overwritten, and whether a specific account is to be used to access the folder (for a shared folder).
- If you want to modify other task settings after the task is created, on the Finish task creation page of the wizard enable the Open task details when creation is complete option.
- Click the Create button to create the task and close the wizard.
The report delivery task is created. If you enabled the Open task details when creation is complete option, the task settings window opens.
Deleting report templates
To delete one or several report templates:
- In the main menu, go to Monitoring & reporting → Reports.
- Select check boxes next to the report templates that you want to delete.
- Click the Delete button.
- In the window that opens, click OK to confirm your selection.
The selected report templates are deleted. If these report templates were included in the report delivery tasks, they are also removed from the tasks.
Events and event selections
This section provides information about events and event selections, about the types of events that occur in Open Single Management Platform components, and about managing frequent events blocking.
About events in Open Single Management Platform
Open Single Management Platform allows you to receive information about events that occur during the operation of Administration Server and Kaspersky applications installed on managed devices. Information about events is saved in the Administration Server database.
Events by type
In Open Single Management Platform, there are the following types of events:
- General events. These events occur in all managed Kaspersky applications. An example of a general event is Virus outbreak. General events have strictly defined syntax and semantics. General events are used, for instance, in reports and dashboards.
- Managed Kaspersky applications-specific events. Each managed Kaspersky application has its own set of events.
Events by source
You can view the full list of the events that can be generated by an application on the Event configuration tab in the application policy. For Administration Server, you can additionally view the event list in the Administration Server properties.
Events can be generated by the following applications:
- Open Single Management Platform components:
- Managed Kaspersky applications
For details about the events generated by Kaspersky managed applications, please refer to the documentation of the corresponding application.
Events by importance level
Each event has its own importance level. Depending on the conditions of its occurrence, an event can be assigned various importance levels. There are four importance levels of events:
- A critical event is an event that indicates the occurrence of a critical problem that may lead to data loss, an operational malfunction, or a critical error.
- A functional failure is an event that indicates the occurrence of a serious problem, error, or malfunction that occurred during operation of the application or while performing a procedure.
- A warning is an event that is not necessarily serious, but nevertheless indicates a potential problem in the future. Most events are designated as warnings if the application can be restored without loss of data or functional capabilities after such events occur.
- An info event is an event that occurs for the purpose of informing about successful completion of an operation, proper functioning of the application, or completion of a procedure.
Each event has a defined storage term, during which you can view or modify it in Open Single Management Platform. Some events are not saved in the Administration Server database by default because their defined storage term is zero. Only events that will be stored in the Administration Server database for at least one day can be exported to external systems.
Events of Open Single Management Platform components
Each Open Single Management Platform component has its own set of event types. This section lists types of events that occur in Kaspersky Security Center Administration Server and Network Agent. Types of events that occur in Kaspersky applications are not listed in this section.
For each event that can be generated by an application, you can specify notification settings and storage settings on the Event configuration tab in the application policy. For Administration Server, you can additionally view and configure the event list in the Administration Server properties. If you want to configure notification settings for all the events at once, configure general notification settings in the Administration Server properties.
Data structure of event type description
For each event type, its display name, identifier (ID), alphabetic code, description, and the default storage term are provided.
- Event type display name. This text is displayed in Open Single Management Platform when you configure events and when they occur.
- Event type ID. This numerical code is used when you process events by using third-party tools for event analysis.
- Event type (alphabetic code). This code is used when you browse and process events by using public views that are provided in the Open Single Management Platform database and when events are exported to a SIEM system.
- Description. This text contains the situations when an event occurs and what you can do in such a case.
- Default storage term. This is the number of days during which the event is stored in the Administration Server database and is displayed in the list of events on Administration Server. After this period elapses, the event is deleted. If the event storage term value is 0, such events are detected but are not displayed in the list of events on Administration Server. If you configured to save such events to the operating system event log, you can find them there.
You can change the storage term for events: Setting the storage term for an event
Administration Server events
This section contains information about the events related to the Administration Server.
Administration Server critical events
The table below shows the events of Kaspersky Security Center Administration Server that have the Critical importance level.
For each event that can be generated by an application, you can specify notification settings and storage settings on the Event configuration tab in the application policy. For Administration Server, you can additionally view and configure the event list in the Administration Server properties. If you want to configure notification settings for all the events at once, configure general notification settings in the Administration Server properties.
Administration Server critical events
Event type display name |
Event type ID |
Event type |
Description |
Default storage term |
|---|---|---|---|---|
License limit has been exceeded |
4099 |
KLSRV_EV_LICENSE_CHECK_MORE_110 |
Once a day Open Single Management Platform checks whether a license limit is exceeded. Events of this type occur when Administration Server detects that some licensing limits are exceeded by Kaspersky applications installed on client devices and if the number of currently used licensing units covered by a single license exceeds 110% of the total number of units covered by the license. Even when this event occurs, client devices are protected. You can respond to the event in the following ways:
Open Single Management Platform determines the rules to generate events when a licensing limit is exceeded. |
180 days |
Device has become unmanaged |
4111 |
KLSRV_HOST_OUT_CONTROL |
Events of this type occur if a managed device is visible on the network but has not connected to Administration Server for a specific period. Find out what prevents the proper functioning of Network Agent on the device. Possible causes include network issues and removal of Network Agent from the device. |
180 days |
Device status is Critical |
4113 |
KLSRV_HOST_STATUS_CRITICAL |
Events of this type occur when a managed device is assigned the Critical status. You can configure the conditions under which the device status is changed to Critical. |
180 days |
The key file has been added to the denylist |
4124 |
KLSRV_LICENSE_BLACKLISTED |
Events of this type occur when Kaspersky has added the activation code or key file that you use to the denylist. Contact Technical Support for more details. |
180 days |
License expires soon |
4129 |
KLSRV_EV_LICENSE_SRV_EXPIRE_SOON |
Events of this type occur when the commercial license expiration date is approaching. Once a day Open Single Management Platform checks whether a license expiration date is approaching. Events of this type are published 30 days, 15 days, 5 days, and 1 day before the license expiration date. This number of days cannot be changed. If the Administration Server is turned off on the specified day before the license expiration date, the event will not be published until the next day. When the commercial license expires, Open Single Management Platform provides only basic functionality. You can respond to the event in the following ways:
|
180 days |
Certificate has expired |
4132 |
KLSRV_CERTIFICATE_EXPIRED |
Events of this type occur when the Administration Server certificate for Mobile Device Management expires. You need to update the expired certificate. |
180 days |
Administration Server functional failure events
The table below shows the events of Kaspersky Security Center Administration Server that have the Functional failure importance level.
For each event that can be generated by an application, you can specify notification settings and storage settings on the Event configuration tab in the application policy. For Administration Server, you can additionally view and configure the event list in the Administration Server properties. If you want to configure notification settings for all the events at once, configure general notification settings in the Administration Server properties.
Administration Server functional failure events
Event type display name |
Event type ID |
Event type |
Description |
Default storage term |
|---|---|---|---|---|
Runtime error
|
4125
|
KLSRV_RUNTIME_ERROR
|
Events of this type occur because of unknown issues. Most often these are DBMS issues, network issues, and other software and hardware issues. Details of the event can be found in the event description.
|
180 days
|
Failed to copy the updates to the specified folder |
4123 |
KLSRV_UPD_REPL_FAIL |
Events of this type occur when software updates are copied to an additional shared folder(s). You can respond to the event in the following ways:
|
180 days |
No free disk space |
4107 |
KLSRV_DISK_FULL |
Events of this type occur when the hard drive of the device on which Administration Server is installed runs out of free space. Free up disk space on the device. |
180 days |
Shared folder is not available |
4108 |
KLSRV_SHARED_FOLDER_UNAVAILABLE |
Events of this type occur if the shared folder of Administration Server is not available. You can respond to the event in the following ways:
|
180 days |
The Administration Server database is unavailable |
4109 |
KLSRV_DATABASE_UNAVAILABLE |
Events of this type occur if the Administration Server database becomes unavailable. You can respond to the event in the following ways:
|
180 days |
No free space in the Administration Server database |
4110 |
KLSRV_DATABASE_FULL |
Events of this type occur when there is no free space in the Administration Server database. Administration Server does not function when its database has reached its capacity and when further recording to the database is not possible. Following are the causes of this event, depending on the DBMS that you use, and appropriate responses to the event:
Review the information on DBMS selection. |
180 days |
Failed to poll the cloud segment |
4143 |
KLSRV_KLCLOUD_SCAN_ERROR |
Events of this type occur when Administration Server fails to poll a network segment in a cloud environment. Read the details in the event description and respond accordingly. |
Not stored |
Administration Server warning events
The table below shows the events of Kaspersky Security Center Administration Server that have the Warning importance level.
For each event that can be generated by an application, you can specify notification settings and storage settings on the Event configuration tab in the application policy. For Administration Server, you can additionally view and configure the event list in the Administration Server properties. If you want to configure notification settings for all the events at once, configure general notification settings in the Administration Server properties.
Administration Server warning events
Event type display name |
Event type ID |
Event type |
Description |
Default storage term |
|---|---|---|---|---|
A frequent event has been detected |
|
KLSRV_EVENT_SPAM_EVENTS_DETECTED |
Events of this type occur when Administration Server detects a frequent event on a managed device. Refer to the following section for details: Blocking frequent events. |
90 days |
License limit has been exceeded |
4098 |
KLSRV_EV_LICENSE_CHECK_100_110 |
Once a day Open Single Management Platform checks whether a licensing limit is exceeded. Events of this type occur when Administration Server detects that some licensing limits are exceeded by Kaspersky applications installed on client devices and if the number of currently used licensing units covered by a single license constitute 100% to 110% of the total number of units covered by the license. Even when this event occurs, client devices are protected. You can respond to the event in the following ways:
Open Single Management Platform determines the rules to generate events when a licensing limit is exceeded. |
90 days |
Device has remained inactive on the network for a long time |
4103 |
KLSRV_EVENT_HOSTS_NOT_VISIBLE |
Events of this type occur when a managed device shows inactivity for some time. Most often, this happens when a managed device is decommissioned. You can respond to the event in the following ways:
|
90 days |
Conflict of device names |
4102 |
KLSRV_EVENT_HOSTS_CONFLICT |
Events of this type occur when Administration Server considers two or more managed devices as a single device. Most often this happens when a cloned hard drive was used for software deployment on managed devices and without switching the Network Agent to the dedicated disk cloning mode on a reference device. To avoid this issue, switch Network Agent to the disk cloning mode on a reference device before cloning the hard drive of this device. |
90 days |
Device status is Warning
|
4114
|
KLSRV_HOST_STATUS_WARNING
|
Events of this type occur when a managed device is assigned the Warning status. You can configure the conditions under which the device status is changed to Warning.
|
90 days
|
Certificate has been requested |
4133 |
KLSRV_CERTIFICATE_REQUESTED |
Events of this type occur when a certificate for Mobile Device Management fails to be automatically reissued. Following might be the causes and appropriate responses to the event:
|
90 days |
Certificate has been removed |
4134 |
KLSRV_CERTIFICATE_REMOVED |
Events of this type occur when an administrator removes any type of certificate (General, Mail, VPN) for Mobile Device Management. After removing a certificate, mobile devices connected via this certificate will fail to connect to Administration Server. This event might be helpful when investigating malfunctions associated with the management of mobile devices. |
90 days |
APNs certificate has expired |
4135 |
KLSRV_APN_CERTIFICATE_EXPIRED |
Events of this type occur when an APNs certificate expires. You need to manually renew the APNs certificate and install it on an iOS MDM Server. |
Not stored |
APNs certificate expires soon |
4136 |
KLSRV_APN_CERTIFICATE_EXPIRES_SOON |
Events of this type occur when there are fewer than 14 days left before the APNs certificate expires. When the APNs certificate expires, you need to manually renew the APNs certificate and install it on an iOS MDM Server. We recommend that you schedule the APNs certificate renewal in advance of the expiration date. |
Not stored |
Failed to send the FCM message to the mobile device |
4138 |
KLSRV_GCM_DEVICE_ERROR |
Events of this type occur when Mobile Device Management is configured to use Google Firebase Cloud Messaging (FCM) for connecting to managed mobile devices with an Android operating system and FCM Server fails to handle some of the requests received from Administration Server. It means that some of the managed mobile devices will not receive a push notification. Read the HTTP code in the details of the event description and respond accordingly. For more information on the HTTP codes received from FCM Server and related errors, please refer to the Google Firebase service documentation (see chapter "Downstream message error response codes"). |
90 days |
HTTP error sending the FCM message to the FCM server |
4139 |
KLSRV_GCM_HTTP_ERROR |
Events of this type occur when Mobile Device Management is configured to use Google Firebase Cloud Messaging (FCM) for connecting managed mobile devices with the Android operating system and FCM Server reverts to the Administration Server a request with a HTTP code other than 200 (OK). Following might be the causes and appropriate responses to the event:
|
90 days |
Failed to send the FCM message to the FCM server |
4140 |
KLSRV_GCM_GENERAL_ERROR |
Events of this type occur due to unexpected errors on the Administration Server side when working with the Google Firebase Cloud Messaging HTTP protocol. Read the details in the event description and respond accordingly. If you cannot find the solution to an issue on your own, we recommend that you contact Kaspersky Technical Support. |
90 days |
Little free space on the hard drive |
4105 |
KLSRV_NO_SPACE_ON_VOLUMES |
Events of this type occur when the hard drive of the device on which Administration Server is installed almost runs out of free space. Free up disk space on the device. |
90 days |
Little free space in the Administration Server database |
4106 |
KLSRV_NO_SPACE_IN_DATABASE |
Events of this type occur if space in the Administration Server database is too limited. If you do not remedy the situation, soon the Administration Server database will reach its capacity and Administration Server will not function. Following are the causes of this event, depending on the DBMS that you use, and the appropriate responses to the event. You use the SQL Server Express Edition DBMS:
You use a DBMS other than SQL Server Express Edition:
Review the information on DBMS selection. |
90 days |
Connection to the secondary Administration Server has been interrupted |
4116 |
KLSRV_EV_SLAVE_SRV_DISCONNECTED |
Events of this type occur when a connection to the secondary Administration Server is interrupted. Read the operating system log on the device where the secondary Administration Server is installed and respond accordingly. |
90 days |
Connection to the primary Administration Server has been interrupted |
4118 |
KLSRV_EV_MASTER_SRV_DISCONNECTED |
Events of this type occur when a connection to the primary Administration Server is interrupted. Read the operating system log on the device where the primary Administration Server is installed and respond accordingly. |
90 days |
New updates for Kaspersky application modules have been registered |
4141 |
KLSRV_SEAMLESS_UPDATE_REGISTERED |
Events of this type occur when Administration Server registers new updates for the Kaspersky software installed on managed devices that require approval to be installed. Approve or decline the updates by using Kaspersky Security Center Web Console. |
90 days |
The limit on the number of events in the database is exceeded, deletion of events has started |
4145 |
KLSRV_EVP_DB_TRUNCATING |
Events of this type occur when deletion of old events from the Administration Server database has started after the Administration Server database capacity is reached. You can respond to the event in the following ways: |
Not stored |
The limit on the number of events in the database is exceeded, the events have been deleted |
4146 |
KLSRV_EVP_DB_TRUNCATED |
Events of this type occur when old events have been deleted from the Administration Server database after the Administration Server database capacity is reached. You can respond to the event in the following ways: |
Not stored |
Administration Server informational events
The table below shows the events of Kaspersky Security Center Administration Server that have the Info importance level.
For each event that can be generated by an application, you can specify notification settings and storage settings on the Event configuration tab in the application policy. For Administration Server, you can additionally view and configure the event list in the Administration Server properties. If you want to configure notification settings for all the events at once, configure general notification settings in the Administration Server properties.
Administration Server informational events
Event type display name |
Event type ID |
Event type |
Default storage term |
Remarks |
|---|---|---|---|---|
Over 90% of the license key is used up |
4097 |
KLSRV_EV_LICENSE_CHECK_90 |
30 days |
Events of this type occur when Administration Server detects that some licensing limits are close to being exceeded by Kaspersky applications installed on client devices and if the number of currently used licensing units covered by a single license constitute over 90% of the total number of units covered by the license. Even when a licensing limit is exceeded, client devices are protected. You can respond to the event in the following ways:
Open Single Management Platform determines the rules to generate events when a licensing limit is exceeded. |
New device has been detected |
4100 |
KLSRV_EVENT_HOSTS_NEW_DETECTED |
30 days |
Events of this type occur when new networked devices have been discovered. |
Device has been automatically added to the group |
4101 |
KLSRV_EVENT_HOSTS_NEW_REDIRECTED |
30 days |
Events of this type occur when devices have been assigned to a group according to device moving rules. |
Device has been removed from the group: inactive on the network for a long time
|
4104
|
KLSRV_INVISIBLE_HOSTS_REMOVED
|
30 days
|
|
Files have been found to send to Kaspersky for analysis |
4131 |
KLSRV_APS_FILE_APPEARED |
30 days |
|
FCM Instance ID has changed on this mobile device |
4137 |
KLSRV_GCM_DEVICE_REGID_CHANGED |
30 days |
|
Updates have been successfully copied to the specified folder |
4122 |
KLSRV_UPD_REPL_OK |
30 days |
|
Connection to the secondary Administration Server has been established |
4115 |
KLSRV_EV_SLAVE_SRV_CONNECTED |
30 days |
|
Connection to the primary Administration Server has been established |
4117 |
KLSRV_EV_MASTER_SRV_CONNECTED |
30 days |
|
Databases have been updated |
4144 |
KLSRV_UPD_BASES_UPDATED |
30 days |
|
Audit: Connection to the Administration Server has been established |
4147 |
KLAUD_EV_SERVERCONNECT |
30 days |
|
Audit: Object has been modified |
4148 |
KLAUD_EV_OBJECTMODIFY |
30 days |
This event tracks changes in the following objects:
|
Audit: Object status has changed |
4150 |
KLAUD_EV_TASK_STATE_CHANGED |
30 days |
For example, this event occurs when a task has failed with an error. |
Audit: Group settings have been modified |
4149 |
KLAUD_EV_ADMGROUP_CHANGED |
30 days |
|
Audit: Connection to Administration Server has been terminated |
4151 |
KLAUD_EV_SERVERDISCONNECT |
30 days |
|
Audit: Object properties have been modified |
4152 |
KLAUD_EV_OBJECTPROPMODIFIED |
30 days |
This event tracks changes in the following properties:
|
Audit: User permissions have been modified |
4153 |
KLAUD_EV_OBJECTACLMODIFIED |
30 days |
|
Audit: Encryption keys have been imported or exported from Administration Server |
5100 |
KLAUD_EV_DPEKEYSEXPORT |
30 days |
|
Network Agent events
This section contains information about the events related to Network Agent.
Network Agent warning events
The table below shows the events of Network Agent that have the Warning severity level.
For each event that can be generated by an application, you can specify notification settings and storage settings on the Event configuration tab in the application policy. If you want to configure notification settings for all the events at once, configure general notification settings in the Administration Server properties.
Network Agent warning events
Event type display name |
Event type ID |
Event type |
Description |
Default storage term |
|---|---|---|---|---|
Security issue has occurred |
549 |
GNRL_EV_APP_INCIDENT_OCCURED |
Events of this type occur when an incident has been found on a device. For example, this event occurs when the device has low disk space. |
30 days |
KSN Proxy has started. Failed to check KSN for availability |
7718 |
KSNPROXY_STARTED_CON_CHK_FAILED |
Events of this type occur when test connection fails for the configured KSN proxy connection. |
30 days |
Third-party software update installation has been postponed |
7698 |
KLNAG_EV_3P_PATCH_INSTALL_SLIPPED |
For example, events of this type occur when EULA for a third-party update installation is declined. |
30 days |
Third-party software update installation has completed with a warning |
7696 |
KLNAG_EV_3P_PATCH_INSTALL_WARNING |
Download the trace files and check the KLRI_PATCH_RES_DESC field value for details. |
30 days |
Warning has been returned during installation of the software module update |
7701 |
KLNAG_EV_PATCH_INSTALL_WARNING |
Download the trace files and check the KLRI_PATCH_RES_DESC field value for details. |
30 days |
Network Agent informational events
The table below shows the events of Network Agent that have the Info severity level.
For each event that can be generated by an application, you can specify notification settings and storage settings on the Event configuration tab in the application policy. If you want to configure notification settings for all the events at once, configure general notification settings in the Administration Server properties.
Network Agent informational events
Event type display name |
Event type ID |
Event type |
Default storage term |
|---|---|---|---|
Application has been installed |
7703 |
KLNAG_EV_INV_APP_INSTALLED |
30 days |
Application has been uninstalled |
7704 |
KLNAG_EV_INV_APP_UNINSTALLED |
30 days |
Monitored application has been installed |
7705 |
KLNAG_EV_INV_OBS_APP_INSTALLED |
30 days |
Monitored application has been uninstalled |
7706 |
KLNAG_EV_INV_OBS_APP_UNINSTALLED |
30 days |
New device has been added |
7708 |
KLNAG_EV_DEVICE_ARRIVAL |
30 days |
Device has been removed |
7709 |
KLNAG_EV_DEVICE_REMOVE |
30 days |
New device has been detected |
7710 |
KLNAG_EV_NAC_DEVICE_DISCOVERED |
30 days |
Device has been authorized |
7711 |
KLNAG_EV_NAC_HOST_AUTHORIZED |
30 days |
KSN Proxy has started. KSN availability check has completed successfully |
7719 |
KSNPROXY_STARTED_CON_CHK_OK |
30 days |
KSN Proxy has stopped |
7720 |
KSNPROXY_STOPPED |
30 days |
Third-party application has been installed |
7707 |
KLNAG_EV_INV_CMPTR_APP_INSTALLED |
30 days |
Third-party software update has been installed successfully |
7694 |
KLNAG_EV_3P_PATCH_INSTALLED_SUCCESSFULLY |
30 days |
Third-party software update installation has started |
7695 |
KLNAG_EV_3P_PATCH_INSTALL_STARTING |
30 days |
Installation of the software module update has started |
7700 |
KLNAG_EV_PATCH_INSTALL_STARTING |
30 days |
Windows Desktop Sharing: Application has been started |
7714 |
KLUSRLOG_EV_PROCESS_LAUNCHED |
30 days |
Windows Desktop Sharing: File has been modified |
7713 |
KLUSRLOG_EV_FILE_MODIFIED |
30 days |
Windows Desktop Sharing: File has been read |
7712 |
KLUSRLOG_EV_FILE_READ |
30 days |
Windows Desktop Sharing: Started |
7715 |
KLUSRLOG_EV_WDS_BEGIN |
30 days |
Windows Desktop Sharing: Stopped |
7716 |
KLUSRLOG_EV_WDS_END |
30 days |
Using event selections
Event selections provide an onscreen view of named sets of events that are selected from the Administration Server database. These sets of events are grouped according to the following categories:
- By importance level—Critical events, Functional failures, Warnings, and Info events
- By time—Recent events
- By type—User requests and Audit events
You can create and view user-defined event selections based on the settings available, in the OSMP Console interface, for configuration.
Event selections are available in the OSMP Console, in the Monitoring & reporting section, by clicking Event selections.
By default, event selections include information for the last seven days.
Open Single Management Platform has a default set of event (predefined) selections:
- Events with different importance levels:
- Critical events
- Functional failures
- Warnings
- Informational messages
- User requests (events of managed applications)
- Recent events (over the last week)
- Audit events.
In Kaspersky Next XDR Expert, audit events related to service operations in your OSMP Console are displayed. These events are conditioned by actions of Kaspersky specialists. These events, for example include the following: logging in to Administration Server; Administration Server ports changing; Administration Server database backup; creation, modification, and deletion of user accounts.
You can also create and configure additional user-defined selections. In user-defined selections, you can filter events by the properties of the devices they originated from (device names, IP ranges, and administration groups), by event types and severity levels, by application and component name, and by time interval. It is also possible to include task results in the search scope. You can also use a simple search field where a word or several words can be typed. All events that contain any of the typed words anywhere in their attributes (such as event name, description, component name) are displayed.
Both for predefined and user-defined selections, you can limit the number of displayed events or the number of records to search. Both options affect the time it takes Open Single Management Platform to display the events. The larger the database is, the more time-consuming the process can be.
You can do the following:
- Edit properties of event selections
- Generate event selections
- View details of event selections
- Delete event selections
- Delete events from the Administration Server database
Creating an event selection
To create an event selection:
- In the main menu, go to Monitoring & reporting → Event selections.
- Click Add.
- In the New event selection window that opens, specify the settings of the new event selection. Do this in one or more of the sections in the window.
- Click Save to save the changes.
The confirmation window opens.
- To view the event selection result, keep the Go to selection result check box selected.
- Click Save to confirm the event selection creation.
If you kept the Go to selection result check box selected, the event selection result is displayed. Otherwise, the new event selection appears in the list of event selections.
Editing an event selection
To edit an event selection:
- In the main menu, go to Monitoring & reporting → Event selections.
- Select the check box next to the event selection that you want to edit.
- Click the Properties button.
An event selection settings window opens.
- Edit the properties of the event selection.
For predefined event selections, you can edit only the properties on the following tabs: General (except for the selection name), Time, and Access rights.
For user-defined selections, you can edit all properties.
- Click Save to save the changes.
The edited event selection is shown in the list.
Viewing a list of an event selection
To view an event selection:
- In the main menu, go to Monitoring & reporting → Event selections.
- Select the check box next to the event selection that you want to start.
- Do one of the following:
- If you want to configure sorting in the event selection result, do the following:
- Click the Reconfigure sorting and start button.
- In the displayed Reconfigure sorting for event selection window, specify the sorting settings.
- Click the name of the selection.
- Otherwise, if you want to view the list of events as they are sorted on the Administration Server, click the name of the selection.
- If you want to configure sorting in the event selection result, do the following:
The event selection result is displayed.
Exporting an event selection
Open Single Management Platform allows you to save an event selection and its settings to a KLO file. You can use this KLO file to import the saved event selection both to Kaspersky Security Center Windows and Kaspersky Security Center Linux.
Note that you can export only user-defined event selections. Event selections from the default set of Open Single Management Platform (predefined selections) cannot be saved to a file.
To export an event selection:
- In the main menu, go to Monitoring & reporting → Event selections.
- Select the check box next to the event selection that you want to export.
You cannot export multiple event selections at the same time. If you select more than one selection, the Export button will be disabled.
- Click the Export button.
- In the opened Save as window, specify the event selection file name and path, and then click the Save button.
The Save as window is displayed only if you use Google Chrome, Microsoft Edge, or Opera. If you use another browser, the event selection file is automatically saved in the Downloads folder.
Importing an event selection
Open Single Management Platform allows you to import an event selection from a KLO file. The KLO file contains the exported event selection and its settings.
To import an event selection:
- In the main menu, go to Monitoring & reporting → Event selections.
- Click the Import button, and then choose an event selection file that you want to import.
- In the opened window, specify the path to the KLO file, and then click the Open button. Note that you can select only one event selection file.
The event selection processing starts.
The notification with the import results appears. If the event selection is imported successfully, you can click the View import details link to view the event selection properties.
After a successful import, the event selection is displayed in the selection list. The settings of the event selection are also imported.
If the newly imported event selection has a name identical to that of an existing event selection, the name of the imported selection is expanded with the (<next sequence number>) index, for example: (1), (2).
Page topViewing details of an event
To view details of an event:
- Start an event selection.
- Click the time of the required event.
The Event properties window opens.
- In the displayed window, you can do the following:
- View the information about the selected event
- Go to the next event and the previous event in the event selection result
- Go to the device on which the event occurred
- Go to the administration group that includes the device on which the event occurred
- For an event related to a task, go to the task properties
Exporting events to a file
To export events to a file:
- Start an event selection.
- Select the check box next to the required event.
- Click the Export to file button.
The selected event is exported to a file.
Viewing an object history from an event
From an event of creation or modification of an object that supports revision management, you can switch to the revision history of the object.
To view an object history from an event:
- Start an event selection.
- Select the check box next to the required event.
- Click the Revision history button.
The revision history of the object is opened.
Deleting events
To delete one or several events:
- Start an event selection.
- Select the check boxes next to the required events.
- Click the Delete button.
The selected events are deleted and cannot be restored.
Deleting event selections
You can delete only user-defined event selections. Predefined event selections cannot be deleted.
To delete one or several event selections:
- In the main menu, go to Monitoring & reporting → Event selections.
- Select the check boxes next to the event selections that you want to delete.
- Click Delete.
- In the window that opens, click OK.
The event selection is deleted.
Setting the storage term for an event
Open Single Management Platform allows you to receive information about events that occur during the operation of Administration Server and Kaspersky applications installed on managed devices. Information about events is saved in the Administration Server database. You might need to store some events for a longer or shorter period than specified by default values. You can change the default settings of the storage term for an event.
If you are not interested in storing some events in the database of Administration Server, you can disable the appropriate setting in the Administration Server policy and Kaspersky application policy, or in the Administration Server properties (only for Administration Server events). This will reduce the number of event types in the database.
The longer the storage term for an event, the faster the database reaches its maximum capacity. However, a longer storage term for an event lets you perform monitoring and reporting tasks for a longer period.
To set the storage term for an event in the database of Administration Server:
- In the main menu, go to Assets (Devices) → Policies & profiles.
- Do one of the following:
- To configure the storage term of the events of Network Agent or of a managed Kaspersky application, click the name of the corresponding policy.
The policy properties page opens.
- To configure Administration Server events, in the main menu, click the settings icon (
 ) next to the name of the required Administration Server.
 If you have a policy for the Administration Server, you can click the name of this policy instead.
The Administration Server properties page (or the Administration Server policy properties page) opens.
- To configure the storage term of the events of Network Agent or of a managed Kaspersky application, click the name of the corresponding policy.
- Select the Event configuration tab.
A list of event types related to the Critical section is displayed.
- Select the Functional failure, Warning, or Info section.
- In the list of event types in the right pane, click the link for the event whose storage term you want to change.
In the Event registration section of the window that opens, the Store in the Administration Server database for (days) option is enabled.
- In the edit box below this toggle button, enter the number of days to store the event.
- If you do not want to store an event in the Administration Server database, disable the Store in the Administration Server database for (days) option.
If you configure Administration Server events in Administration Server properties window and if event settings are locked in the Kaspersky Security Center Administration Server policy, you cannot redefine the storage term value for an event.
- Click OK.
The properties window of the policy is closed.
From now on, when Administration Server receives and stores the events of the selected type, they will have the changed storage term. Administration Server does not change the storage term of previously received events.
Page topBlocking frequent events
This section provides information about managing frequent events blocking and about removing blocking of frequent events.
About blocking frequent events
A managed application, for example, Kaspersky Endpoint Security for Linux, installed on a single or several managed devices can send a lot of events of the same type to the Administration Server. Receiving frequent events may overload the Administration Server database and overwrite other events. Administration Server starts blocking the most frequent events when the number of all the received events exceeds the specified limit for the database.
Administration Server blocks the frequent events from receiving automatically. You cannot block the frequent events yourself, or choose which events to block.
If you want to find out if an event is blocked, you can view the notification list or you can check if this event is present in the Blocking frequent events section of the Administration Server properties. If the event is blocked, you can do the following:
- If you want to prevent overwriting the database, you can continue blocking such type of events from receiving.
- If you want, for example, to find the reason of sending the frequent events to the Administration Server, you can unblock frequent events and continue receiving the events of this type anyway.
- If you want to continue receiving the frequent events until they become blocked again, you can remove from blocking the frequent events.
Managing frequent events blocking
Administration Server blocks the automatic receiving of frequent events, but you can unblock and continue to receive frequent events. You can also block receiving frequent events that you unblocked before.
To manage frequent events blocking:
- In the main menu, click the settings icon () next to the name of the required Administration Server.
The Administration Server properties window opens.
- On the General tab, select the Blocking frequent events section.
- In the Blocking frequent events section:
- If you want to unblock the receiving of frequent events:
- Select the frequent events you want to unblock, and then click the Exclude button.
- Click the Save button.
- If you want to block receiving frequent events:
- Select the frequent events you want to block, and then click the Block button.
- Click the Save button.
- If you want to unblock the receiving of frequent events:
Administration Server receives the unblocked frequent events and does not receive the blocked frequent events.
Page topRemoving blocking of frequent events
You can remove blocking for frequent events and start receiving them until Administration Server blocks these frequent events again.
To remove blocking for frequent events:
- In the main menu, click the settings icon () next to the name of the required Administration Server.
The Administration Server properties window opens.
- On the General tab, select the Blocking frequent events section.
- In the Blocking frequent events section, select the frequent event types for which you want to remove blocking.
- Click the Remove from blocking button.
The frequent event is removed from the list of frequent events. Administration Server will receive events of this type.
Page topEvent processing and storage on the Administration Server
Information about events during the operation of the application and managed devices is saved in the Administration Server database. Each event is attributed to a certain type and level of severity (Critical event, Functional failure, Warning, or Info). Depending on the conditions under which an event occurred, the application can assign different levels of severity to events of the same type.
You can view types and levels of severity assigned to events in the Event configuration section of the Administration Server properties window. In the Event configuration section, you can also configure processing of every event by the Administration Server:
- Registration of events on the Administration Server and in event logs of the operating system on a device and on the Administration Server.
- Method used for notifying the administrator of an event (for example, an SMS or email message).
In the Events repository section of the Administration Server properties window, you can edit the settings of events storage in the Administration Server database by limiting the number of event records and record storage term. When you specify the maximum number of events, the application calculates an approximate amount of storage space required for the specified number. You can use this approximate calculation to evaluate whether you have enough free space on the disk to avoid database overflow. The default capacity of the Administration Server database is 400,000 events. The maximum recommended capacity of the database is 45 million events.
The application checks the database every 10 minutes. If the number of events reaches the specified maximum value plus 10,000, the application deletes the oldest events so that only the specified maximum number of events remains.
When the Administration Server deletes old events, it cannot save new events to the database. During this period, information about events that were rejected is written to the operating system log. The new events are queued and then saved to the database after the deletion operation is complete. By default, the event queue is limited to 20,000 events. You can customize the queue limit by editing the KLEVP_MAX_POSTPONED_CNT flag value.
Page topNotifications and device statuses
This section contains information on how to view notifications, configure notification delivery, use device statuses, and enable changing device statuses.
Using notifications
Notifications alert you about events and help you to speed up your responses to these events by performing recommended actions or actions you consider as appropriate.
Depending on the notification method chosen, the following types of notifications are available:
- Onscreen notifications
- Notifications by SMS
- Notifications by email
- Notifications by executable file or script
Onscreen notifications
Onscreen notifications alert you to events grouped by importance levels (Critical, Warning, and Informational).
Onscreen notification can have one of two statuses:
- Reviewed. It means you have performed recommended action for the notification, or you have assigned this status for the notification manually.
- Not Reviewed. It means you have not performed recommended action for the notification, or you have not assigned this status for the notification manually.
By default, the list of notifications include notifications in the Not Reviewed status.
You can monitor your organization's network viewing onscreen notifications and responding to them in a real time.
Notifications by email, by SMS, and by executable file or a script
Open Single Management Platform provides the capability to monitor your organization's network by sending notifications about any event that you consider important. For any event, you can configure notifications by email, by SMS, or by running an executable file or a script.
Upon receiving notifications by email or by SMS, you can decide on your response to an event. This response should be the most appropriate for your organization's network. By running an executable file or a script, you predefine a response to an event. You can also consider running an executable file or a script as a primary response to an event. After the executable file runs, you can take other steps to respond to the event.
Page topViewing onscreen notifications
You can view notifications onscreen in three ways:
- In the Monitoring & reporting → Notifications section. Here you can view notifications relating to predefined categories.
- In a separate window that can be opened no matter which section you are using at the moment. In this case, you can mark notifications as reviewed.
- In the Notifications by selected severity level widget on the Monitoring & reporting → Dashboard section. In the widget, you can view only notifications of events that are at the Critical and Warning importance levels.
You can perform actions, for example, you can response to an event.
To view notifications from predefined categories:
- In the main menu, go to Monitoring & reporting → Notifications.
The All notifications category is selected in the left pane, and in the right pane, all the notifications are displayed.
- In the left pane, select one of the categories:
- Deployment
- Devices
- Protection
- Updates (this includes notifications about Kaspersky applications available for download and notifications about anti-virus database updates that have been downloaded)
- Exploit Prevention
- Administration Server (this includes events concerning only Administration Server)
- Useful links (this includes links to Kaspersky resources, for example, Kaspersky Technical Support, Kaspersky forum, license renewal page, or the Kaspersky IT Encyclopedia)
- Kaspersky news (this includes information about releases of Kaspersky applications)
A list of notifications of the selected category is displayed. The list contains the following:
- Icon related to the topic of the notification: deployment (
 ), protection (
 ), updates (
 ), device management (
 ), Exploit Prevention (
 ), Administration Server (
 ).
). - Notification importance level. Notifications of the following importance levels are displayed: Critical notifications (
 ), Warning notifications (
 ), Info notifications. Notifications in the list are grouped by importance levels.
 - Notification. This contains a description of the notification.
- Action. This contains a link to a quick action that we recommend you perform. For example, by clicking this link, you can proceed to the repository and install security applications on devices, or view a list of devices or a list of events. After you perform the recommended action for the notification, this notification is assigned the Reviewed status.
- Status registered. This contains the number of days or hours that have passed from the moment when the notification was registered on the Administration Server.
To view onscreen notifications in a separate window by importance level:
- In the upper-right corner of OSMP Console, click the flag icon (
 ).
).If the flag icon has a red dot, there are notifications that have not been reviewed.
A window opens listing the notifications. By default, the All notifications tab is selected and the notifications are grouped by importance level: Critical, Warning, and Info.
- Select the System tab.
The list of Critical (
) and Warning () importance levels notifications is displayed. The notification list includes the following:- Color marker. Critical notifications are marked in red. Warning notifications are marked in yellow.
- Icon indicating the topic of the notification: deployment (), protection (), updates (), device management (), Exploit Prevention (), Administration Server ().
- Description of the notification.
- Flag icon. The flag icon is gray if notifications have been assigned the Not Reviewed status. When you select the gray flag icon and assign the Reviewed status to a notification, the icon changes color to white.
- Link to the recommended action. When you perform the recommended action after clicking the link, the notification gets the Reviewed status.
- Number of days that have passed since the date when the notification was registered on the Administration Server.
- Select the More tab.
The list of Info importance level notifications is displayed.
The organization of the list is the same as for the list on the System tab (see the description above). The only difference is the absence of a color marker.
You can filter notifications by the date interval when they were registered on Administration Server. Use the Show filter check box to manage the filter.
To view onscreen notifications in the widget:
- In the Dashboard section, select Add or restore web widget.
- In the window that opens, click the Other category, select the Notifications by selected severity level widget, and click Add.
The widget now appears on the Dashboard tab. By default, the notifications of Critical importance level are displayed on the widget.
You can click the Settings button on the widget and change the widget settings to view notifications of the Warning importance level. Or, you can add another widget: Notifications by selected severity level, with a Warning importance level.
The list of notifications on the widget is limited by its size and includes two notifications. These two notifications relate to the latest events.
The notification list in the widget includes the following:
- Icon related to the topic of the notification: deployment (), protection (), updates (), device management (), Exploit Prevention (), Administration Server ().
- Description of the notification with a link to the recommended action. When you perform a recommended action after clicking the link, the notification gets the Reviewed status.
- Number of days or number of hours that have passed since the date when the notification was registered on the Administration Server.
- Link to other notifications. Upon clicking this link, you are transferred to the view of notifications in the Notifications section of the Monitoring & reporting section.
About device statuses
Open Single Management Platform assigns a status to each managed device. The particular status depends on whether the conditions defined by the user are met. In some cases, when assigning a status to a device, Open Single Management Platform takes into consideration the device's visibility flag on the network (see the table below). If Open Single Management Platform does not find a device on the network within two hours, the visibility flag of the device is set to Not Visible.
The statuses are the following:
- Critical or Critical/Visible
- Warning or Warning/Visible
- OK or OK/Visible
The table below lists the default conditions that must be met to assign the Critical or Warning status to a device, with all possible values.
Conditions for assigning a status to a device
Condition |
Condition description |
Available values |
|---|---|---|
Security application is not installed |
Network Agent is installed on the device, but a security application is not installed. |
|
Too many viruses detected |
Some viruses have been found on the device by a task for virus detection, for example, the Malware scan task, and the number of viruses found exceeds the specified value. |
More than 0. |
Real-time protection level differs from the level set by the Administrator |
The device is visible on the network, but the real-time protection level differs from the level set (in the condition) by the administrator for the device status. |
|
Malware scan has not been performed in a long time |
The device is visible on the network and a security application is installed on the device, but neither the Malware scan task nor a local scan task has been run within the specified time interval. The condition is applicable only to devices that were added to the Administration Server database 7 days ago or earlier. |
More than 1 day. |
Databases are outdated |
The device is visible on the network and a security application is installed on the device, but the anti-virus databases have not been updated on this device within the specified time interval. The condition is applicable only to devices that were added to the Administration Server database 1 day ago or earlier. |
More than 1 day. |
Not connected in a long time |
Network Agent is installed on the device, but the device has not connected to an Administration Server within the specified time interval, because the device was turned off. |
More than 1 day. |
Active threats are detected |
The number of unprocessed objects in the Active threats folder exceeds the specified value. |
More than 0 items. |
Restart is required |
The device is visible on the network, but an application requires the device restart longer than the specified time interval and for one of the selected reasons. |
More than 0 minutes. |
Incompatible applications are installed |
The device is visible on the network, but software inventory performed through Network Agent has detected incompatible applications installed on the device. |
|
License expired |
The device is visible on the network, but the license has expired. |
|
License expires soon |
The device is visible on the network, but the license will expire on the device in less than the specified number of days. |
More than 0 days. |
Invalid encryption status |
Network Agent is installed on the device, but the device encryption result is equal to the specified value. |
|
Unprocessed security issues detected |
Some unprocessed security issues have been found on the device. Security issues can be created either automatically, through managed Kaspersky applications installed on the client device, or manually by the administrator. |
|
Device status defined by application |
The status of the device is defined by the managed application. |
|
Device is out of disk space |
Free disk space on the device is less than the specified value or the device could not be synchronized with the Administration Server. The Critical or Warning status is changed to the OK status when the device is successfully synchronized with the Administration Server and free space on the device is greater than or equal to the specified value. |
More than 0 MB. |
Device has become unmanaged |
During device discovery, the device was recognized as visible on the network, but more than three attempts to synchronize with the Administration Server failed. |
|
Protection is disabled |
The device is visible on the network, but the security application on the device has been disabled for longer than the specified time interval. In this case, the state of the security application is stopped or failure, and differs from the following: starting, running, or suspended. |
More than 0 minutes. |
Security application is not running |
The device is visible on the network and a security application is installed on the device but is not running. |
|
Open Single Management Platform allows you to set up automatic switching of the status of a device in an administration group when specified conditions are met. When the specified conditions are met, the client device is assigned one of the following statuses: Critical or Warning. When the specified conditions are not met, the client device is assigned the OK status.
Different statuses may correspond to different values of one condition. For example, by default, if the Databases are outdated condition has the More than 3 days value, the client device is assigned the Warning status; if the value is More than 7 days, the Critical status is assigned.
If you upgrade Open Single Management Platform from the previous version, the values of the Databases are outdated condition for assigning the status to Critical or Warning do not change.
When Open Single Management Platform assigns a status to a device, for some conditions (see the Condition description column) the visibility flag is taken into consideration. For example, if a managed device was assigned the Critical status because the Databases are outdated condition was met, and later the visibility flag was set for the device, then the device is assigned the OK status.
Configuring the switching of device statuses
You can change conditions to assign the Critical or Warning status to a device.
To enable changing the device status to Critical:
- In the main menu, go to Assets (Devices) → Hierarchy of groups.
- In the list of groups that opens, click the link with the name of a group for which you want to change switching the device statuses.
- In the properties window that opens, select the Device status tab.
- In the left pane, select Critical.
- In the right pane, in the Set to Critical if these are specified section, enable the condition to switch a device to the Critical status.
You can change only settings that are not locked in the parent policy.
- Select the radio button next to the condition in the list.
- In the upper-left corner of the list, click the Edit button.
- Set the required value for the selected condition.
Values cannot be set for every condition.
- Click OK.
When specified conditions are met, the managed device is assigned the Critical status.
To enable changing the device status to Warning:
- In the main menu, go to Assets (Devices) → Hierarchy of groups.
- In the list of groups that opens, click the link with the name of a group for which you want to change switching the device statuses.
- In the properties window that opens, select the Device status tab.
- In the left pane, select Warning.
- In the right pane, in the Set to Warning if these are specified section, enable the condition to switch a device to the Warning status.
You can change only settings that are not locked in the parent policy.
- Select the radio button next to the condition in the list.
- In the upper-left corner of the list, click the Edit button.
- Set the required value for the selected condition.
Values cannot be set for every condition.
- Click OK.
When specified conditions are met, the managed device is assigned the Warning status.
Configuring notification delivery
You can configure notification about events occurring in Open Single Management Platform. Depending on the notification method chosen, the following types of notifications are available:
- Email—When an event occurs, Open Single Management Platform sends a notification to the email addresses specified.
- SMS—When an event occurs, Open Single Management Platform sends a notification to the phone numbers specified.
- Executable file—When an event occurs, the executable file is run on the Administration Server.
To configure notification delivery of events occurring in Open Single Management Platform:
- In the main menu, click the settings icon () next to the name of the required Administration Server.
The Administration Server properties window opens with the General tab selected.
- Click the Notification section, and in the right pane select the tab for the notification method you want:
- On the tab, define the notification settings.
- Click the OK button to close the Administration Server properties window.
The saved notification delivery settings are applied to all events that occur in Open Single Management Platform.
You can override notification delivery settings for certain events in the Event configuration section of the Administration Server settings, of a policy's settings, or of an application's settings.
Testing notifications
To check whether event notifications are sent, the application uses the notification of the EICAR test virus detection on client devices.
To verify sending of event notifications:
- Stop the real-time file system protection task on a client device and copy the EICAR test virus to that client device. Then, re-enable real-time protection of the file system.
- Run a scan task for client devices in an administration group or for specific devices, including one with the EICAR test virus.
If the scan task is configured correctly, the test virus will be detected. If notifications are configured correctly, you are notified that a virus has been detected.
To open a record of the test virus detection:
- In the main menu, go to Monitoring & reporting → Event selections.
- Click the Recent events selection name.
In the window that opens, the notification about the test virus is displayed.
The EICAR test virus contains no code that can do harm to your device. However, most manufacturers' security applications identify this file as a virus. You can download the test virus from the official EICAR website.
Page topEvent notifications displayed by running an executable file
Open Single Management Platform can notify the administrator about events on client devices by running an executable file. The executable file must contain another executable file with placeholders of the event to be relayed to the administrator (see the table below).
Placeholders for describing an event
Placeholder |
Placeholder description |
|---|---|
%SEVERITY% |
Event severity. Possible values:
|
%COMPUTER% |
Name of the device where the event occurred. Maximum length of the device name is 256 characters. |
%DOMAIN% |
Domain name of the device where the event occurred. |
%EVENT% |
Name of the event type. Maximum length of the event type name is 50 characters. |
%DESCR% |
Event description. Maximum length of the description is 1000 characters. |
%RISE_TIME% |
Event creation time. |
%KLCSAK_EVENT_TASK_DISPLAY_NAME% |
Task name. Maximum length of the task name is 100 characters. |
%KL_PRODUCT% |
Product name. |
%KL_VERSION% |
Product version number. |
%KLCSAK_EVENT_SEVERITY_NUM% |
Event severity number. Possible values:
|
%HOST_IP% |
IP address of the device where the event occurred. |
%HOST_CONN_IP% |
Connection IP address of the device where the event occurred. |
Example: Event notifications are sent by an executable file (such as script1.bat) inside which another executable file (such as script2.bat) with the %COMPUTER% placeholder is launched. When an event occurs, the script1.bat file is run on the administrator's device, which, in turn, runs the script2.bat file with the %COMPUTER% placeholder. The administrator then receives the name of the device where the event occurred. |
Kaspersky announcements
This section describes how to use, configure, and disable Kaspersky announcements.
About Kaspersky announcements
The Kaspersky announcements section (Monitoring & reporting → Kaspersky announcements) keeps you informed by providing information related to your version of Open Single Management Platform and the managed applications installed on the managed devices. Open Single Management Platform periodically updates the information in the section by removing outdated announcements and adding new information.
Open Single Management Platform shows only those Kaspersky announcements that relate to the currently connected Administration Server and the Kaspersky applications installed on the managed devices of this Administration Server. The announcements are shown individually for any type of Administration Server—primary, secondary, or virtual.
Administration Server must have an internet connection to receive Kaspersky announcements.
The announcements include information of the following types:
- Security-related announcements
Security-related announcements are intended to keep the Kaspersky applications installed in your network up-to-date and fully functional. The announcements may include information about critical updates for Kaspersky applications, fixes for found vulnerabilities, and ways to fix other issues in Kaspersky applications. By default, security-related announcements are enabled. If you do not want to receive the announcements, you can disable this feature.
To show you the information that corresponds to your network protection configuration, Open Single Management Platform sends data to Kaspersky cloud servers and receives only those announcements that relate to the Kaspersky applications installed in your network. The data set that can be sent to the servers is described in the End User License Agreement that you accept when you install Kaspersky Security Center Administration Server.
- Marketing announcements
Marketing announcements include information about special offers for your Kaspersky applications, advertisements, and news from Kaspersky. Marketing announcements are disabled by default. You receive this type of announcements only if you enabled Kaspersky Security Network (KSN). You can disable marketing announcements by disabling KSN.
To show you only relevant information that might be helpful in protecting your network devices and in your everyday tasks, Open Single Management Platform sends data to Kaspersky cloud servers and receives the appropriate announcements. The data set that can be sent to the servers is described in the Processed Data section of the KSN Statement.
New information is divided into the following categories, according to importance:
- Critical info
- Important news
- Warning
- Info
When new information appears in the Kaspersky announcements section, OSMP Console displays a notification label that corresponds to the importance level of the announcements. You can click the label to view this announcement in the Kaspersky announcements section.
You can specify the Kaspersky announcements settings, including the announcement categories that you want to view and where to display the notification label. If you do not want to receive announcements, you can disable this feature.
Page topSpecifying Kaspersky announcements settings
In the Kaspersky announcements section, you can specify the Kaspersky announcements settings, including the categories of the announcements that you want to view and where to display the notification label.
To configure Kaspersky announcements:
- In the main menu, go to Monitoring & reporting → Kaspersky announcements.
- Click the Settings link.
The Kaspersky announcement settings window opens.
- Specify the following settings:
- Select the importance level of the announcements that you want to view. The announcements of other categories will not be displayed.
- Select where you want to see the notification label. The label can be displayed in all console sections, or in the Monitoring & reporting section and its subsections.
- Click the OK button.
The Kaspersky announcement settings are specified.
Disabling Kaspersky announcements
The Kaspersky announcements section (Monitoring & reporting → Kaspersky announcements) keeps you informed by providing information related to your version of Open Single Management Platform and managed applications installed on the managed devices. If you do not want to receive Kaspersky announcements, you can disable this feature.
The Kaspersky announcements include two types of information: security-related announcements and marketing announcements. You can disable the announcements of each type separately.
To disable security-related announcements:
- In the main menu, click the settings icon () next to the name of the required Administration Server.
The Administration Server properties window opens.
- On the General tab, select the Kaspersky announcements section.
- Switch the toggle button to the Security-related announcements are disabled position.
- Click the Save button.
Kaspersky announcements are disabled.
Marketing announcements are disabled by default. You receive marketing announcements only if you enabled Kaspersky Security Network (KSN). You can disable this type of announcement by disabling KSN.
To disable marketing announcements:
- In the main menu, click the settings icon () next to the name of the required Administration Server.
The Administration Server properties window opens.
- On the General tab, select the KSN Proxy settings section.
- Disable the Use Kaspersky Security Network Enabled option.
- Click the Save button.
Marketing announcements are disabled.
Exporting events to SIEM systems
This section describes how to configure export of events to the SIEM systems.
Scenario: Configuring event export to SIEM systems
Open Single Management Platform allows configuring event export to SIEM systems by one of the following methods: export to any SIEM system that uses Syslog format or export of events to SIEM systems directly from the Kaspersky Security Center database. When you complete this scenario, Administration Server sends events to a SIEM system automatically.
Prerequisites
Before you start configuration export of events in the Open Single Management Platform:
- Learn more about the methods of event export.
- Make sure that you have the values of system settings.
You can perform the steps of this scenario in any order.
The process of export of events to a SIEM system consists of the following steps:
- Configuring the SIEM system to receive events from Open Single Management Platform
How-to instructions: Configuring event export in a SIEM system
- Selecting the events that you want to export to the SIEM system
Mark which events you want to export to the SIEM system. First, mark the general events that occur in all managed Kaspersky applications. Then, you can mark the events for specific managed Kaspersky applications.
- Configuring export of events to the SIEM system
You can export events by using one of the following methods:
- Using TCP/IP, UDP or TLS over TCP protocols
- Using export of events directly from the Kaspersky Security Center database (a set of public views is provided in the Kaspersky Security Center database; you can find the description of these public views in the klakdb.chm document)
Results
After configuring export of events to a SIEM system you can view export results if you selected events which you want to export.
Before you begin
When setting up automatic export of events in the Open Single Management Platform, you must specify some of the SIEM system settings. It is recommended that you check these settings in advance in order to prepare for setting up Open Single Management Platform.
To successfully configure automatic sending of events to a SIEM system, you must know the following settings:
About event export
Open Single Management Platform allows you to receive information about events that occur during the operation of Administration Server and Kaspersky applications installed on managed devices. Information about events is saved in the Administration Server database.
You can use event export within centralized systems that deal with security issues on an organizational and technical level, provide security monitoring services, and consolidate information from different solutions. These are SIEM systems, which provide real-time analysis of security alerts and events generated by network hardware and applications, or Security Operation Centers (SOCs).
These systems receive data from many sources, including networks, security, servers, databases, and applications. SIEM systems also provide functionality to consolidate monitored data in order to help you avoid missing critical events. In addition, the systems perform automated analysis of correlated events and alerts in order to notify the administrators of immediate security issues. Alerting can be implemented through a dashboard or can be sent through third-party channels such as email.
The process of exporting events from Open Single Management Platform to external SIEM systems involves two parties: an event sender, Open Single Management Platform, and an event receiver, a SIEM system. To successfully export events, you must configure this in your SIEM system and in the Open Single Management Platform. It does not matter which side you configure first. You can either configure the transmission of events in the Open Single Management Platform, and then configure the receipt of events by the SIEM system, or vice versa.
Syslog format of event export
You can send events in the Syslog format to any SIEM system. Using the Syslog format, you can relay any events that occur on the Administration Server and in Kaspersky applications that are installed on managed devices. When exporting events in the Syslog format, you can select exactly which types of events will be relayed to the SIEM system.
Receipt of events by the SIEM system
The SIEM system must receive and correctly parse the events received from Open Single Management Platform. For these purposes, you must properly configure the SIEM system. The configuration depends on the specific SIEM system utilized. However, there are a number of general steps in the configuration of all SIEM systems, such as configuring the receiver and the parser.
Page topAbout configuring event export in a SIEM system
The process of exporting events from Open Single Management Platform to external SIEM systems involves two parties: an event sender—Open Single Management Platform and an event receiver—SIEM system. You must configure the export of events in your SIEM system and in the Open Single Management Platform.
The settings that you specify in the SIEM system depend on the particular system that you are using. Generally, for all SIEM systems you must set up a receiver and, optionally, a message parser to parse received events.
Setting up the receiver
To receive events sent by Open Single Management Platform, you must set up the receiver in your SIEM system. In general, the following settings must be specified in the SIEM system:
- Export protocol
A message transfer protocol, either UDP, TCP, or TLS, over TCP. This protocol must be the same as the protocol you specified in Open Single Management Platform.
- Port
Specify the port number to connect to Open Single Management Platform. This port must be the same as the port you specify in Open Single Management Platform during configuration with a SIEM system.
- Data format
Specify the Syslog format.
Depending on the SIEM system that you use, you may have to specify some additional receiver settings.
The figure below shows the receiver setup screen in ArcSight.
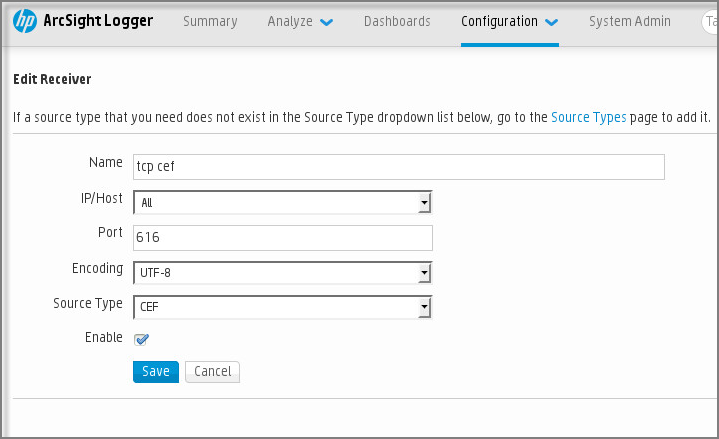
Receiver setup in ArcSight
Message parser
Exported events are passed to SIEM systems as messages. These messages must be properly parsed so that information on the events can be used by the SIEM system. Message parsers are part of the SIEM system; they are used to split the contents of the message into the relevant fields, such as event ID, severity, description, parameters. This enables the SIEM system to process events received from Open Single Management Platform so that they can be stored in the SIEM system database.
Marking of events for export to SIEM systems in Syslog format
After enabling automatic export of events, you must select which events will be exported to the external SIEM system.
You can configure export of events in the Syslog format to an external system based on one of the following conditions:
- Marking general events. If you mark events to export in a policy, in the settings of an event, or in the Administration Server settings, the SIEM system will receive the marked events that occurred in all applications managed by the specific policy. If exported events were selected in the policy, you will not be able to redefine them for an individual application managed by this policy.
- Marking events for a managed application. If you mark events to export for a managed application installed on a managed device, the SIEM system will receive only the events that occurred in this application.
Marking events of a Kaspersky application for export in the Syslog format
If you want to export events that occurred in a specific managed application installed on the managed devices, mark the events for export in the application policy. In this case, the marked events are exported from all of the devices included in the policy scope.
To mark events for export for a specific managed application:
- In the main menu, go to Assets (Devices) → Policies & profiles.
- Click the policy of the application for which you want to mark events.
The policy settings window opens.
- Go to the Event configuration section.
- Select the check boxes next to the events that you want to export to a SIEM system.
- Click the Mark for export to SIEM system by using Syslog button.
You can also mark an event for export to a SIEM system in the Event registration section, which opens by clicking the link of the event.
- A check mark (
 ) appears in the Syslog column of the event or events that you marked for export to the SIEM system.
 - Click the Save button.
The marked events from the managed application are ready to be exported to a SIEM system.
You can mark which events to export to a SIEM system for a specific managed device. If previously exported events were marked in an application policy, you will not be able to redefine the marked events for a managed device.
To mark events for export for a managed device:
- In the main menu, go to Assets (Devices) → Managed devices.
The list of managed devices is displayed.
- Click the link with the name of the required device in the list of managed devices.
The properties window of the selected device is displayed.
- Go to the Applications section.
- Click the link with the name of the required application in the list of applications.
- Go to the Event configuration section.
- Select the check boxes next to the events that you want to export to SIEM.
- Click the Mark for export to SIEM system by using Syslog button.
Also, you can mark an event for export to a SIEM system in the Event registration section, that opens by clicking the link of the event.
- A check mark () appears in the Syslog column of the event or events that you marked for export to the SIEM system.
From now on, Administration Server sends the marked events to the SIEM system if export to the SIEM system is configured.
Marking general events for export in Syslog format
You can mark general events that Administration Server will export to SIEM systems by using the Syslog format.
To mark general events for export to a SIEM system:
- Do one of the following:
- In the main menu, click the settings icon () next to the name of the required Administration Server.
- In the main menu, go to Assets (Devices) → Policies & profiles, and then click a link of a policy.
- In the main menu, click the settings icon (
- In the window that opens, go to the Event configuration tab.
- Click Mark for export to SIEM system by using Syslog.
Also, you can mark an event for export to SIEM system in the Event registration section, that opens by clicking the link of the event.
- A check mark () appears in the Syslog column of the event or events that you marked for export to the SIEM system.
From now on, Administration Server sends the marked events to the SIEM system if export to the SIEM system is configured.
About exporting events using Syslog format
You can use the Syslog format to export to SIEM systems the events that occur in Administration Server and other Kaspersky applications installed on managed devices.
Syslog is a standard for message logging protocol. It permits separation of the software that generates messages, the system that stores them, and the software that reports and analyzes them. Each message is labeled with a facility code, indicating the software type that generates the message, and is assigned a severity level.
The Syslog format is defined by Request for Comments (RFC) documents published by the Internet Engineering Task Force (internet standards). The RFC 5424 standard is used to export the events from Open Single Management Platform to external systems.
In Open Single Management Platform, you can configure export of the events to the external systems using the Syslog format.
The export process consists of two steps:
- Enabling automatic event export. At this step, Open Single Management Platform is configured so that it sends events to the SIEM system. Open Single Management Platform starts sending events immediately after you enable automatic export.
- Selecting the events to be exported to the external system. At this step, you select which event to export to the SIEM system.
Configuring Open Single Management Platform for export of events to a SIEM system
To export events to a SIEM system, you have to configure the process of export in Open Single Management Platform.
To configure export to SIEM systems in the OSMP Console:
- In the main menu, click the settings icon () next to the name of the required Administration Server.
The Administration Server properties window opens.
- On the General tab, select the SIEM section.
- Click the Settings link.
The Export settings section opens.
- Specify the settings in the Export settings section:
- If you want, you can export archived events from the Administration Server database and set the start date from which you want to start the export of archived events:
- Click the Set the export start date link.
- In the section that opens, specify the start date in the Date to start export from field.
- Click the OK button.
- Switch the option to the Automatically export events to SIEM system database Enabled position.
- Click the Save button.
Export to a SIEM system is configured. From now on, if you configured the receiving of events in a SIEM system, Administration Server exports the marked events to a SIEM system. If you set the start date of export, Administration Server also exports the marked events stored in the Administration Server database from the specified date.
Exporting events directly from the database
You can retrieve events directly from the Open Single Management Platform database without having to use the Open Single Management Platform interface. You can either query the public views directly and retrieve the event data, or create your own views on the basis of existing public views and address them to get the data you need.
Public views
For your convenience, a set of public views is provided in the Open Single Management Platform database. You can find the description of these public views in the klakdb.chm document.
The v_akpub_ev_event public view contains a set of fields that represent the event parameters in the database. In the klakdb.chm document you can also find information on public views corresponding to other Open Single Management Platform entities, for example, devices, applications, or users. You can use this information in your queries.
This section contains instructions for creating an SQL query by means of the klsql2 utility and a query example.
To create SQL queries or database views, you can also use any other program for working with databases. Information on how to view the parameters for connecting to the Open Single Management Platform database, such as instance name and database name, is given in the corresponding section.
Creating an SQL query using the klsql2 utility
This article describes how to use the klsql2 utility, and create an SQL query by using this utility. Use klsql2 utility version that is included in your Open Single Management Platform version installed.
To use the klsql2 utility:
- Go to the directory where Kaspersky Next XDR Expert Administration Server is installed. The default installation path is /opt/kaspersky/ksc64/sbin.
- In this directory, create src.sql blank file.
- Open the src.sql file in any text editor.
- In the src.sql file, type the SQL query that you want, and then save the file.
- On the device with Kaspersky Security Center Administration Server installed, in the command line, type the following command to run the SQL query from the src.sql file and save the results to the result.xml file:
sudo ./klsql2 -i src.sql -u <username> -p <password> -o result.xmlwhere
<username>and<password>are credentials of the user account that has access to the database. - If required, enter the login and password of the user account that has access to the database.
- Open the newly created result.xml file to view the query results.
You can edit the src.sql file and create any query to the public views. Then, from the command line, execute your query and save the results to a file.
Example of an SQL query in the klsql2 utility
This section shows an example of an SQL query, created by means of the klsql2 utility.
The following example illustrates retrieval of the events that occurred on devices during the last seven days, and display of the events ordered by the time they occur, the most recent events are displayed first.
Example: SELECT e.nId, /* event identifier */ e.tmRiseTime, /* time, when the event occurred */ e.strEventType, /* internal name of the event type */ e.wstrEventTypeDisplayName, /* displayed name of the event */ e.wstrDescription, /* displayed description of the event */ e.wstrGroupName, /* name of the group, where the device is located */ h.wstrDisplayName, /* displayed name of the device, on which the event occurred */ CAST(((h.nIp / 16777216) & 255) AS varchar(4)) + '.' + CAST(((h.nIp / 65536) & 255) AS varchar(4)) + '.' + CAST(((h.nIp / 256) & 255) AS varchar(4)) + '.' + CAST(((h.nIp) & 255) AS varchar(4)) as strIp /* IP-address of the device, on which the event occurred */ FROM v_akpub_ev_event e INNER JOIN v_akpub_host h ON h.nId=e.nHostId WHERE e.tmRiseTime>=DATEADD(Day, -7, GETUTCDATE()) ORDER BY e.tmRiseTime DESC |
Viewing the Open Single Management Platform database name
If you want to access Open Single Management Platform database by means of the MySQL, or MariaDB database management tools, you must know the name of the database in order to connect to it from your SQL script editor.
To view the name of the Open Single Management Platform database:
- In the main menu, click the settings icon () next to the name of the required Administration Server.
The Administration Server properties window opens.
- On the General tab, select the Details of current database section.
The database name is specified in the Database name field. Use the database name to address the database in your SQL queries.
Viewing export results
You can control for successful completion of the event export procedure. To do this, check whether messages with export events are received by your SIEM system.
If the events sent from Open Single Management Platform are received and properly parsed by your SIEM system, configuration on both sides is done properly. Otherwise, check the settings you specified in Open Single Management Platform against the configuration in your SIEM system.
The figure below shows the events exported to ArcSight. For example, the first event is a critical Administration Server event: "Device status is Critical".
The representation of export events in the SIEM system varies according to the SIEM system you use.
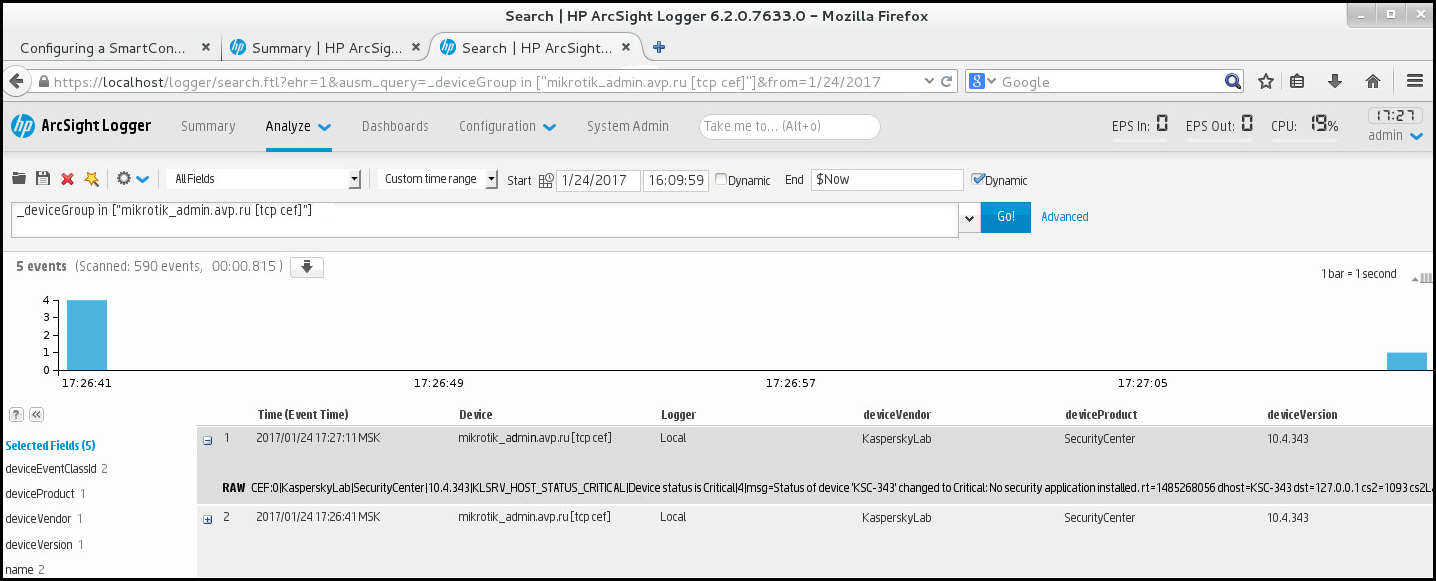
Example of events
Managing object revisions
This section contains information about object revision management. Open Single Management Platform allows you to track object modification. Every time you save changes made to an object, a revision is created. Each revision has a number.
Application objects that support revision management include:
- Administration Server properties
- Policies
- Tasks
- Administration groups
- User accounts
- Installation packages
You can view the revision list and roll back changes made to an object to a selected revision.
In the properties window of any object that supports revision management, the Revision history section displays a list of object revisions with the following details:
- Revision—Object revision number.
- Time—Date and time the object was modified.
- User—Name of the user who modified the object.
- Action—Action performed on the object.
- Description—Description of the revision related to the change made to the object settings.
By default, the object revision description is blank. To add a description to a revision, select the relevant revision and click the Edit description button. In the opened window, enter some text for the revision description.
Rolling back an object to a previous revision
You can roll back changes made to an object, if necessary. For example, you may have to revert the settings of a policy to their state on a specific date.
To roll back changes made to an object:
- In the object's properties window, open the Revision history tab.
- In the list of object revisions, select the revision that you want to roll back changes for.
- Click the Roll back button.
- Click OK to confirm the operation.
The object is now rolled back to the selected revision. The list of object revisions displays a record of the action that was taken. The revision description displays information about the number of the revision to which you reverted the object.
Rolling back operation is available only for policy and task objects.
Deletion of objects
This section provides information about deleting objects and viewing information about objects after they are deleted.
You can delete objects, including the following:
- Policies
- Tasks
- Installation packages
- Virtual Administration Servers
- Users
- Security groups
- Administration groups
When you delete an object, information about it remains in the database. The storage term for information about the deleted objects is the same as the storage term for object revisions (the recommended term is 90 days). You can change the storage term only if you have the Modify permission in the Deleted objects area of rights.
About deletion of client devices
When you delete a managed device from an administration group, the application moves the device to the Unassigned devices group. After device deletion, the installed Kaspersky applications—Network Agent and any security application, for example Kaspersky Endpoint Security—remain on the device.
Kaspersky Next XDR Expert handles the devices in the Unassigned devices group according to the following rules:
- If you have configured device moving rules and a device meets the criteria of a moving rule, the device is automatically moved to an administration group according to the rule.
- The device is stored in the Unassigned devices group and automatically removed from the group according to the device retention rules.
The device retention rules do not affect the devices that have one or more drives encrypted with full disk encryption. Such devices are not deleted automatically—you can only delete them manually. If you need to delete a device with an encrypted drive, first decrypt the drive, and then delete the device.
When you delete a device with encrypted drive, the data required to decrypt the drive is also deleted. If you select the I understand the risk and want to delete the selected device(s) check box in the confirmation window that opens when you delete such devices (either from the Unassigned devices or the Managed Devices group), it means that you are aware of the subsequent data deletion.
To decrypt the drive, the following conditions must be met:
- The device is reconnected to Administration Server to restore the data required to decrypt the drive.
- The device user remembers the decryption password.
- The security application that was used to encrypt the drive, for example Kaspersky Endpoint Security for Windows, is still installed on the device.
If the drive was encrypted by Kaspersky Disk Encryption technology, you can also try recovering data by using the FDERT Restore Utility.
When you delete a device from the Unassigned devices group manually, the application removes the device from the list. After device deletion, the installed Kaspersky applications (if any) remain on the device. Then, if the device is still visible to Administration Server and you have configured regular network polling, Kaspersky Next XDR Expert discovers the device during the network polling and adds it back to the Unassigned devices group. Therefore, it is reasonable to delete a device manually only if the device is invisible to Administration Server.
Page topDownloading and deleting files from Quarantine and Backup
This section gives information on how to download and how to delete files from Quarantine and Backup in OSMP Console.
Downloading files from Quarantine and Backup
You can download files from Quarantine and Backup only if one of the two conditions is met: either the Do not disconnect from the Administration Server option is enabled in the settings of the device, or a connection gateway is in use. Otherwise, the downloading is not possible.
To save a copy of file from Quarantine or Backup to a hard drive:
- Do one of the following:
- If you want to save a copy of file from Quarantine, in the main menu, go to Operations → Repositories → Quarantine.
- If you want to save a copy of file from Backup, in the main menu, go to Operations → Repositories → Backup.
- In the window that opens, select a file that you want to download and click Download.
The download starts. A copy of the file that had been placed in Quarantine on the client device is saved to the specified folder.
Page topAbout removing objects from the Quarantine, Backup, or Active threats repositories
When Kaspersky security applications installed on client devices place objects to the Quarantine, Backup, or Active threats repositories, they send the information about the added objects to the Quarantine, Backup, or Active threats sections in Open Single Management Platform. When you open one of these sections, select an object from the list and click the Remove button, Open Single Management Platform performs one of the following actions or both actions:
- Removes the selected object from the list
- Deletes the selected object from the repository
The action to perform is defined by the Kaspersky application that placed the selected object to the repository. The Kaspersky application is specified in the Entry added by field. Refer to the documentation of the Kaspersky application for details about which action is to be performed.
Page topOperation diagnostics of the Kaspersky Next XDR Expert components
This section describes how to obtain diagnostic information about Kaspersky Next XDR Expert components.
Obtaining diagnostic information about Kaspersky Next XDR Expert components
KDT allows you to obtain diagnostic information about Kaspersky Next XDR Expert components and the Kubernetes cluster, to troubleshoot problems on your own or with the help of Kaspersky Technical Support.
To obtain diagnostic information about the Kaspersky Next XDR Expert components and management web plug-ins,
On the administrator host where the KDT utility is located, run the following command:
./kdt logs get <flags>
Where <flags> are the parameters of the command that allows you to configure the logging result.
You can specify the following logging parameters:
--app <list_of_components>—Obtain diagnostic information for the listed Kaspersky Next XDR Expert components.--auto-dest-dir—Obtain logs and save them to the kdt-default-logs-<current_date_and_time> directory that is automatically created in the current directory. If the logging period is not specified, you obtain diagnostic information for the last hour.For example, if you want to obtain logs for the last hour for Administration Server and KUMA, and then save these logs to the automatically created directory, run the following command:
./kdt logs get --app ksc,kuma --auto-dest-dir-d, --destination <file_path>—Obtain logs and save them to the specified file.-D,--destination-dir <directory_path>—Obtain logs and save them to the specified directory that must be created beforehand. If the<directory_path>is empty, logs are saved in the standard output stream (stdout). If the logging period is not specified, you obtain diagnostic information for the last hour.--to-archive—Obtain logs and save them to the kdt-default-logs-<current_date_and_time>.tar.gz archive. The created archive is saved to the current directory. If the logging period is not specified, you obtain diagnostic information for the last hour.--last=<hours>h—Obtain logs for the specified number of hours up to date.For example, if you want to get an archive with logs for the last three hours, run the following command:
./kdt logs get --to-archive --last=3h--start=<date_and_time>—Obtain logs starting from the specified date and time (in the Unix timestamp format) to the present time, or to the date and time specified in the--endparameter.For example, if you want to obtain logs starting from 03/26/2024 10:00:00 to the present time, and then save them to the kdt-default-logs-<current_date_and_time> directory created in the current directory, run the following command:
./kdt logs get --auto-dest-dir --start=1711447200--end=<date_and_time>—Obtain logs starting from the date and time specified in the--startparameter to the date and time specified in the--endparameter (in the Unix timestamp format). If the--startparameter in not specified, logs are obtained for the last hour before the date and time specified by the--endparameter.For example, if you want to save logs for the 10 minutes (from 03/26/2024 10:00:00 to 03/26/2024 10:10:00) to the logs directory, run the following command:
./kdt logs get -D ./logs/ start=1711447200 --end=1711447800
To view the available flags, you can run one of the following commands:
./kdt logs get -h./kdt logs get --help
Viewing OSMP metrics
OSMP allows you to monitor metrics for further analysis of the operability and performance of its components.
You can view OSMP metrics in one of the following ways:
- By using the
monitoring.<smp_domain>URL.In this case, you have to view the metrics via Grafana, a tool for data visualization which is installed with Kaspersky Next XDR Expert. The
<smp_domain>is a parameter that you set in the configuration file when deploying Kaspersky Next XDR Expert. - By using your tools.
In this case, you have to configure your tools to obtain the metrics from the api.<smp_domain>/metrics API address.
Kaspersky Next XDR Expert provides its metrics in OpenMetrics format.
If you want to view information about the performance of the KUMA Core, storage, collectors, and correlators, you have to view KUMA metrics.
Page topStoring diagnostic information about Kaspersky Next XDR Expert components
Diagnostic information about Kaspersky Next XDR Expert components is stored on a worker node of the Kubernetes cluster. The amount of disk space required for storing this information is specified in the configuration file before the deployment of Kaspersky Next XDR Expert (the loki_size parameter).
To check the disk space used to store diagnostic information about Kaspersky Next XDR Expert components,
On the administrator host where the KDT utility is located, run the following command:
./kdt invoke observability --action getPvSize
The amount of the allocated free disk space in gigabytes is displayed.
You can also increase the disk space used to store diagnostic information about Kaspersky Next XDR Expert components after the deployment of Kaspersky Next XDR Expert. You cannot set the amount of disk space to less than the previously specified amount.
To increase the disk space used to store diagnostic information about Kaspersky Next XDR Expert components,
On the administrator host where the KDT utility is located, run the following command and specify the required free disk space in gigabytes (for example, "50Gi"):
./kdt invoke observability --action setPvSize --param loki_size="<new_disk_space_amount>Gi"
The amount of free disk space allocated to store diagnostic information about Kaspersky Next XDR Expert components is changed.
Page topObtaining trace files
KDT allows you to obtain trace files for Kaspersky Next XDR Expert and OSMP components, to troubleshoot infrastructure on your own or with the help of Kaspersky Technical Support.
Trace files are downloaded in OpenTelemetry format.
To obtain the trace file for the Kaspersky Next XDR Expert or OSMP component:
- On the administrator host where the KDT utility is located, run the following command and specify the path to the file where you want to save the list of trace files:
./kdt traces find -o <output_file_path>The list of trace files with their IDs is output to the specified file.
- To output a particular trace file run the following command and specify the output file path and the trace file ID:
./kdt traces get -o <output_file_path> --traсe-id=<trace_ID>
The specified trace file is saved.
Page topLogging the launches of custom actions
KDT allows you to obtain the history of the custom action launches for a specific Kaspersky Next XDR Expert component, as well as the logs of a particular custom action launch. The obtained logs may help you to investigate problems with the operation of the Kaspersky Next XDR Expert components on your own or with the help of Kaspersky Technical Support.
To obtain the history of the custom action launches for a specific Kaspersky Next XDR Expert component,
On the administrator host where the KDT utility is located, run the following command, and then specify the component name:
./kdt state -H <component_name>
The list of executed custom actions with their IDs is displayed.
To obtain logs of the custom action launch,
On the administrator host where the KDT utility is located, run the following command, and then specify the component name and the ID of the custom action launch:
./kdt state -l <component_name> -m <custom_action_launch_ID>
The logs of the specified custom action launch are displayed.
Page top