Contents
- Kaspersky Container Security 2.0 Help
- About the Kaspersky Container Security platform
- Solution architecture
- Standard deployment schemes
- Preparing to install the solution
- Solution installation
- Installing the basic business logic module and scanner
- First launch of the Management Console
- Viewing and accepting the End User License Agreement
- Checking solution functionality
- Agent deployment
- Viewing and editing agent groups
- Configuring a proxy server
- Connecting to external data storage resources
- Installing private fixes
- Removing the solution
- Updating the solution
- Solution interface
- Licensing the solution
- Data provisioning
- Working with clusters
- View the list of clusters
- Namespaces in the cluster
- Pods in the cluster
- Visualization of cluster resources
- Working with images from registers
- Investigating security events
- Analyzing container forensics
- Searching container forensics
- Detailed information about a running process
- Detailed information about file operations
- Details information about network traffic
- Detailed information about detected malicious objects
- Restrictions on runtime policies
- Investigating container forensics while accounting for adjacent events
- Analyzing detected vulnerabilities
- Analyzing container forensics
- Integration with third-party resources
- Setting up integration with external image registries
- Minimum sufficient rights for integration with registries
- Working with public registries without authorization
- Adding integrations with external image registries
- Viewing information about integrations with registries
- Deleting integration with external registry
- Harbor integration
- Creating an integration upon Harbor request
- Viewing and editing the Harbor External Integration settings
- Rescanning
- Integration with CI/CD
- Artifact scanning in CI/CD processes
- Configuring integration with GitLab CI/CD
- Configuring integration with Jenkins CI/CD
- Configuring integration with TeamCity CI/CD
- Defining the path to container images
- Monitoring the integrity and origin of images
- Running the scanner in SBOM mode
- Running the scanner in lite SBOM mode
- Getting scan results in JSON or HTML format
- Specifying secrets when starting a scan
- Configuring integration with image signature validators
- Setting up integration with notification outputs
- Configuring LDAP server integration
- Configuring integration with SIEM systems
- Integrating with HashiCorp Vault
- Setting up integration with external image registries
- Security policies configuration
- Scanner policies
- Assurance policies
- Response policies
- Runtime policies
- Creating a runtime policy
- Editing runtime policy settings
- Managing container runtime profiles
- Managing runtime autoprofiles
- Deleting policies
- Compliance check
- Configuring and generating reports
- File Threat Protection
- Users, roles, and scopes
- Managing users
- About user roles
- Working with system roles
- Displaying list of roles
- About scopes
- Scopes and enforcement of security policies
- Switching between scopes
- Adding users, roles, and scopes
- Resetting password for user accounts
- Changing settings for users, roles, and scopes
- Removing users, roles, and scopes
- Using Kaspersky Container Security OpenAPI
- Security event log
- Information about the status of solution components
- Ensuring safety and reliability of components
- Managing the dynamics of data accumulation
- Backing up and restoring data
- Contacting Technical Support
- Sources of information about the application
- Limitations and warnings
- Vulnerabilities in third-party services
- Glossary
- Third party code information
- Trademark notices
- ATT&CK MITRE Terms of Use
Kaspersky Container Security 2.0 Help
|
Learn about the new functional capabilities of Kaspersky Container Security. |
|
Hardware and software requirements Check the supported orchestration platforms, CI systems, available image registries, and user workstation requirements. |
|
Licensing Kaspersky Container Security Learn more about license types provided for Kaspersky Container Security. |
|
Installing Kaspersky Container Security Prepare for installation and install Kaspersky Container Security in a private or public corporate network. |
|
Scan objects and receive information about detected vulnerabilities, malware, misconfigurations, and sensitive data. |
|
Accepting risks identified by Kaspersky Container Security (vulnerabilities, malware, sensitive data, and misconfigurations) to change the security status of images. |
|
Security policies configuration Configure scanner policies, assurance policies, response policies, and runtime policies to conduct scans in accordance with your requirements. |
|
Image scanning from registries and integration with CI/CD During the project build in the CI system, run the Kaspersky Container Security scanner to check the objects in the repository for compliance with the enabled security policies. |
|
Configure integrations with Telegram and email addresses to receive notifications about security events. |
|
Integration with Active Directory Configure user roles using data on groups from Active Directory |
|
Process control within containers Use container runtime profiles to control processes and applications inside containers. |
|
Learn more about registration of user activity and storage of scan results. |


About the Kaspersky Container Security platform
Kaspersky Container Security (hereinafter referred to as the solution) allows you to discover security problems and provides protection throughout the lifecycle of container applications, from development and deployment control to runtime.
Solution functionality:
- Integration with image registries (for example, Docker Hub, JFrog Artifactory, Sonatype Nexus Repository OSS, GitLab Registry, Harbor) to scan images in the registry for known vulnerabilities published by the NVD and the Data Security Threats Database (FSTEC), secrets (passwords, access keys, tokens), misconfigurations, and malware.
- Integration into the process as a pipeline stage, as well as scanning for misconfigurations and container images for vulnerabilities, malware, and sensitive data (secrets).
- Checking of cluster nodes for compliance with information security benchmarks.
- Monitoring compliance with the configured security policies while building and running the applications, including container startup control in the runtime.
- Monitoring of resources used by the controlled clusters.
You can configure and access the functionalities of Kaspersky Container Security through the Management Console. The console is implemented as a web interface which can be accessed through the Chromium (Google Chrome, Microsoft Edge), Apple Safari or Mozilla Firefox browsers.
What's new
Kaspersky Container Security 2.0 offers the following new features and improvements:
- Centralized investigation of vulnerabilities in CI/CD artifacts, image registries, and runtime.
- Enhanced capabilities of logging container events associated with network traffic (inbound and outbound), file operations, launched processes and File Threat Protection.
- Uninterrupted monitoring of infrastructures containing up to several thousand nodes.
- Integration with HashiCorp Vault external secret storage:
- Reading of secrets created in advance for the Kaspersky Container Security components
- Use of Vault PKI to create TLS certificates for cross-service interaction
- Integration with security information and event management (SIEM) software:
- Configuration of integration with several products in UI
- Specification of parameters for sending messages for various events (Administration, Alert, CI/CD, Policies, Resources, Scanners, Admission controller, API)
- Specification of parameters for sending messages for container events associated with network traffic (inbound and outbound), file operations and launched processes
- Generation of reports in the .JSON and .XML formats.
- Scanning the infrastructure for compliance with cluster security benchmarks.
- Generation of cluster benchmarks summary report.
- Improved integration with LDAP (Bind DN scheme).
- Container Runtime Profile generation based on container performance analysis (autoprofiling).
- Improvement of OpenAPI:
- Getting data on Core Health Check
- Management of scanner policies, assurance policies, response policies and runtime policies
- Runtime profiles management
- Getting system event log
- Getting container event log
- Risk management
- Autoprofiling tasks management
- Getting information about integration with image signature validators
- Support for integration with the following external image registries:
- Amazon Elastic Container Registry
- Red Hat Quay
- Scanning of OCI directory in CI/CD processes.
Distribution kit
For information about purchasing the application, please visit https://www.kaspersky.com or contact our partners.
The distribution kit includes a Helm Chart package with the containerized resources necessary for deploying and installing Kaspersky Container Security components. The containerized components from the distribution kit are listed in the table below.
Containerized components from the Kaspersky Container Security distribution kit
Component |
Image |
Pod |
|---|---|---|
ClickHouse DBMS |
clickhouse |
kcs-clickhouse |
PostgreSQL DBMS |
postgresql |
kcs-postgres |
Middleware |
middleware |
kcs-middleware |
Event Broker |
event-broker |
kcs-eb |
Image Handler, client scanner |
image-handler |
kcs-ih |
Scanner |
scanner-server |
kcs-scanner |
Licenses |
licenses |
kcs-licenses |
File storage (Minio) |
minio |
kcs-s3 |
Multi-threaded event-based key-value cache storage (Memcached) |
memcached |
kcs-memcached |
Update file server for private corporate networks (Updates) |
updates |
kcs-updates |
Solution interface (Panel) |
nginx |
kcs-panel |
Agent Broker |
agent-broker |
kcs-ab |
Agents |
node-agent |
node-agent |
The Helm package also includes a values.yaml configuration file that contains the values of settings for installing and updating the solution.
After downloading and saving the Helm package in a selected directory, the orchestrator downloads the images from the source specified in the Helm package directly to the orchestration platform nodes.
The information required to activate the application is sent to you by email.
Page top
Hardware and software requirements
To install and operate Kaspersky Container Security, the following infrastructure requirements must be met:
- One of the following orchestration platforms:
- Kubernetes 1.21 or later
- OpenShift 4.8, 4.11, or later
- DeckHouse 1.52 or 1.53 (CNI: Flannel)
- DropApp 2.1
- Availability of a CI system to scan container images within the development process (for example, GitLab CI).
- Installed package manager Helm 3.10.0 or later.
To implement runtime monitoring with container runtime profiles, orchestrator nodes must meet the following requirements:
- Linux kernel 4.18 or later.
Some mechanisms to manage process privileges at the level of the Linux kernel are used with Linux kernel version 5.8 or later. If the Linux kernel version is prior to 5.8, when installing Kaspersky Container Security, you must disable the list of these process privilege management mechanisms for the kcs-ih component and set it to privileged mode.
Example of setting privileged mode - Container runtimes (CRI): containerd, CRI-O.
- Container Network Interface (CNI) plug-ins: Flannel, Calico, Cilium.
Architecture requirements:
Kaspersky Container Security supports the x86 architecture.
Minimum supported versions of Linux distributions and Linux kernels for implementing runtime monitoring using container runtime profiles:
- CentOS 8.2.2004 or later + kernel 4.18.0-193 or later.
- Ubuntu 18.04.2 or later + kernel 4.18.0 or later
- Debian 10 or later + kernel 4.19.0 or later
- Astra Linux SE 1.7. * + Kernel 6.1.50-1-generic.
If Astra Linux OS is used, kernel configuration must have the
CONFIG_DEBUG_INFO_BTF=yoption. - RHEL 9.4 or later + kernel 5.14 or later
- Red Hat Enterprise Linux CoreOS 416.94.202408200132-0 + kernel 5.14.0-427.33.1.el9_4.x86_64
- RED OS 7.3 or later + kernel 6.1 or later (CRI: CRI-O, CNI: Calico).
- Sber Linux 8.9, 9.3 + kernel 5.14 (CRI: CRI-O, CNI: Calico, Cilium)
When using Cilium 1.16, you must set
enableTCXtofalse.
If your infrastructure contains host servers running other Linux distributions, we recommend contacting Technical Support. Technical Support will check the compatibility of the solution with your distributions. If such compatibility is not available, the distributions may be supported by future versions of Kaspersky Container Security.
Kaspersky Container Security ensures correct operation when used in an Istio service mesh infrastructure.
The solution supports integration with Hashicorp Vault 1.7 or later.
Kaspersky Container Security works with ClickHouse 22.6 or later.
When using external database management systems, Kaspersky Container Security supports the following DBMS:
- PostgreSQL 11.*, 13.*, 14.*, 15.*
- Pangolin 6.2.0
Kaspersky Container Security supports integration with the following image registries:
- GitLab 14.2 or later
- Docker Hub V2 API
- JFrog Artifactory 7.55 or later
- Sonatype Nexus Repository OSS 3.43 or later
- Harbor 2.х
- Yandex Registry (integration using the Yandex Container Registry API)
- Docker Registry (integration using the Docker V2 API)
- Red Hat Quay 3.x
Kaspersky Container Security supports both IPv4 and IPv6 networks.
Image requirements (OS, version, scanned packages):
- AlmaLinux, versions 8, 9. Packages installed via dnf/yum/rpm are scanned.
- Alpine Linux, versions 2.2 - 2.7, 3.0 - 3.20, Edge. Packages installed via apk are scanned.
- Amazon Linux, versions 1, 2, 2023. Packages installed via dnf/yum/rpm are scanned.
- Astra Linux SE, versions 1.6.x, 1.7.x. Packages installed via apt/dpkg are scanned.
- CBL-Mariner, versions 1.0, 2.0. Packages installed via dnf/yum/rpm are scanned.
- CentOS, versions 6, 7, 8. Packages installed via dnf/yum/rpm are scanned.
- Chainguard, all versions. Packages installed via apk are scanned.
- Debian GNU/Linux, versions 7, 8, 9, 10, 11, 12. Packages installed via apt/dpkg are scanned.
- openSUSE Leap, versions 42, 15. Packages installed via zypper/rpm are scanned.
- openSUSE Tumbleweed, all versions. Packages installed via zypper/rpm are scanned.
- Oracle Linux, versions 5, 6, 7, 8. Packages installed via dnf/yum/rpm are scanned.
- Photon OS, versions 1.0, 2.0, 3.0, 4.0. Packages installed via tdnf/yum/rpm are scanned.
- Red Hat Enterprise Linux, versions 6, 7, 8. Packages installed via dnf/yum/rpm are scanned.
- RedOS, versions 7.1, 7.2, 7.3.x, 8.0. Packages installed via dnf/yum/rpm are scanned.
- Rocky Linux, versions 8, 9. Packages installed via dnf/yum/rpm are scanned.
- SUSE Enterprise Linux, versions 11, 12, 15. Packages installed via zypper/rpm are scanned.
- SUSE Linux Enterprise Micro, versions 5, 6. Packages installed via zypper/rpm are scanned.
- Ubuntu, all versions supported by Canonical. Packages installed via apt/dpkg are scanned.
- Wolfi Linux, all versions. Packages installed via apk are scanned.
- OS with the Conda command line tool installed. Packages installed via conda are scanned.
When configuring Kaspersky Container Security in a cluster with three worker nodes, three scanner pods (kcs-ih) and a maximum image scan size of 10 GB, the cluster working node must meet the following requirements:
- At least 12 processor cores
- At least 20 GB of RAM
- 40 GB of free disk space
- At least 1 Gbps of communication channel bandwidth between cluster components
To run agents in a cluster, each worker node must be provided with the following additional resources:
- Basic requirements:
- 0.2 processor cores
- 200 MB of RAM
- 15 GB of free disk space
- Requirements when enabling the following agent functionalities (additional to the baseline requirements):
- Network and process monitoring:
- 2 installed processor cores
- 2 GB of added RAM
- Anti-malware protection:
- 2 installed processor cores
- 2 GB of added RAM
- Network and process monitoring:
When all agent functionalities are enabled, the following requirements to additional resources must be met:
- 2 processor cores
- 4 GB of RAM
An agent on a worker node discontinues its operation if the worker node stops working.
You must allocate free disk space for ClickHouse DBMS taking into account the number of monitored nodes. Each node requires 1 GB of free disk space for ClickHouse Persistent Volume.
The above requirements apply to Kaspersky Container Security deployment only; they do not take into account other loads on the client's resources.
Kaspersky Container Security user workstation requirements:
- Permanent Internet connection when deployed in a public corporate network.
- Access to the Management Console page of Kaspersky Container Security (address within customer's corporate network, specified during installation).
- Communication channels with at least 10 Mbit/s bandwidth.
- One of the following browsers:
- Google Chrome version 73 or later.
- Microsoft Edge version 79 or later.
- Mozilla Firefox version 63 or later.
- Apple Safari version 12.1 or later.
- Opera version 60 or later.
Scaling
To achieve and maintain optimal performance when scanning the incoming volume of Kaspersky Container Security images, you must take into account the number of scanning pods and cluster nodes supported by the solution.
Scaling the number of scanning pods
Kaspersky Container Security supports scaling for the number of scanning pods to ensure that the incoming image volume can be scanned. You can scale the number of scanning pods up or down at any time while the solution is operating.
When a scanning pod is added, the system resources increase as follows:
- The number of node processors—by 2.
- The amount of RAM on the nodes—by 2 GB.
- The amount of free disk space on a node hard drive—by 12 GB.
To scan images larger than 10 GB, the kcs-ih service resources must be increased as follows per scanning pod and for each additional GB.
- The amount of RAM on the nodes—by 300 MB.
- The amount of free disk space on a node hard drive—by 1 GB.
If the images are not scanned for configuration file errors during standard operation mode, it is not necessary to increase the RAM of the scanning pods.
To process the results of scanning many large objects faster, you can allocate more resources to the job handler service by updating variables in the Helm package.
To add more scan job handling resources:
- Open the Helm package and specify the required number of handlers for the
kcs-middlewareparameter in thescanWorkersvariable in thedefaultsection. - In the
requestsandlimitsvariables, specify the size of RAM as determined according to the following formula:memory = X * scanWorkers / 2, wherememoryis the size of RAM allocated to the image handler service.Xis the original value of the variable that denotes the size of RAM.scanWorkersis the number of handlers specified in step 1.The result of
scanWorkers/2can't be zero. - In the
requestsandlimitsvariables, specify the CPU resources as calculated according to the following formula:cpu = X*scanWorkers, wherecpuis the CPU resources allocated to the image handler service.Xis the original value of the variable that denotes the CPU resources.scanWorkersis the number of handlers specified in step 1.
Example of adding more scan job handling resources
Page top
Accounting for the number of served cluster nodes when scaling
One instance of Kaspersky Container Security supports working with up to 600 monitored clusters. The number of served nodes of each cluster is scaled by changing the following components:
- kcs-ab to increase or reduce the number of component replicas.
- kcs-memcached to increase or reduce the resource allocation requirements of the component.
By default, Kaspersky Container Security is shipped with the following values set for these components:
- kcs-ab:
- 1 pod per replica allowing to serve 2000 nodes.
- Requested amount of resources: 0.5 CPU core for nodes; 512 MB of RAM for nodes.
- Maximum resource usage: 1 CPU core for nodes; 1 GB of RAM for nodes.
- kcs-memcached:
- Requested amount of resources: 2 CPU core for nodes; 2 GB of RAM for nodes.
- Maximum resource usage: 4 CPU core for nodes; 4 GB of RAM for nodes.
Kaspersky Container Security scales by increasing the following parameters:
- For kcs-ab, adding one pod to a replica increases the number of supported nodes by 2000.
- For kcs-memcached, adding one pod to the kcs-ab component requires increasing the requested resources and the maximum resource usage of the kcs-memcached component by the following amounts:
- Requested amount of resources: 0.5 CPU core for nodes; 2 GB of RAM for nodes.
- Maximum resource usage: 0.5 CPU core for nodes; 2 GB of RAM for nodes.
For example, if an instance of Kaspersky Container Security serves 10,000 nodes in a user's clusters, the following parameters apply:
- kcs-ab:
- 5 pods per replica.
- Requested amount of resources: 0.5 CPU core per node; 512 MB of RAM per node.
- Maximum resource usage: 1 CPU core for nodes; 1 GB of RAM for nodes.
- kcs-memcached:
- Requested amount of resources: 4 CPU core for nodes; 10 GB of RAM for nodes.
- Maximum resource usage: 6 CPU core for nodes; 12 GB of RAM for nodes.
The values given are approximate because the deployment requires taking into account the specifics of virtualization settings and the performance of host servers (nodes) in the given infrastructure.
Page top
System packages of base images
The following operating system images are used as base images by Kaspersky Container Security:
- Alpine 3.18.4.
- Ubuntu 23.10.
- Oracle Linux 9.2.
Package management systems ("package managers") are used to manage the installation, removal, configuration, and updating of various software components. Kaspersky Container Security uses the following package managers for its base operating systems:
- For Alpine, apk.
- For Ubuntu, apt.
- For Oracle Linux, rpm.
To get information about installed system packages,
use the standard orchestrator tools for accessing a running container and (depending on the package manager used) enter the following bash command:
- For apk:
apk -q list | grep "installed". - For apt:
apt list --installed. - For rpm:
yum list installed.
Scanned application software packages
Kaspersky Container Security supports the following scanned application software packages in the specified programming languages:
- Ruby:
- gemspec (image is scanned).
- Gemfile.lock (repository in CI/CD is scanned).
- Python:
- egg package, wheel package, conda package (image is scanned).
- Pipfile.lock, poetry.lock, requirements.txt (repository in CI/CD is scanned).
- PHP:
- installed.json (image is scanned).
- composer.lock (repository in CI/CD is scanned).
- Node.js:
- package.json (image is scanned).
- package-lock.json, yarn.lock, pnpm-lock.yaml (repository in CI/CD is scanned).
- .NET: packages.lock.json, packages.config, .deps.json, Packages.props (image and repository in CI/CD are scanned).
- Java:
- * .jar, * .war, * .par and * .ear (image is scanned).
- pom.xml, * gradle.lockfile, * .sbt.lock (repository in CI/CD is scanned).
- Go:
- Binary files (image is scanned).
- go.mod (repository in CI/CD is scanned).
- Rust:
- Binaries checked by Cargo (image is scanned).
- Cargo.lock (image and repository in CI/CD are scanned).
- C/C++: conan.lock (repository in CI/CD is scanned).
- Elixir: mix.lock (repository in CI/CD is scanned).
- Dart: pubspec.lock (repository in CI/CD is scanned).
- Swift: Podfile.lock, Package.resolved (repository in CI/CD is scanned).
- Julia: Manifest.toml (image and repository in CI/CD are scanned).
Working in cloud-based environments
Kaspersky Container Security can operate in various cloud environments. For more information on launching the solution in cloud environments, contact your Presales Manager.
Page top
Solution architecture
Kaspersky Container Security components are deployed based on the images included in the distribution kit. The table below shows which images correspond to which solution components.
Kaspersky Container Security components
Component |
Image |
Component function |
|---|---|---|
ClickHouse DBMS |
clickhouse |
Managing ClickHouse databases for storing and processing informational messages from agents. |
PostgreSQL DBMS |
postgresql |
Managing databases using tools for analyzing and optimizing query parsing and query engines.
|
Middleware |
middleware |
Implements the data processing business logic of the server component of the solution and exposes a REST API to the graphical user interface of Kaspersky Container Security. |
Event Broker |
event-broker |
Ensuring communication between various elements of the distributed solution system. |
Image Handler, client scanner |
image-handler |
Processing scan jobs using vulnerability and malware scanners: starting scan jobs, scanning objects, aggregating and publishing scan results. |
Scanner server |
scanner-server |
Managing the scanner server, which is used to store the vulnerabilities database and the image layer cache, as well as to support the image handler. |
Licensing module |
licenses |
Manage functionalities provided under the license. |
File storage |
minio |
Managing the storage for storing and distributing to users the files that the solution generates. |
Multi-threaded event-based key-value cache storage |
memcached |
Managing the cache storage for keys and values that the solution receives as part of events. |
File server with updates for private corporate networks |
updates |
Delivery of updates when the solution is deployed. |
Solution interface |
nginx |
Functioning of the Kaspersky Container Security graphical user interface. |
Agent Broker |
agent-broker |
Ensuring communication between various elements of the distributed solution system. |
Agents |
node-agent kube-agent |
Maintaining security on the nodes in accordance with configured security policies and integration with the orchestrator. |
The solution includes the following main components:
- Kaspersky Container Security Middleware
- Kaspersky Container Security Agents
- Kaspersky Container Security Scanner
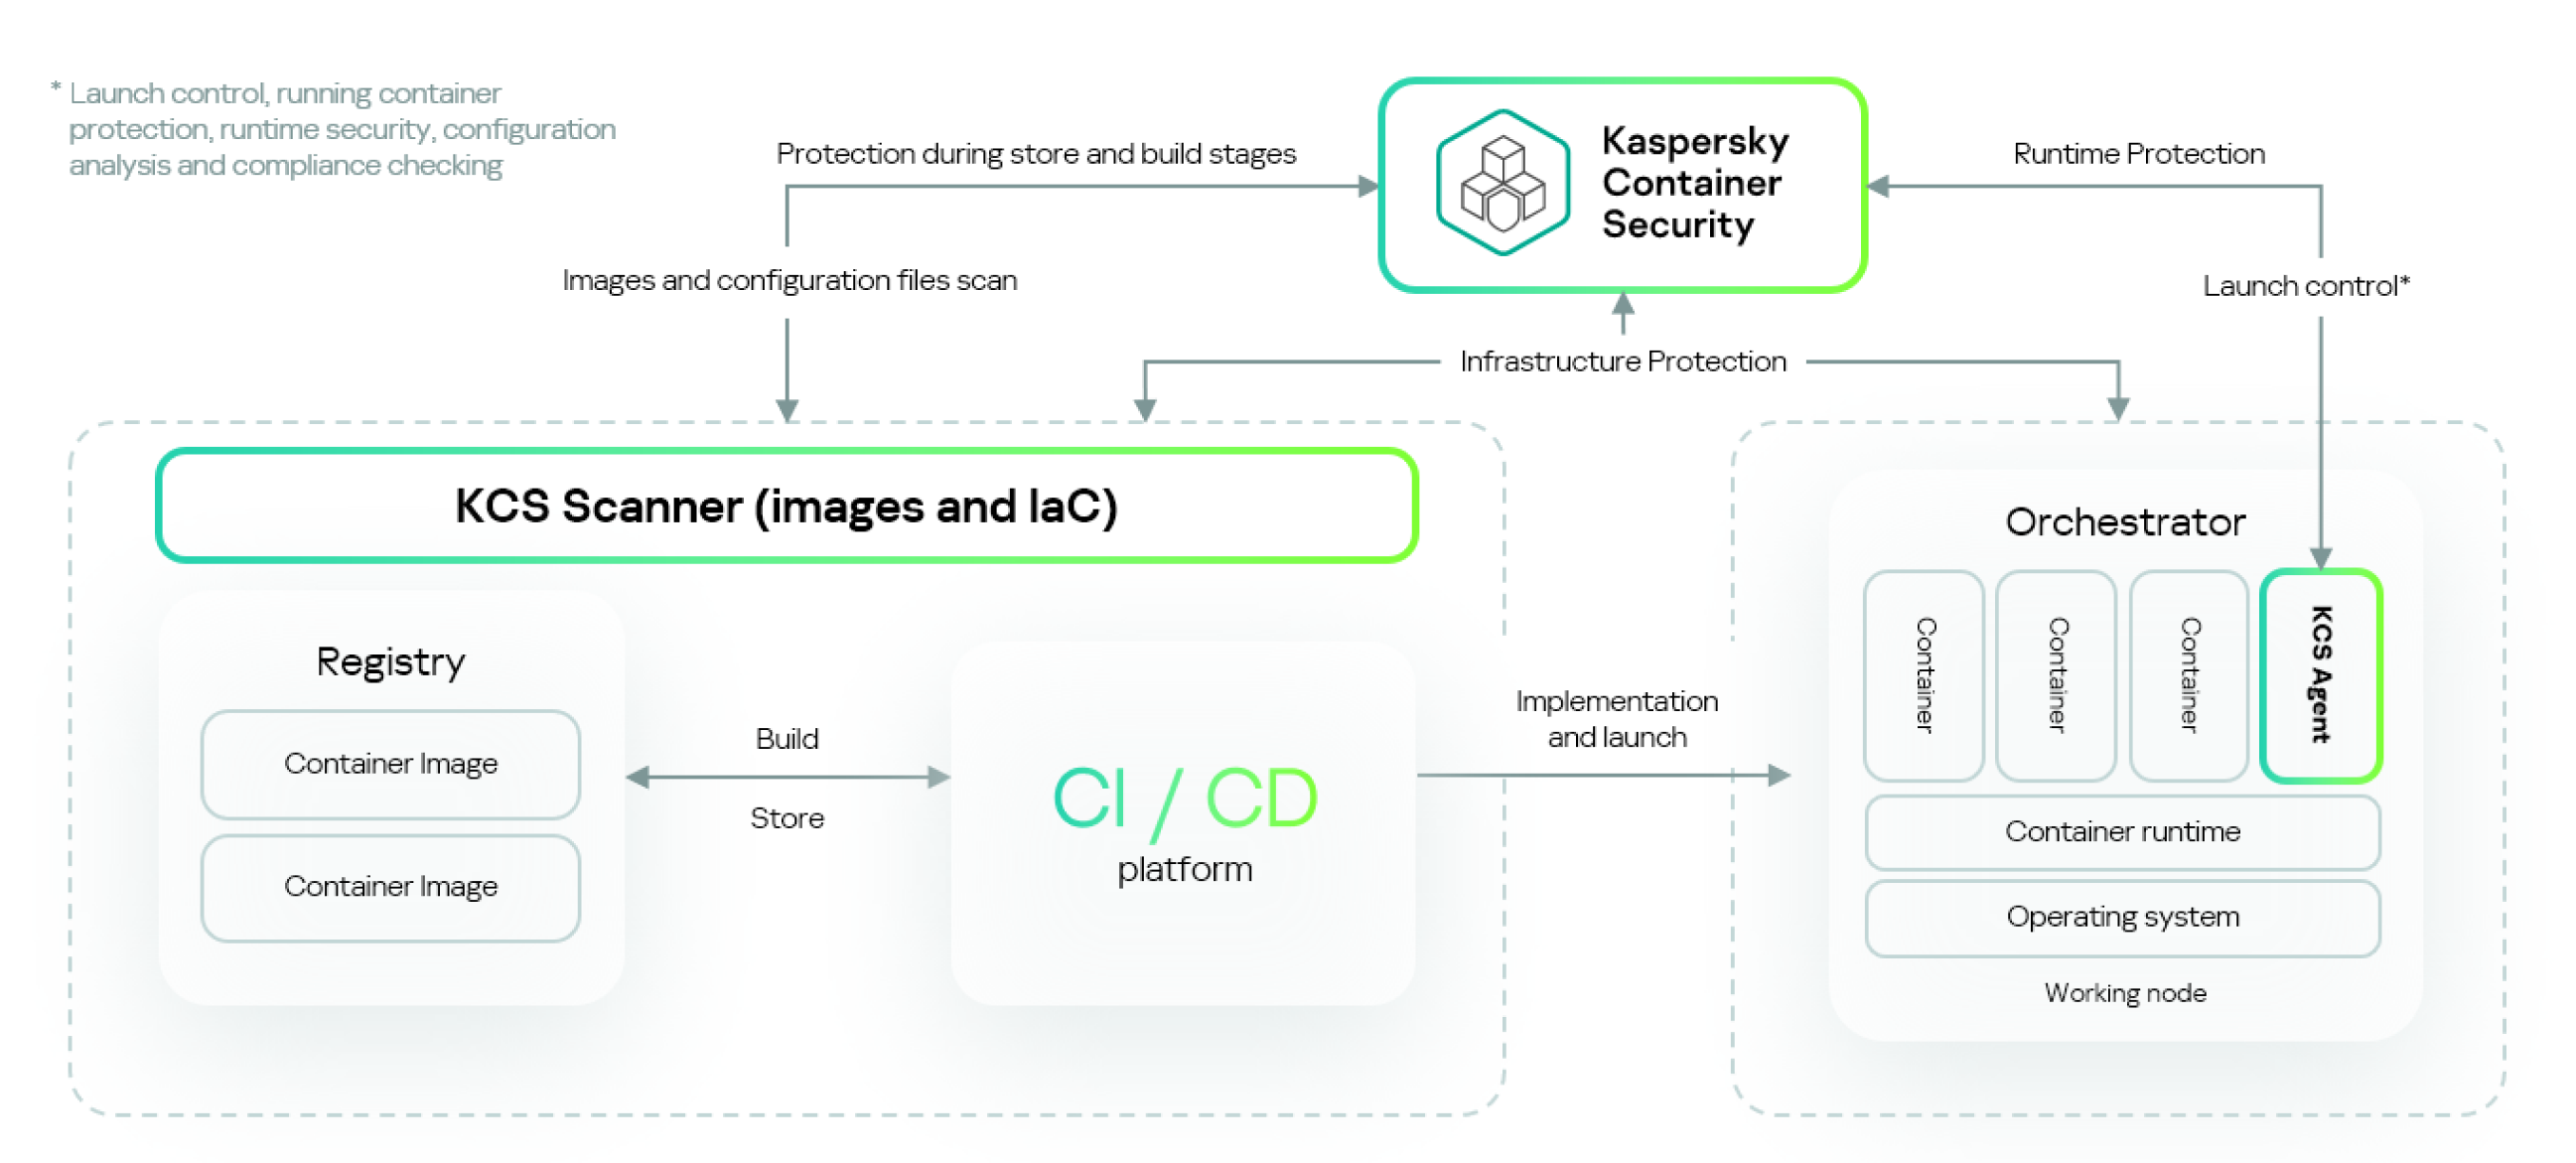
Overall architecture scheme of Kaspersky Container Security
Kaspersky Container Security can be deployed in a public or private corporate network.
Middleware
The Kaspersky Container Security middleware has the following functions:
- Provides an interface for interactive management of the solution (Management Console).
- Ensures integration with external software components (SIEM, CI, image registries, LDAP, Telegram, email) and the receipt of information from them.
- Coordinates the operation of other solution components.
- Ensures the creation and management of security policies.
- Displays the results of solution operations.
Agents
Kaspersky Container Security Agents (hereinafter also referred to as "agents") are a solution component that runs as a containerized application and provides security on nodes in accordance with configured security policies, in particular:
- Runtime security of containers running on the nodes.
- Network interaction between pods and applications inside containers.
- Integration with the orchestration platform and flow of data necessary for analysis of the orchestrator configuration and its components.
- Startup of containers from trusted images to prevent unverified images from running.
Agents are installed on all nodes of clusters and all clusters that need protection. Kaspersky Container Security works with two types of agents: cluster protection agents (csp-kube-agent) and node protection agents (csp-node-agent). Together they form groups of agents. A separate group of agents is created for each cluster. Multiple groups of agents can be created for one installation of the solution.
Agents do not inject their executable code into containers in monitored clusters.
If the cluster contains no agents, some of the solution functionality is unavailable (for example, runtime policies, resource monitoring).
Scanner
Scanner is a Kaspersky Container Security software component that scans objects in real time to assess their security and detect known vulnerabilities, malware, signs of sensitive data, and misconfigurations. The scanner lets you conduct security checks based on active security policies.
Kaspersky Container Security employs the following types of scanners:
- Vulnerability scanner based on the Common Vulnerabilities and Exposures (CVE) database
- File threat scanner within the File Threat Protection component
- Configuration file scanner
- Sensitive data (secrets) scanner
About object scanning
Kaspersky Container Security checks objects deployed in the solution during the scanning process. The scanning process searches for and analyzes threats and security risks associated with objects in the solution. Object scans must be performed regularly to keep track of emerging security threats.
When scanning, Kaspersky Container Security identifies the following security threats:
- Vulnerabilities
- Malware.
- Misconfigurations
- Sensitive data
- Non-compliance with security policy requirements
Scanning process
The scanner receives scan jobs through the image handler. The image handler is a module deployed in the Kaspersky Container Security infrastructure that forwards scan jobs to the scanner and receives the scan results from the scanner.
When scan jobs are forwarded, the current status of the scanner is determined as one of the following:
- Free — the scanner is not processing objects and can accept a job from the image handler application if requested.
- Busy — the scanner is currently processing a scan job. A new job from the image handler application is put in the queue.
The scan job queue includes all forwarded scan jobs and is generated in the following cases:
- An image registry scan is manually started.
- An image registry scan is automatically started.
- A bulk scan of cluster objects is started.
Jobs in the scan queue receive the following statuses:
- Pending — status assigned by default when a job is created.
- In progress — the job is being processed by the image handler.
- Parsing results — the solution processes the job scanning results to display them in the interface.
- Error— scan job failed.
- Finished — the results of the scan job are available.
Scan jobs from the queue are submitted to the image handler in the order of their receipt. A scan job then goes to a scanner with Free status and is scanned for security issues. The scan results are sent back to the image handler. The scan job is considered completed and finished if scanning results are received. If a scan job was performed three or more times but received no results, the scan job is given the Error status.
When scanning many large objects, the solution may be slower to display scan results in the user interface. You may have to wait up to several minutes for the results to appear. During this time, the scan jobs are displayed in the Scanners section with the Parsing results status.
If you want to speed up the processing of scan results, you can allocate more resources to the scan job handler by updating the variables in Helm Chart (for more details, see Scaling).
When an error occurs, the solution displays an error message that consists of a code and a text message (for example, HNDL-004: scan time out).
Error messages are displayed in English. Examples of messages and their meanings are listed in the table below.
Examples of possible error messages when running scan jobs
After scanning, the solution displays the scan results. If security threats are detected in an object, Kaspersky Container Security prompts you to perform one of the following actions:
- Delete the security threat.
- Accept the risk.
Requirements to third-party application passwords
Kaspersky Container Security operates using specific third-party services. The following solution components are included in the distribution kit:
- S3 compatible file storage
- ClickHouse DBMS
- PostgreSQL DBMS
- Multi-threaded event-based key-value cache storage Memcached
The parameters for deployment of these components are specified in the values.yaml configuration file in the Helm Chart package.
Passwords for these components have the following requirements:
- The minimum password length is 8 characters.
- Passwords must not contain the following special characters: ' and ".
Passwords are specified in the following variables in the configuration file:
MINIO_ROOT_PASSWORDfor S3-compatible file storage.CLICKHOUSE_PASSWORD,CLICKHOUSE_WRITE_PASSWORDandCLICKHOUSE_READ_PASSWORDfor ClickHouse.POSTGRES_PASSWORDfor PostgreSQL.MEMCACHED_PASSWORDfor the Memcached cache storage.
Standard deployment schemes
Kaspersky Container Security supports the following deployment scenarios:
- Deployment in a public corporate network (Internet access from the Kubernetes cluster is allowed):
- Images from which the Kaspersky Container Security components are deployed are located in a public repository.
- After installation, the solution components refer to the vulnerability databases on the Internet.
- Databases are updated using the Kaspersky update server, available on the Internet.
A private corporate network with access to servers in the allowed servers list may be considered a public corporate network.
- Deployment in a private corporate network (Internet access from the Kubernetes cluster is prohibited):
- An internal repository is used to host the images from which the Kaspersky Container Security components are deployed.
- Additionally, the component kcs-updates is installed, which is a special image containing the vulnerability databases and security benchmarks that the solution requires.
- After installation, the solution components refer to the vulnerability databases and security standards located in the special image kcs-updates inside the corporate network.
- The Update server providing threat database updates is deployed as a separate component in the corporate network.
A private corporate network also allows for deployment with a proxy server.
We do not recommend deploying the solution with a clustered infrastructure configuration in which network interaction between host servers (nodes) is conducted in the public Internet. If this configuration is used, network interaction in the cluster may be exposed to critical network security risks.
Deployment in a public corporate network
When deployed in a public corporate network, Kaspersky Container Security is allowed to access the Internet from a cluster. The solution databases are updated from external databases containing updates for the vulnerabilities and malware databases.
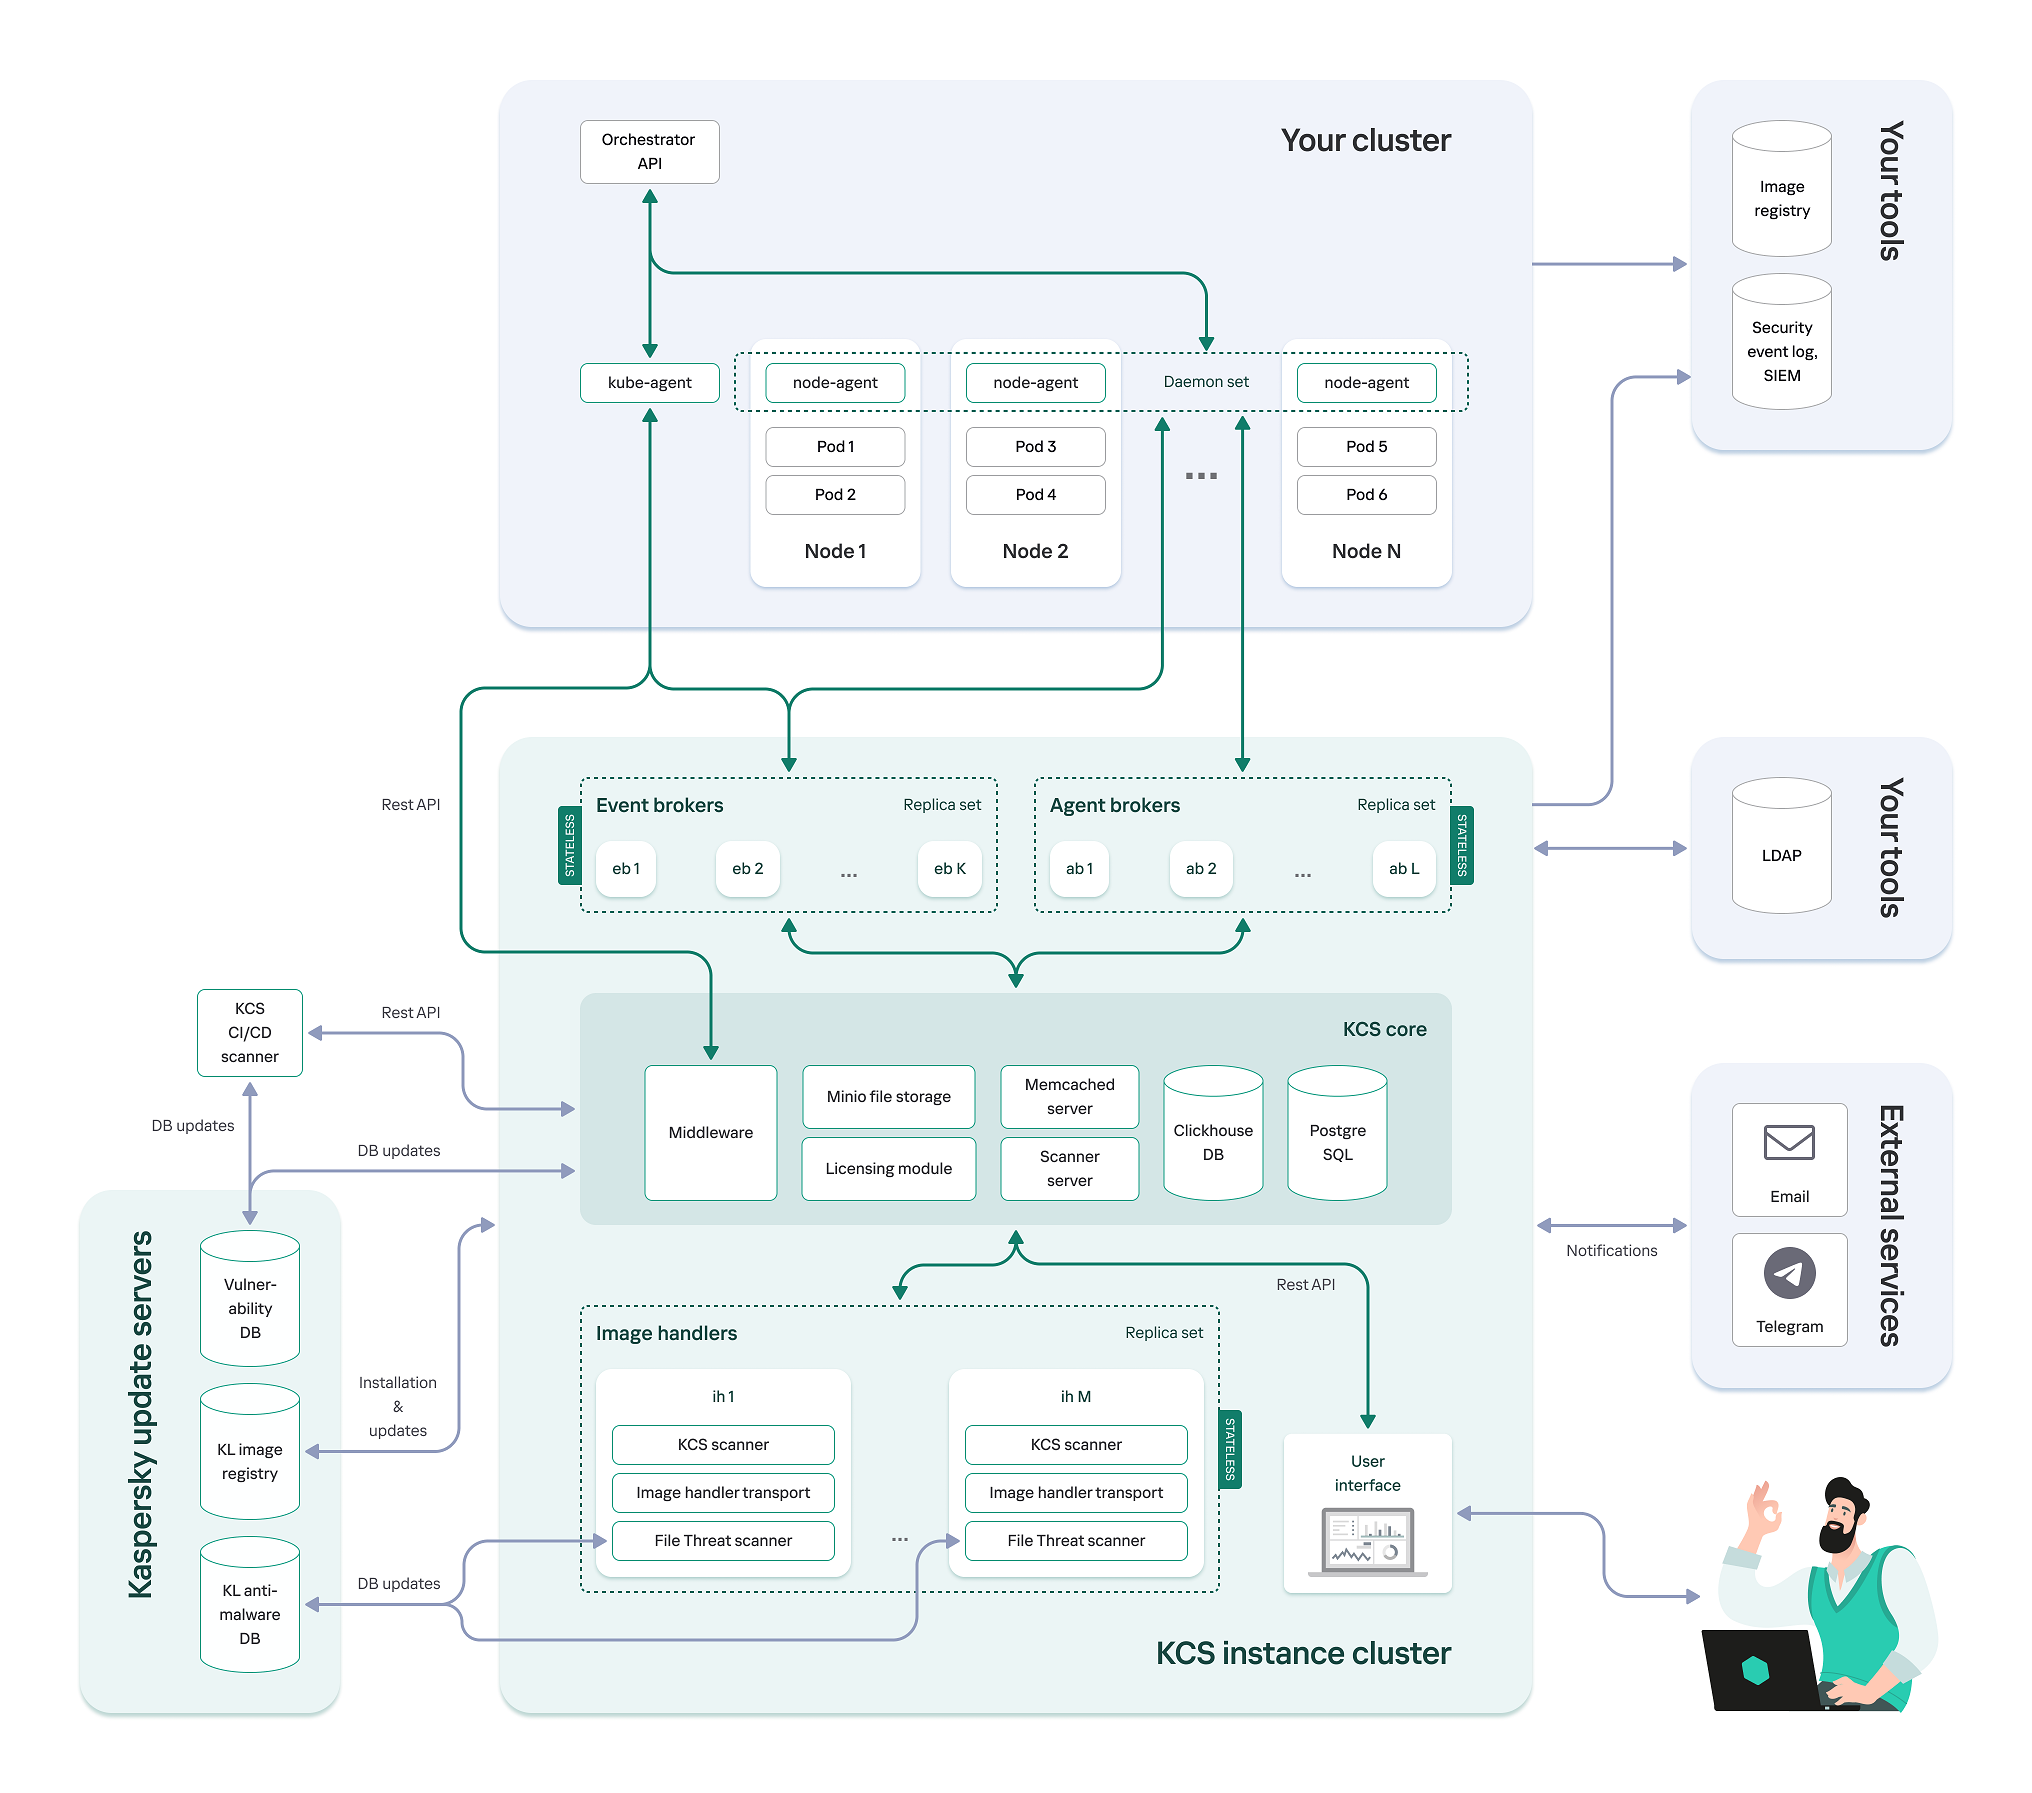
Solution architecture when deployed in a public corporate network
Page top
Deployment in a private corporate network
When deployed in a private corporate network, Kaspersky Container Security is prohibited from accessing the Internet from a cluster. The solution databases are updated by updating the images of the scanner that is run from the CI / CD and the image scanner.
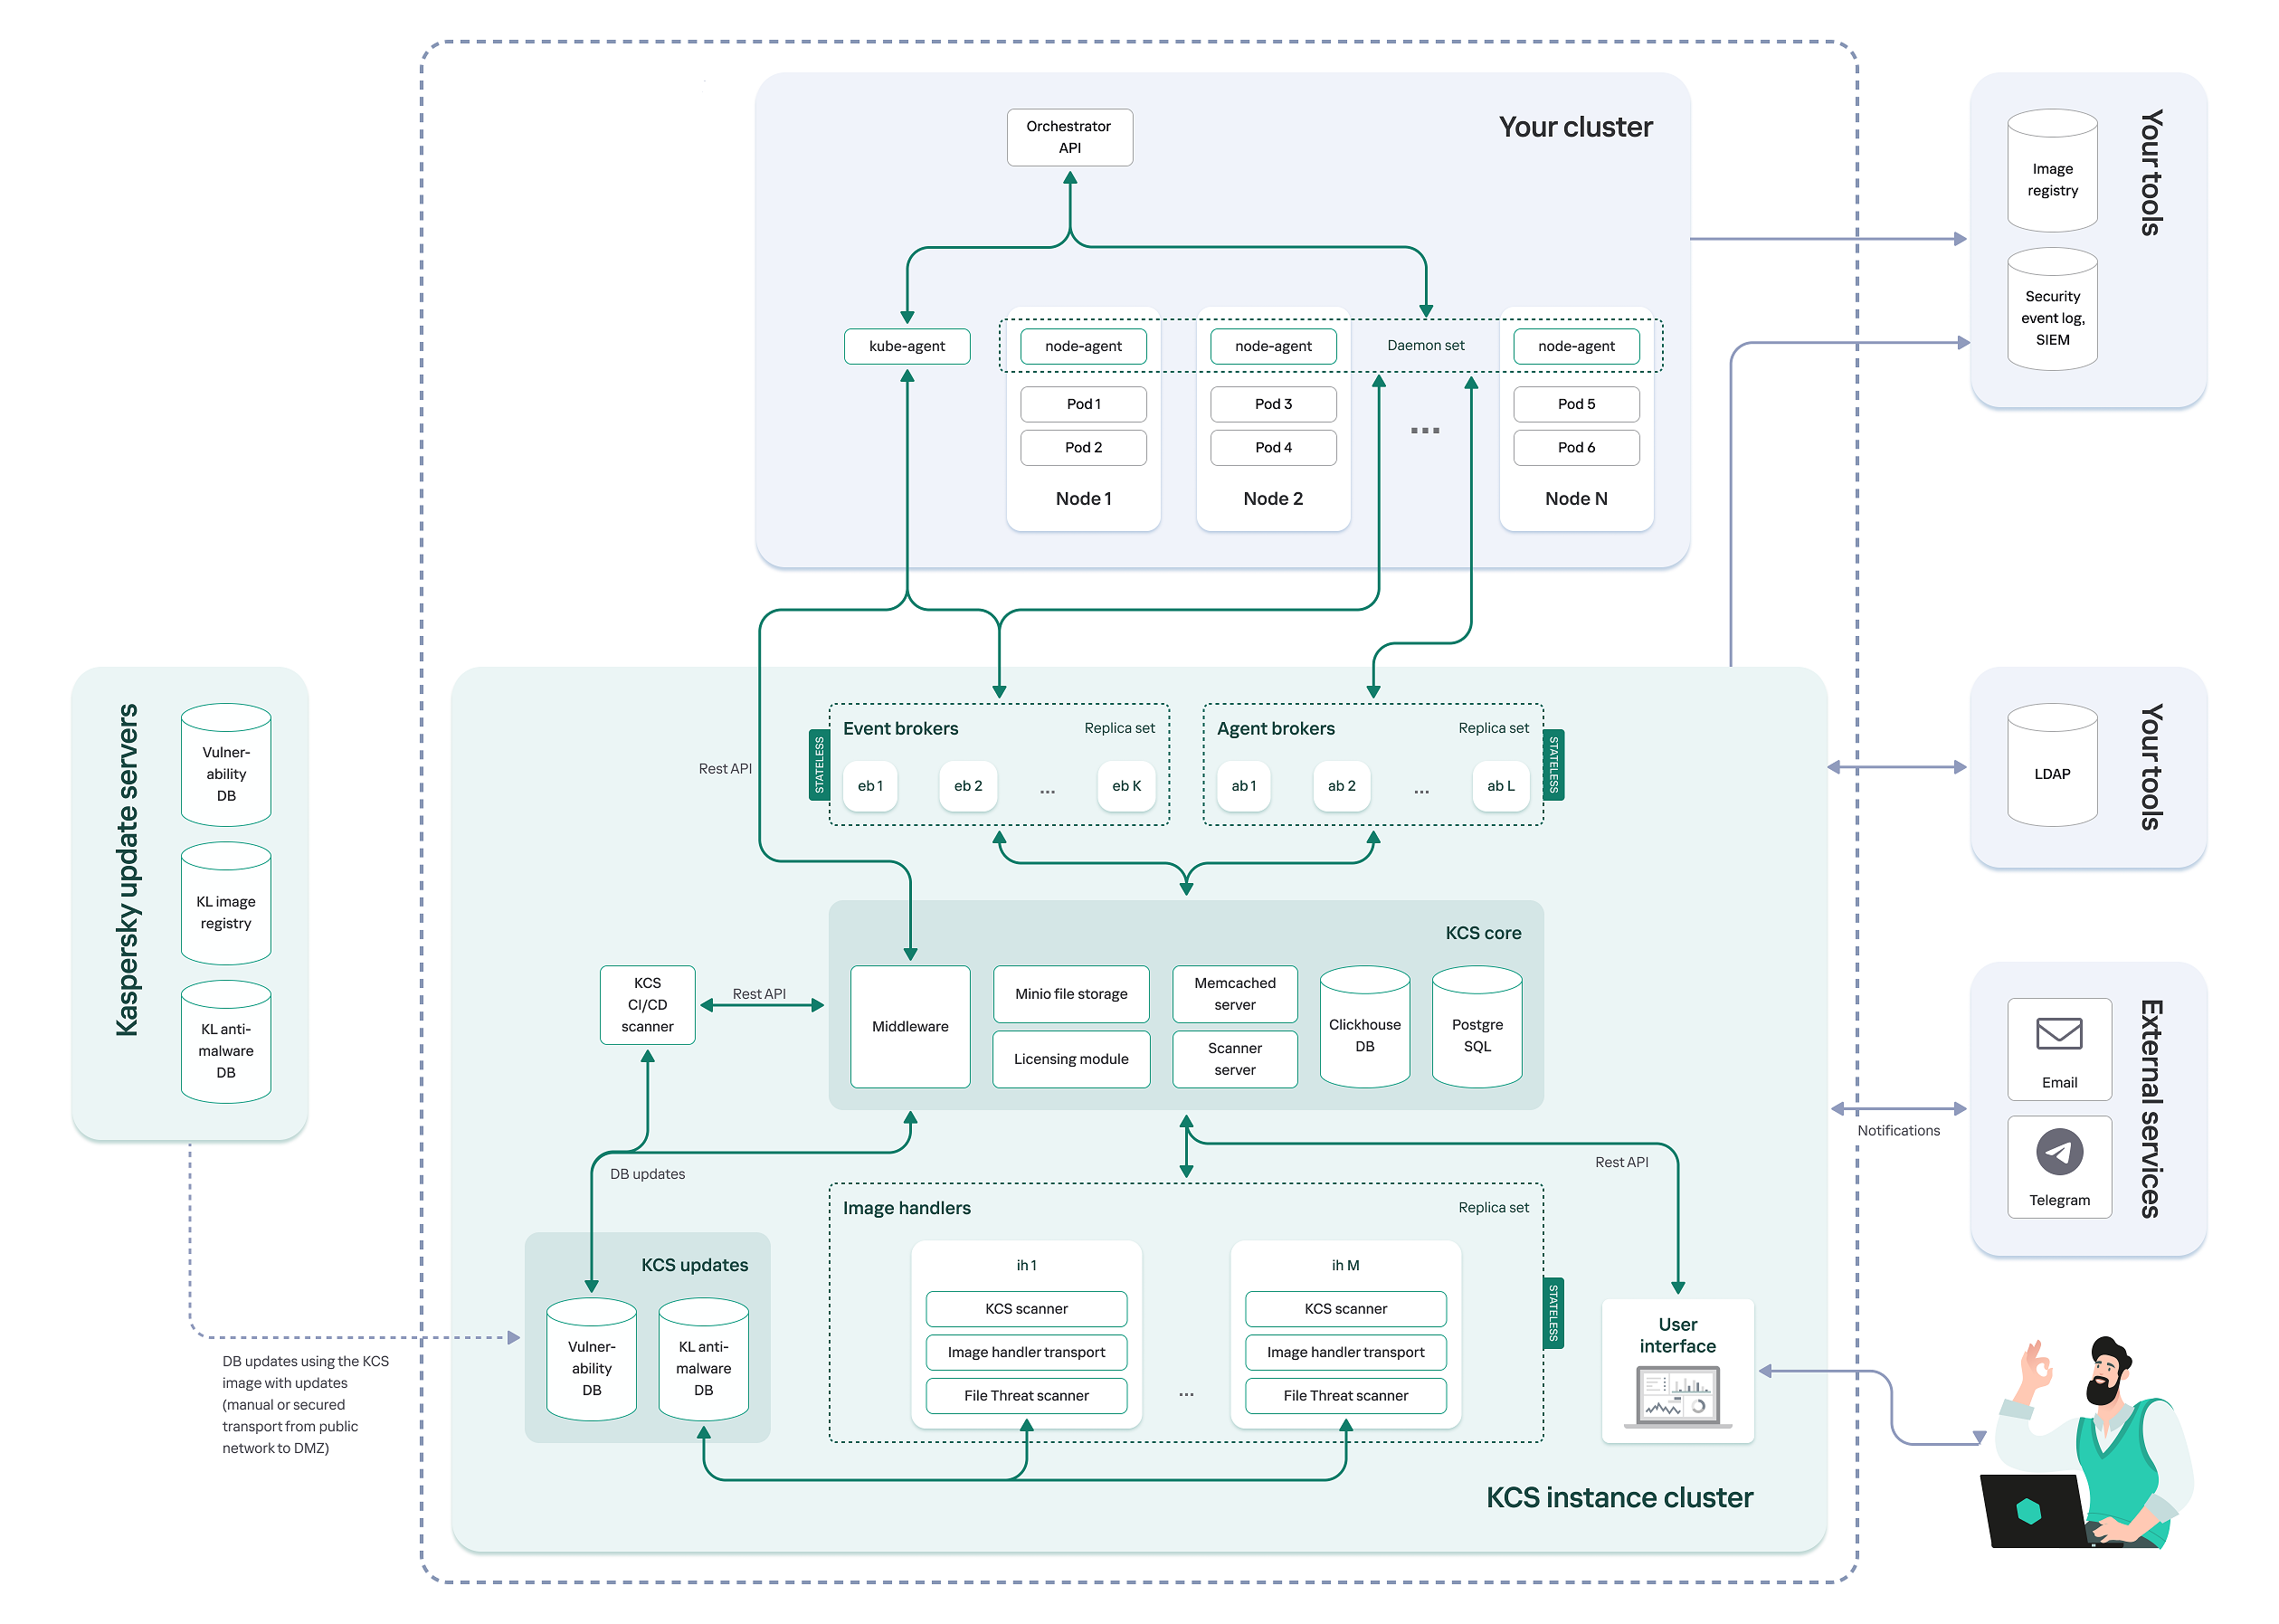
Solution architecture when deployed in a private corporate network
Page top
Preparing to install the solution
Prior to installing Kaspersky Container Security, you must install all certificates required for the corporate network and configure the proxy servers.
The solution can be deployed in a private or public corporate network.
Before installing Kaspersky Container Security, make sure that you have the following components and accesses:
- Virtual or physical machine with access to the Internet and the cluster.
- Helm package manager for packaging, configuring, and deploying applications and services in clusters.
Kaspersky Container Security supports Helm 3.10.0 and later.
- Internet access to download Helm Chart packages.
- Orchestrator management tool, for example, kubectl for Kubernetes or oc for Openshift.
- Access to a cluster using the kubeconfig file.
To install the solution in a private corporate network, configure a repository for container images. This repository accesses the Kaspersky Container Security vendor repository with the credentials provided by the solution vendor.
Preparing for installation in a private network
To prepare to install the solution in a private corporate network:
- Connect the vendor's Helm repository containing the Helm Chart package.
export CHART_URL="xxxxxx"export CHART_USERNAME="xxxxxx"export CHART_PASSWORD="xxxxxx"export VERSION="xxxxxx"The
CHART_URL, CHART_USERNAME, CHART_PASSWORD, and VERSIONvalues are provided by the vendor. - Fill in the file with the installation settings (values.yaml) included in the solution distribution kit according to the comments in the file.
We do not recommend specifying account data in the values.yaml file to be used when launching the Helm Chart package.
You can use one of the following secure methods to manage secrets:
- Using CI/CD systems. Secrets are specified using protected environment variables or built-in secret management mechanisms. During deployment, the data is dynamically inserted into the Helm Chart; it does not need to be specified openly in the values.yaml configuration file.
- Integrating with HashiCorp Vault. Helm Chart supports integration with HashiCorp Vault, where you can store secrets, and you must specify only the paths to such secrets in values.yaml.
The pull-secretvalues for Docker Registry cannot be fully stored in HashiCorp Vault. We recommend that you specify thepull-secretvalues manually in the section with the Kubernetes cluster parameters and refer to them from the Helm Chart.
The following main installation settings must be specified in the values.yaml file:
- Namespace name.
helm upgrade --install kcs . \--create-namespace \--namespace kcs \--values values.yaml \ - The domain name of Kaspersky Container Security for Inbound connections.
--set default.domain="kcs.example.domain.ru" \When network policies are enabled, you must specify at least one namespace for the cluster ingress controller.
--set default.networkPolicies.ingressControllerNamespaces="{ingress-nginx}" \By default, network policies are enabled.
- Secrets of the solution components.
--set secret.infracreds.envs.POSTGRES_USER="user" \--set-string secret.infracreds.envs.POSTGRES_PASSWORD="pass" \--set secret.infracreds.envs.MINIO_ROOT_USER="user" \--set-string secret.infracreds.envs.MINIO_ROOT_PASSWORD="password" \
--set-string secret.infracreds.envs.CLICKHOUSE_ADMIN_PASSWORD="pass" \--set secret.infracreds.envs.MCHD_USER="user" \--set-string secret.infracreds.envs.MCHD_PASS="pass" \To ensure security, the solution components must use credentials generated by the system administrator independently in accordance with corporate security policies. When deploying the target component within a solution, the specified user and password are automatically created. When using a third-party service, you must provide the username and password created by the administrator in the said service.
- Secrets related to access to the solution installation repository.
--set pullSecret.kcs-pullsecret.username="user" \--set pullSecret.kcs-pullsecret.password="pass"If you plan to deploy the system using a Kaspersky registry, you must specify the credentials provided to you when you purchased Kaspersky Container Security. If you plan to use a private registry or a proxy registry, you must specify your registry credentials.
- HashiCorp Vault secrets storage settings:
- The
enabledflag enables the integration with the storage. Thevault.enabled = truevalue indicates that the integration with HashiCorp Vault is established; the values of environment variables are obtained from the storage. mountPathis the path to the directory with the secrets in the storage.roleis the role to be used for authentication in the storage.
- The
We recommend not to change the composition of the basic installation settings.
- If you are using an external PostgresSQL DBMS, please specify the following:
--set default.postgresql.external="true"
--set configmap.infraconfig.envs.postgres_host="
<IP address or FQDN of PostgresSQL DBMS>"--set configmap.infraconfig.envs.postgres_port="<
port for connection to PostgresSQL DBMS; by default, port 5432 is used>"--set configmap.infraconfig.envs.postgres_db_name="
name of the database created by the PostgresSQL DBMS administrator, api is used by default>"You should also ask the PostgreSQL DBMS administrator to clarify the requirements for the DBMS server certificates verification. Kaspersky Container Security supports the following verification modes:
--set configmap.infraconfig.envs.postgres_verify_level= "disable”– the server certificate is not verified.--set configmap.infraconfig.envs.postgres_verify_level= "require”– the certificate is required, the solution trusts any certificate without any further verification.--set configmap.infraconfig.envs.postgres_verify_level= "verify-ca”– the certificate is required, the solution checks that the certificate is issued by a trusted CA (Certificate authority).--set configmap.infraconfig.envs.postgres_verify_level= "verify-full”– the certificate is required, the solution verifies that the certificate is issued by a trusted CA and contains the correct IP address or FQDN.
If you need to verify the certificate of an external PostgresSQL DBMS, do the following:
- Upload the public part of the CA certificate to the folder with the Helm Chart package using the
certs/pgsql-ca.crtmask. - Specify the following verification parameter:
--set configmap.infraconfig.envs.postgres_root_ca_path="/etc/ssl/certs/pgsql-ca.crt". - Uncomment the
the secret.cert-pgsql-casection in the values.yaml configuration file to create the secret.
- Save the file with the installation settings and proceed to install the solution.
Certificate requirements
Kaspersky Container Security requires SSL certificates to operate. The method to create certificates when deploying the solution is specified in the values.yaml configuration file in the default.certSource section. You can choose one of the following methods to create certificates:
helm– the method when the solution automatically creates the necessary certificates (used by default).vault– the method to be used if you plan to integrate the solution with the HashiCorp Vault external storage. You need to generate all the required certificates and upload them to HashiCorp Vault.files– the method to create certificates manually, for example, using the corporate CA. Scripts for manually certificates creation are stored in the"certs/"folder of the Helm Chart package.The generated certificates must match the expected certificate name in the values.yaml file in the
secretsection. If necessary, you can uncomment and redefine the expected certificate file names in thesecretsection.
Certificates have the following requirements:
- Key length is 4096 bits RSA.
- The CN field specifies the pod of the component to which the certificate is related (
kcs-licenses,kcs-middleware,kcs-mw-grpc,kcs-panel,kcs-postgres,kcs-scanner,kcs-scanner-api,kcs-updates,kcs-memcached,kcs-ab,kcs-s3,kcs-clicklickhouse,kcs-eb).
Solution installation
Kaspersky Container Security components are supplied as images in the Kaspersky Container Security manufacturer registry and deployed as containers.
Installation of the Kaspersky Container Security platform consists of the following steps:
- Installation of the Basic business logic module and the Scanner components.
- First launch of the Management Console.
- Configuration of the agent groups and agent deployment on the controlled cluster nodes.
After installation, you should prepare the solution for operation:
- Configure integration with image registries.
- Configure integration with outputs.
- Configure security policies.
- Add container runtime profiles.
- Configure the File Threat Protection parameters.
- Configure integration with image signature validators.
- Configure integration with CI/CD.
- Configure user accounts, roles, and scopes.
- Configure integration with LDAP server.
Installing the basic business logic module and scanner
Before the solution installation, you must check the data integrity in the prepared Helm Chart package.
To check the data integrity:
- Download the archive with the prepared Helm Chart package and hash file and go to this directory.
- Run the command:
sha256sum -c kcs-2.0.0.tgz.shaThe data integrity is confirmed if the following message is displayed:
kcs-2.0.0.tgz: OK
Before starting the installation (including on AWS EKS or Microsoft Azure), pay attention to the storageClass and ingressClass settings in the default and ingress.kcs blocks of the configuration file. These settings are cluster relevant and, if necessary, are to be changed according to your infrastructure. For example, the following variant is used for Azure:
default: storageClass: azurefile networkPolicies: ingressControllerNamespaces: - app-routing-system
ingress: kcs: ingressClass: webapprouting.kubernetes.azure.com
To install the basic business logic module and the scanner of Kaspersky Container Security,
After preparing the configuration file, run the solution installation:
cd kcs/
helm upgrade --install kcs . \
--create-namespace \
--namespace kcs \
--values values.yaml \
--set default.domain="example.com" \
--set default.networkPolicies.ingressControllerNamespaces="{ingress-nginx}" \
--set secret.infracreds.envs.POSTGRES_USER="user" \
--set-string secret.infracreds.envs.POSTGRES_PASSWORD="pass" \
--set secret.infracreds.envs.MINIO_ROOT_USER="user" \
--set-string secret.infracreds.envs.MINIO_ROOT_PASSWORD="password" \
--set-string secret.infracreds.envs.CLICKHOUSE_ADMIN_PASSWORD="pass" \
--set secret.infracreds.envs.MCHD_USER="user" \
--set-string secret.infracreds.envs.MCHD_PASS="pass" \
--set pullSecret.kcs-pullsecret.username="user" \
--set-string pullSecret.kcs-pullsecret.password="pass"
After installation, the solution components are deployed.
Also, when installing the Kaspersky Container Security Middleware module and scanner, you can configure the secure transfer of passwords, tokens, and secrets. This is achieved using a HashiCorp Vault storage, which you can configure in the values.yaml file and deploy when the Helm Chart package is started.
After installation is complete, a record about the execution of the solution installation command remains in the command shell. You can open the command history file and delete this record, or prevent the command history from being logged in the command shell before installation.
The control panel will be available at the address specified in the envs subsection of the environment variables section. This allows you to create the ConfigMap object for the API_URL parameter:
http://${DOMAIN}
First launch of the Management console
To start the Kaspersky Container Security Management Console:
- In your browser, navigate to the address specified for the Management Console during the Server installation.
The authorization page opens.
- Enter your user name and password and click the Login button.
During the installation of the solution, the user name and password have the same value assigned—admin. You can change the user name and password after launching the Management Console.
After 3 unsuccessful password entry attempts, the user is temporarily blocked. The default block duration is 1 minute.
- Following the request, change the current password for the user account: enter a new password, confirm it, and click the Change button.
Passwords have the following requirements:
- The password must contain numerals, special characters, and uppercase and lowercase letters.
- The minimum password length is 6 characters, and the maximum password length is 72 characters.
The main page of the Management Console opens.
By default, the logged-in user session in the Management Console is 9 hours. In the Settings → Authentication section, you can set your own session duration from the minimum of 1 hour to the maximum of 168 hours. After this time expires, the session ends.
You can change the connection settings in the Settings → Authentication section.
Page top
Viewing and accepting the End User License Agreement
When you launch the Management Console in a browser for the first time, Kaspersky Container Security prompts you to read the End User License Agreement between you and Kaspersky. To continue working with the solution, confirm that you have fully read and accept the terms of the End User License Agreement for Kaspersky Container Security.
To confirm acceptance of the terms of the End User License Agreement,
at the bottom of the End User License Agreement window, click the Accept button.
The authorization page opens for launching the Management Console.
After installing a new version of the solution, accept the End User License Agreement again.
Page top
Checking solution functionality
After installing Kaspersky Container Security and starting the administration console, you can make sure that the solution is detecting security problems and protecting containerized objects.
To check the functionality of Kaspersky Container Security:
- Activate the solution using an activation code or key file.
- Configure integration with image registries. Integration with a single registry is sufficient to check the functionality.
- If necessary, configure the settings of the scanner policy that is created by default after installation of the solution.
- Add an image for scanning and make sure that the scan task is sent for processing.
- After the scan is complete, go to the page with detailed information about the image scan results.
Scanning an image and receiving valid results confirms that Kaspersky Container Security is operating correctly. After this, you can further configure the solution settings.
Agent deployment
You should install Agents on all nodes of the cluster that you want to protect.
A separate group of agents is installed on each cluster.
To deploy agents in the cluster:
- In the main menu, go to the Components → Agents section.
- In the work pane, click the Add agent group button.
- On the General tab:
- Fill in the fields in the form.
- Enter the group name. For convenient agent management, we recommend naming the group after cluster whose nodes the agents will be deployed on.
- If required, enter a description of the agent group.
- Select the orchestrator to use.
- Specify the namespace name.
- In the KCS registry section, enter the web address of the registry where the images used to install agents are located. To access the registry, you must specify the correct user name and password.
- Under Linked SIEM, select the SIEM system from the drop-down list.
To link an agent group in Kaspersky Container Security, you must create and configure at least one integration with a SIEM system.
One agent group can be linked with only one SIEM system.For each SIEM system integration, the drop-down list indicates the connection status – Success, Warning, or Error.
- Fill in the fields in the form.
- On the Node monitoring tab, use the Disable/Enable toggle to start monitoring and analyzing the status of the network, processes inside containers, and file threat protection for the following settings:
- Network connections monitoring. The status of network connections is monitored with traffic capture devices (network monitors) and eBPF modules. This process considers applicable runtime policies and container runtime profiles.
- Container processes monitoring. Container processes are monitored using eBPF programs based on applicable runtime policy rules and container runtime profile rules.
- File threat protection. To track anti-malware database updates, specify one of the following values:
- Anti-malware database update URL: the web address of the Kaspersky Container Security update service.
- Anti-malware database update proxy: the HTTP proxy for a cloud or local update server.
If the
kcs-updatescontainer is used to update anti-malware databases, the URL of the database update tool must be specified as follows:<domain>/kuu/updates(for example,https://kcs.company.com/kuu/updates).By default, File Threat Protection databases are updated from Kaspersky cloud servers.
- File operations. The solution tracks file operations using eBPF modules based on applicable runtime policies and container runtime profiles.
Regardless of the mode specified in the runtime policy, only the Audit mode is supported for file operations. If the Enforce mode is specified in the applicable runtime policy, file operations are performed in Audit mode.
Monitoring steps that are not needed can be disabled to avoid unnecessary load on the nodes.
- Click Save.
In the workspace, the Deployment data tab displays the following data necessary for deploying agents on the cluster:
- The automatically generated deployment token is the identifier that the agent uses to connect to the server. You can copy the token by clicking the copy icon (
 ) next to the Deployment token field.
 - Instruction for deploying agents on a cluster. You can copy the instruction from the Configuration field by clicking the copy icon (), or download the instruction as a file in .YAML format.
You can use this instruction to deploy agents on a cluster. For example:
kubectl apply -f <file> -n <namespace>Following the application of the instruction, the agent is deployed on all worker nodes of the cluster.
The solution automatically updates the agent deployment instruction if you change the following parameters:
- TLS certificates of the solution
- URL, user name, and password for downloading the kube-agent and node-agent images
- The linked SIEM system
- Settings in the Node monitoring section
You must copy or download the updated instruction in a .YAML file again, and then apply it by using the kubectl apply -f <file> -n <namespace> command. Otherwise, changes of these parameters are not applied to deployed agents.
Viewing and editing agent groups
The table under Components → Agents displays the created and deployed agent groups. The following information is provided for each of these groups:
- Agent group name
- Number of connected agents in the group
- Orchestrator
- Enabled node monitoring activities
- Linked SIEM
You can filter agent groups by connection status (All, Connected, Disconnected, Pending) using the buttons above the table.
By clicking on the deployment icon (![]() ), you can expand each agent group in the table to view the following agent details:
), you can expand each agent group in the table to view the following agent details:
- The name of the agent and its connection status.
- Version of the node where the agent is deployed (primary or worker)
- The name of the pod with which the agent is associated.
- Node monitoring actions (Container processes, Network connections, File Threat Protection, and File operations).
- SIEM status
- Date and time when the agent last connected
By clicking the agent name link, you can expand the sidebar to view agent status information.
To edit the agent group settings:
- Under Components → Agents, in the table with the list of agent groups, click the link in the agent group name.
- In the window that opens, edit the group settings.
- Click Save.
Configuring a proxy server
In version 2.0, Kaspersky Container Security can proxy requests from private corporate networks to the external environment. The settings for connection through a proxy server are configured using the following environment variables in the Helm Chart package, which is included in the solution distribution kit:
HTTP_PROXY– proxy server for HTTP requests.HTTPS_PROXY– proxy server for HTTPS requests.NO_PROXY– a variable that specifies domains or domain masks to be excluded from proxying.If
HTTP_PROXYorHTTPS_PROXY is used,the NO_PROXYvariable is automatically generated in the Helm Chart package, and all the components used by Kaspersky Container Security are indicated in this variable.You can change
the NO_PROXYvariable if you need to specify domains and masks for operation of Kaspersky Container Security in order to exclude them from proxying.SCANNER_PROXY– a specialized variable that specifies which proxy server receives requests from the scanner of the File Threat Protection component. These requests are used by Kaspersky servers to update databases.LICENSE_PROXY– a specialized variable that specifies the proxy server through which kcs-licenses module sends requests to Kaspersky servers to check and update information about the current license.
Kaspersky Container Security accesses the Kaspersky servers to get information about the license as well as updates for the anti-malware databases and vulnerabilities databases.
The Kaspersky registry can also be used to download images of the solution during its deployment and update, if you are not using a private registry or a proxy registry.
In the proxy server configuration, you must add masks for domain names of Kaspersky servers to the list of allowed ones. The following are the supported mask options: * .kaspersky.com, .kaspersky.com, * .kaspersky-labs.com, and .kaspersky-labs.com (the syntax that your proxy server supports is specified in the proxy server documentation). To access resources, you must open ports 80 and 443.
You can specify the port in the proxy server parameters using IP address or FQDN.
Special characters must be escaped.
The table below lists the Kaspersky Container Security components that can use environment variables, and also indicates the purpose of these environment variables.
Environment variables used by Kaspersky Container Security components
Component |
Environment variable |
Purpose |
|---|---|---|
kcs-ih |
|
Getting access to external image registries that are not available from the Kaspersky Container Security namespace. |
kcs-ih |
|
Update of the databases of the File Threat Protection scanner using Kaspersky update servers. |
kcs-middleware |
|
Getting access to external image registries that are not available from the Kaspersky namespace. |
kcs-scanner |
|
Update of the vulnerability scanner databases using Kaspersky update servers. |
kcs-licenses |
|
Check and update of information about the current license using Kaspersky license servers. |
You can configure the operation of agents using a proxy server, and the proxy server will pass requests to the Kaspersky Container Security installation address.
To configure the operation of agents using a proxy server:
- Under Components → Agents, in the table with the list of agent groups, click the link in the agent group name.
- In the window that opens, go to the Node monitoring tab and do the following:
- Ensure that the File Threat Protection component is enabled by using the Disable/Enable toggle switch.
- In the File Threat Protection section, specify the proxy server in Anti-malware database update proxy.
- Click Save.
- Click the Deployment data tab.
- Copy or download the updated agent deployment instruction in a .YAML file again, and then apply it by using the
kubectl apply -f <file> -n <namespace>command. - Configure the
HTTP_PROXY, HTTPS_PROXY, orNO_PROXYenvironment variables in the Deployment and DaemonSet objects of the agents.
Connecting to external data storage resources
In addition to the Kaspersky Container Security components included in the distribution kit, the solution can also work with the following external data storage resources:
- PostgreSQL database
- ClickHouse DBMS
- MinIO s3 compatible file storage
Configuration of settings for connection to external data storage resources is conducted by means of the values.yaml configuration file.
Creating a user for an external PostgreSQL database
For Kaspersky Container Security, you can use PostgreSQL databases included in the solution or your own PostgreSQL databases. To install an external PostgreSQL database that does not work with the Kaspersky Container Security schema, you must create a separate user. You can do this by installing the Helm Chart package with the schema parameters specified for the external PostgreSQL database.
To create a user with a custom schema for an external PostgreSQL database:
- Run the following command to create a separate namespace for the external PostgreSQL database:
kubectl create ns kcspgwhere
kcspgis the namespace for the external PostgreSQL database. - To deploy an external PostgreSQL database:
- Specify the parameters for deploying the external PostgreSQL database in the pg.yaml configuration file.
Parameters for deploying the external PostgreSQL database
The parameters specify the password of the database. You must then specify this password in the
infraconfigsection of the values.yaml configuration file, which is part of the Helm Chart package included in the distribution kit of the solution. - Run the following command:
kubectl apply -f pg.yaml -n kcspg
The name of this external database is formed as follows:
<pod_name>.<namespace name>.<service>.cluster.localFor example,
postgres.kcspg.svc.cluster.local - Specify the parameters for deploying the external PostgreSQL database in the pg.yaml configuration file.
- To deploy a Service object in a cluster:
- Specify the Service object deployment parameters in the svc.yaml configuration file.
- Run the following command:
kubectl apply -f svc.yaml -n kcspg
- To create a user, a schema, and a user-schema relation:
- Using the postgres element expanded at step 2b, log in to the pod.
- Start the psql interactive terminal:
psql -h localhost -U postgres -d api - Run the following commands:
CREATE ROLE kks LOGIN PASSWORD 'kks' NOINHERIT CREATEDB;CREATE SCHEMA kks AUTHORIZATION kks;GRANT USAGE ON SCHEMA kks TO PUBLIC;
- In the values.yaml configuration file, specify the necessary parameters to use an external PostgreSQL database.
Parameters in the values.yaml file
The values of the parameters specified in values.yaml must match the values of corresponding parameters in the pg.yaml and svc.yaml configuration files.
- Start a solution update.
Example of commands to create a user with an external PostgreSQL database
Using external ClickHouse DBMS
In addition to the ClickHouse DBMS, which is a component of Kaspersky Container Security and is included in the distribution kit, the solution can also work with the resources of the external ClickHouse DBMS. To do this, you must do the following:
- Create a database for Kaspersky Container Security, add and configure users, and define a disk policy if different disks are used for long-term and short-term data storage.
- Specify the required variables in the values.yaml configuration file for the external ClickHouse DBMS.
Kaspersky Container Security works with ClickHouse 22.6 or later.
Page top
Creating a database for Kaspersky Container Security
To create a database for Kaspersky Container Security,
In ClickHouse on your workstation, run the following command:
CREATE DATABASE IF NOT EXISTS kcs
where kcs is the name of the database for Kaspersky Container Security.
To configure the settings of the created database for Kaspersky Container Security:
- Add users and define their authorization method. To do this, you must do the following:
- Add the following users:
- a user with rights to read data received by the Kaspersky Container Security core (reader).
<roles><kcs_reader_role><grants><query>GRANT SELECT ON kcs.*</query></grants></kcs_reader_role> - a user with rights to write data from external agent requests (writer).
<roles><kcs_writer_role><grants><query>GRANT CREATE TABLE, INSERT, ALTER, UPDATE ON kcs.*</query><query>GRANT SELECT (source_ip, source_port, source_alias, dest_ip, dest_port, dest_alias, protocol, severity, action, event_time, count, type) ON kcs.node_agent_events</query></grants></kcs_writer_role>
- a user with rights to read data received by the Kaspersky Container Security core (reader).
- Specify the user authorization method: with a password or with a certificate.
Example of configuring users with password authentication
Example of configuring users with certificate authentication
- Add the following users:
- Specify disks for short-term and long-term data storage. When working with ClickHouse, Kaspersky Container Security can store large amounts of data with various retention periods. By default, the major part of events is stored for a maximum of 30 minutes, whereas information about incidents is stored for up to 90 days. Since event recording requires a considerable resources to ensure high recording speed and disk space provision, it is recommended to use different disks for short-term and long-term data storage.
Configuring the external ClickHouse DBMS settings
To configure the Kaspersky Container Security settings to use the external ClickHouse DBMS:
- In the values.yaml configuration file, specify that the solution uses the external ClickHouse DBMS:
default:
kcs-clickhouse:
external: true
- Specify the variables for using the external ClickHouse DBMS:
configmap:infraconfig:type: fromEnvsenvs:...<ariables for using the external ClickHouse DBMS>In this section you must specify the following variables:
EXT_CLICKHOUSE_PROTOCOLis the protocol for connection to the external ClickHouse DBMS.EXT_CLICKHOUSE_HOSTis the host for connection to the external ClickHouse DBMS.EXT_CLICKHOUSE_PORTis the port for connection to the external ClickHouse DBMS.EXT_CLICKHOUSE_DB_NAMEis the name of the database prepared for using with Kaspersky Container Security.EXT_CLICKHOUSE_COLD_STORAGE_NAMEis the name of the disk, where ClickHouse will long term store data about incidents.EXT_CLICKHOUSE_STORAGE_POLICY_NAMEis the name of the data storage policy according to which ClickHouse will transfer the data about incidents to the disk for long-term storage.If you use the same disk for short-term and long-term data storage,
the EXT_CLICKHOUSE_COLD_STORAGE_NAMEandEXT_CLICKHOUSE_STORAGE_POLICY_NAMEvalues are not specified.EXT_CLICKHOUSE_SSL_AUTHis the variable for SSL authorization of ClickHouse users. If thetruevalue is specified, authorization is performed without passwords using client certificates.If
TLS_INTERNALisfalse,EXT_CLICKHOUSE_SSL_AUTHmust also befalse.EXT_CLICKHOUSE_ROOT_CA_PATHis the path to the CA certificate, which is specified if the https protocol is used to connect to ClickHouse (EXT_CLICKHOUSE_PROTOCOL: https). You can specify the path in one of the following ways:- Put the ClickHouse CA certificate in the directory specified by the path. In this case, you must uncomment
the secret.cert-kcs-clickhouse-cablock. - Use Vault to store certificate data. In this case, you must uncomment the
cert-kcs-clickhouse-cablock in thevault.certificatesection.
- Put the ClickHouse CA certificate in the directory specified by the path. In this case, you must uncomment
- Specify values of secrets for using the external ClickHouse DBMS:
configmap:secret:infracreds:type: fromEnvsenvs:...<secrets for using the external ClickHouse DBMS>In this section you must specify the following:
EXT_CLICKHOUSE_WRITE_USERis the name of a user with permissions to write created for using with Kaspersky Container Security.CLICKHOUSE_WRITE_PASSWORDis the password of a user with permissions to write created for using with Kaspersky Container Security.EXT_CLICKHOUSE_READ_USERis the name of a user with read rights prepared for use with Kaspersky Container Security.CLICKHOUSE_READ_PASSWORDis the password of a user with permissions to read created for using with Kaspersky Container Security.CLICKHOUSE_READ_PASSWORDandCLICKHOUSE_WRITE_PASSWORDare not used ifEXT_CLICKHOUSE_SSL_AUTHis set totrue.
Usernames and passwords can also be specified using the Vault secret storage.
Example of configuring the external ClickHouse DBMS settings
Configuring the MinIO external storage settings
To configure the Kaspersky Container Security settings to use the external S3-compatible MinIO file storage:
- In the values.yaml configuration file, specify that the solution uses external MinIO file storage:
default:
kcs-s3:
external: true
- Specify variable values for using MinIO:
configmap:infraconfig:type: fromEnvsenvs:...variables for using the external MinIO file storage>In this section you must specify the following variables:
MINIO_HOSTis the host to connect to MinIO.MINIO_PORTis the port to connect to MinIO.MINIO_BUCKET_NAMEis the name of the section in MinIO allocated for Kaspersky Container Security data.MINIO_SSLis the variable for ssl connection to MinIO (including using the https protocol).If
TLS_INTERNALisfalse,MINIO_SSLmust also befalse.MINIO_ROOT_CA_PATHis the path to the CA certificate, which is specified if the https protocol is used to connect to MinIO (MINIO_SSL: true). You can specify the path in one of the following ways:- Put the MinIO CA certificate in the directory specified by the path. In this case, you must uncomment the
secret.cert-minio-cablock. - Use Vault to store certificate data. In this case, you must uncomment the
cert-minio-cablock in thevault.certificatesection.
- Put the MinIO CA certificate in the directory specified by the path. In this case, you must uncomment the
- Specify values of secrets for using the external MinIO file storage:
configmap:secret:infracreds:type: fromEnvsenvs:...<secrets for using the external MinIO file storage>In this section you must specify the following:
MINIO_ROOT_USERis the name of the MinIO user specified for Kaspersky Container Security.MINIO_ROOT_PASSWORDis the password of the MinIO user user specified for Kaspersky Container Security.
Usernames and passwords can also be specified using the Vault secret storage.
Example of configuring the MinIO external file storage settings
Installing private fixes
Due to specifics of various corporate networks where Kaspersky Container Security is deployed, sometimes there is a need to install private fixes for the solution. A private fix is one or several customized Docker images. Such private fixes are not published on the official Kaspersky image source, and are transferred directly to the customer for putting in the corporate image registry.
To put the received Docker image to an image registry:
- Save the archive with the Docker image in the selected directory.
- Run the
docker load -i <archive_name>command. - Run the
docker tag <hash name obtained in step 2> <customer registry/<component>:fix>command. - Run the
docker push <customer registry/<component>:fix>command. - Depending on the component for which the fix is installed, replace the image tag from
<component>:2.0to<customer registry/<component>:fix>in one of the following configuration files:- In the YAML file with instructions for agents deployment in the cluster if the fix is installed for agents (node-agent and kube-agent). For example,
node-agent:2.0must be changed to<customer registry/node-agent:fix>. - In the values.yaml file, if the fix is installed for the core components of the solution. For example,
kcs-ih:2.0must be changed to<customer registry/kcs-ih:fix>
- In the YAML file with instructions for agents deployment in the cluster if the fix is installed for agents (node-agent and kube-agent). For example,
Removing the solution
To uninstall the basic business logic module of Kaspersky Container Security, do one of the following:
- On a workstation with the Helm package manager installed, access to the target cluster and the namespace with Kaspersky Container Security installed, run the following command:
helm uninstall kcs-releaseThe Helm package manager does not delete PVC objects, PV objects or secrets. You should delete these manually using the following commands:
kubectl delete pvc<PVC name>kubectl delete secret<secret name>kubectl delete pv<PV name> - If Kaspersky Container Security is installed in a separate namespace, run the following command:
kubectl delete ns<namespace>
To delete a Kaspersky Container Security agent:
Run the following command on the cluster node with the agent deployed:
kubectl delete -f <file> -n kcs
where <file> is the name of the YAML configuration file used to deploy the agent.
If you delete all agents on the nodes of a cluster, we recommend that you remove the group that included these agents.
To delete a group of agents:
- In the main menu of Kaspersky Container Security, go to the Components → Agents section.
- In the line containing the name of the agents group that you want to delete, click the delete icon (
 ).
). - In the window that opens, confirm the action.
Updating the solution
You can upgrade Kaspersky Container Security 1.2.x to version 2.0.
Updating the solution does not result in data loss.
Before you start updating the solution, you need to do the following:
- Delete the StatefulSet object for ClickHouse:
kubectl delete statefulset/kcs-clickhouse -n kcs - Delete the PVC object for ClickHouse:
kubectl delete pvc/pvc-clickhouse-kcs-clickhouse-0 -n kcs - If your version of the solution uses the kcs-nats component, and it is managed by the StatefulSet controller, you must remove the PVCs of this controller from the cluster:
kubectl delete pvc/pvc-nats-js-kcs-nats-0 -n kcs
In all the commands listed above, you must replace -n kcs with the name of your namespace.
The rest of the update process is identical to the solution installation process.
The duration of the update depends on the volume of available databases and can take up to several hours. We recommend updating Kaspersky Container Security outside of active hours.
You can find information about the latest versions of the application on the Kaspersky website at https://www.kaspersky.com or contact our partners.
Page top
Solution interface
The Management Console is implemented through the web interface and consists of the following elements:
- Main menu — sections and subsections of the main menu give access to the key functionalities of the solution.
- Work pane — information and controls in the work pane depend on the section or subsection that you select in the main menu.
Main menu
In the web interface, the main menu of Kaspersky Container Security in the left pane consists of sections that correspond to the basic functions of the solution.
Resources
This section contains the monitoring results of all available Kaspersky Container Security resources: clusters, registries integrated with the solution, and CI/CD processes.
Investigation
This section contains the results of a Kaspersky Container Security investigation of events in containers and vulnerabilities detected in images.
Compliance
This section contains the results of checking the nodes and cluster resources for compliance with the requirements of the following standards: Kubernetes benchmarks and cluster security benchmarks.
Policies
This section allows you to configure security policies when operating Kaspersky Container Security.
The Risk acceptance subsection contains a list of all detected threats and vulnerabilities, the risk of which is accepted by the user. In this subsection, you can cancel a risk acceptance or set the period during which a risk is considered accepted.
Components
This section contains information about the state of solution components, that is, agents, scanners, and the kernel.
Administration
This section allows you to perform the following tasks:
- Under Access management, you can manage user access rights, define roles and access rights, and restrict access to resources and functional capabilities within specific scopes.
- Under Reports, you can view a list of generated reports on images, and download or delete reports.
- The Integrations subsection allows configuring integrations with public image registries, image signature validators, notifications, the LDAP server, SIEM systems, and HashiCorp Vault as well as getting integration status information.
- Under Events, you can view a list of application-generated events that may be useful when tracking processes and analyzing potential security threats.
Settings
This section allows you to perform the following tasks:
- Under Authentication, you can configure the settings for starting the Management Console for Kaspersky Container Security and manage the connection settings.
- The Licensing subsection allows you to manage licensing settings and view license functionality.
- The About subsection contains information about the version of the application and the latest update of the malware and vulnerabilities database. You can also view the terms and conditions of the Kaspersky Container Security License Agreement, Third party code information, and API reference as well as open the Kaspersky Container Security Help for a detailed description of the solution and its operation.
Block with the name of the current user
This block displays information about the user that logged in to the Kaspersky Container Security Management Console. Using the commands of the pop-up menu, you can go to the user profile page and exit the console.
Page top
Dashboard
On the main Kaspersky Container Security page, you can configure the dashboard to receive up-to-date analytical data on objects that are processed by the solution. This configuration is performed using filters that let you sort information by object and period.
Analytical data is displayed using widgets or specialized tools that show analytic information.
The Kaspersky Container Security dashboard opens when logging in to an account or when clicking the area containing the logo and name of the solution above the main menu.
Applying filters
Kaspersky Container Security provides the capability to configure the dashboard using the following filters:
- Filter by period:
- For the entire period
- For the year
- For the quarter
- For the month
- For the week
- For the past 24 hours
- For a customized period
For any period you select, the time count begins from the current day. By default, information is displayed for the week.
- Filter by resource:
- All images
- All images outside of clusters
- All images in clusters
- Images of a specific cluster
- CI/CD images
By default, information is displayed for all images.
Widgets on the dashboard
Kaspersky Container Security provides analytical data on the dashboard by using widgets that are organized into groups based on data type. The following widget groups and widgets are available in Kaspersky Container Security:
- Image compliance with security policy requirements. The solution displays the following information:
- Total number of images.
- Number of images with Compliant status.
- Number of images with Non-compliant status.
- Image risk assessment. The widget provides the following information on the statuses of objects:
- Total number of images.
- Number of images with the Critical status.
- Number of images with the High status.
- Number of images with the Medium status.
- Number of images with the Low status.
- Number of images with the Negligible status.
- Number of images with the Ok status.
- Top 10 object benchmarks that most frequently result in failure of cluster nodes to comply with the Kubernetes benchmarks:
- 10 cluster node benchmarks that most frequently result in non-compliance.
- Number of cluster nodes that failed the compliance check for the specified benchmark.
- Top 10 registries by number of images with the highest risk rating.
- Vulnerabilities
- Top 10 detected vulnerabilities with Critical, High or Medium severity status, and the number of images containing the specified vulnerability.
If a vulnerability contains an exploit, an exploit icon (
 ) is displayed next to the severity level. You can use the Containing Exploit toggle switch above the list of vulnerabilities to display all matching vulnerabilities or only vulnerabilities with exploits.
 - Top 10 images containing the maximum number of identified vulnerabilities with Critical and High severity status.
- Top 10 detected vulnerabilities with Critical, High or Medium severity status, and the number of images containing the specified vulnerability.
- Malware
- Top 10 most frequently detected types of malware and number of images containing this malware.
- Top 10 images with the maximum number of detected types of malware.
- Sensitive data:
- Top 10 detected types of sensitive data with Critical, High or Medium severity status and the number of images containing this sensitive data.
- Top 10 images containing the maximum amount of detected sensitive data with Critical and High severity status.
- Misconfigurations
- Top 10 detected misconfigurations with Critical, High or Medium severity status, and the number of images containing such sensitive data.
- Top 10 images with the maximum number of detected misconfigurations with Critical and High severity status.
Object lists that specify the severity level are sorted in descending order of severity (first items on the list are objects with the highest severity status).
User profile
To go to the user profile page:
- In the main menu, click on the block with the current user name.
- Select My Profile.
On the My Profile page, Kaspersky Container Security displays key information about the active user account. This information is divided into the following sections:
- General information—shows the user's name and their displayed user name, a contact email address, and a list of the roles assigned to the user.
In this section, you can also change the password to enter the Management Console by clicking the Change password button.
- API token—information about the token for connecting to and accessing the solution using API. The value of the valid API token is hidden by a mask and can be viewed by clicking the unmask icon (
 ) located to the right of the token. You can hide the token value with a mask by clicking the mask icon (
 ).
).In this section, you can also copy the value of the active token by using the Copy button. If necessary, you can also generate a new API token by clicking the Reissue token button.
- Permissions - all rights and permissions assigned to the user are displayed.
Specific ways to set up data display
Kaspersky Container Security interface provides the following ways to set up data displaying:
- Filtering: The filter fields are located above the data tables. Filter fields and ways to manage the filter depend on the specifics of the data to be displayed.
In some sections, you must click the filter icon to open the filter fields (
 ).
). - Sorting in ascending or descending order. In some sections, you can sort the list of data by the selected column by using the sort icon (
 ) in the column header.
 - Search: You can search the displayed data by using the Search field, located above the table and designated by the search icon (
 ).
). - Menu. In some tables, you can perform actions on the objects using the menu commands in the table rows. To open the menu for the selected object, click the menu icon (
 ) in the object row.
 - Select. In some tables, you can select items by clicking the check box (
 ). To unselect a check box, click the checkbox again.
 - Delete. You can delete objects in the solution by using the delete icon () or the Delete link that appears when selecting objects.
- Expand or collapse lists. In some tables, you can click the expand icon (
 ) to expand an object row and view its contents. To collapse table elements, click the collapse icon (
 ).
).
Licensing the solution
This section provides information about the general terms related to the licensing of Kaspersky Container Security.
About the End User License Agreement
The End User License Agreement is a binding agreement between you and AO Kaspersky Lab stipulating the terms on which you may use the application.
Please carefully read the terms of the End User License Agreement before you start using the application.
You can read the terms of the End User License Agreement during the Kaspersky Container Security installation.
By confirming that you agree with the text of the End User License Agreement during installation of the application, you signify your acceptance of the terms of the End User License Agreement. If you do not accept the terms of the End User License Agreement, you must cancel installation of the application and must not use the application.
Updates functionality (including providing anti-virus signature updates and codebase updates) might not be available in the software in the U.S. territory.
Page top
About the license
A license is a time-limited right to use Kaspersky Container Security as granted under the End User License Agreement.
A license includes the right to use the application in accordance with the terms of the End User License Agreement, and to receive technical support. The available functionality and application usage period depend on the type of license that was used to activate the application.
Kaspersky Container Security supports the following types of licenses:
- NFR (not for resale) is a free license for a specific period intended to familiarize the user with the application and to conduct test deployments.
- A Commercial license is a paid license that is provided when you purchase the solution.
Solution functionality depends on the type of license held. Kaspersky Container Security supports the following licenses:
- Standard license — allows for integration with image registries and platforms, security threat detection scans, risk assessment, and monitoring of object status.
- Enterprise license — in addition to the functionality of the standard license, this license also provides access to components used for the monitoring, control, and analysis of objects, misconfiguration detection and security threat protection.
When the license expires, the application continues to work but with limited functionality. For full Kaspersky Container Security functionality, you must purchase a commercial license or renew your commercial license.
Page top
About the license certificate
A license certificate is a document that you receive together with a key file or activation code.
The license certificate contains the following license information:
- License number or order number
- Information about the user who is granted the license
- Information about the application that can be activated under the provided license
- Restrictions on the number of licensing units (for example, devices on which the application can be used under the provided license)
- Start date of the license term
- License expiration date or license term
- License type
About the license key
A license key is a sequence of bits that you can use to activate and then use the application in accordance with the terms of the End User License Agreement. The license key is generated by Kaspersky experts.
You can add a license key to the application by either applying a key file or entering an activation code.
Kaspersky can block a license key over violations of the End User License Agreement. If the license key has been blocked, you have to add a different license key to continue using the application.
Page top
About the key file
A key file is a file with the KEY extension that you receive from Kaspersky. The purpose of a key file is to add a license key that activates the application.
You receive a key file at the email address that you provided when you purchased Kaspersky Container Security.
You do not need to connect to Kaspersky activation servers to activate the solution with a key file.
You can restore a key file if it has been accidentally deleted.
To restore a key file, do one of the following:
- Contact the license vendor.
- Get a key file from the Kaspersky website based on an available activation code.
About the activation code
An activation code is a unique sequence of 20 English letters and numbers. You must enter an activation code to add a license key that activates Kaspersky Container Security. Your activation code will be sent to the email address that you provided when you purchased Kaspersky Container Security.
To activate the application with an activation code, Internet access is required to connect to Kaspersky activation servers.
If you lose your activation code after activating the application, please contact the Kaspersky partner that you purchased the license from.
Page top
Application activation procedure
Application activation is the process of activating a license that grants the right to use Kaspersky Container Security until expiry.
You can activate the application by using the activation code or key file provided to you when you purchased the solution.
An activation code is used for activation when you install the solution in a public corporate network with Internet access. A key file is used for activation when you install Kaspersky Container Security in a public corporate network or private corporate network without Internet connectivity.
To activate the application with an activation code:
- In the Settings → Licensing section, click the Add license key button.
- In the window prompting you to select how you want to add the license key, select Enter activation code.
- In the Activation code field, enter the activation code and click Add.
The application is activated, and the license info page opens.
To activate the application with a key file:
- In the Settings → Licensing section, click the Add license key button.
- In the window prompting you to select how to add the license key, select Upload key file and click the Upload and add button.
- In the window that opens, select a file with the KEY extension and click Open.
The application is activated, and the license info page opens.
When activating the application, the new activation code or key file will replace the previously entered activation code or key file.
Page top
Viewing license information
You can view information about the active license in the Kaspersky Container Security web interface, in the Settings → Licensing section.
The license details page displays the following parameters:
- Licensing information. Kaspersky Container Security displays the following:
- Name of the Kaspersky partner that you purchased the license from.
- License term.
The term begins from the moment you purchase the license, not from the moment you activate the application.
- Customer information. This subsection provides data on the company that purchased the license:
- Company name
- Country where the company is located
- Email address of the customer representative
- Time period remaining until license expiration The solution displays the exact date and time of license expiration.
- Node count is the maximum number of nodes and number of active nodes allowed by the license.
- Image scans per month is the maximum number of image scans and completed scans allowed by the license. A month is considered to be the last 30 days (30 days from the current day).
- Functionality provided by the license. The solution displays a list of the available functionality under the license you purchased.
Renewing the license
When the license is approaching its expiration date, Kaspersky Container Security displays the following notifications:
- Notification that the license is expiring soon, indicating the time remaining until expiration. You receive this notification 30, 14, and 7 days before the license expires.
- Notification that the license is expiring and the solution will switch to limited functionality mode. This notification is sent on the day of license expiration.
In limited functionality mode, the functionality of Kaspersky Container Security is limited as follows:
- No new object scans are performed.
- The web interface does not display the new nodes added to the previously created clusters after the license expired.
- New clusters cannot be added for monitoring purposes.
- Vulnerabilities databases are not updated.
You can renew a license by applying a new activation code or by adding a new key file. To renew a license, contact the Kaspersky partner you purchased the license from.
Page top
Removing the license key
To remove the license key:
- In the Settings → Licensing section, click the Delete license key button.
- Confirm the removal by clicking the Delete button.
Data provisioning
This section contains information about the data that Kaspersky Container Security can save on the device and forward to Kaspersky during its operation.
If you use an activation code to activate Kaspersky Container Security, you agree to automatically provide information to Kaspersky as part of the regular license key status confirmation process. To confirm the license key status, Kaspersky Container Security periodically contacts Kaspersky activation servers and forwards the following information to Kaspersky:
- regional activation center identifier;
- title of the license to use the solution;
- checksum type and checksum of the license key;
- date and time when the license key was created;
- date and time when the solution license expires;
- solution license identifier;
- identifier of the information model applied when providing a license to use the solution;
- current license key status;
- license type used to activate the solution;
- unique device identifier;
- family name of the device operating system;
- solution installation identifier (PCID);
- identifier, localization, and full version of the solution;
- solution identifier obtained from the license;
- set of compatible software identifiers;
- solution rebrand identifier;
- list of legal agreements shown to the solution user;
- type and version of the legal agreement accepted by the user while using the solution.
In addition, by using the activation code, you agree to forward the following information to Kaspersky:
- activation code entered by the user to activate the solution;
- date and time on the user device;
- version, build number, update number, and revision of the device operating system;
- flag indicating that the user accepted the terms of the legal agreement while using the solution.
By using the activation code, you agree to automatically forward the data listed above to Kaspersky. If you do not agree to provide this information, use a key file to activate Kaspersky Container Security.
If you use Kaspersky update servers to download updates, you agree to automatically provide the following information:
- Identifier of the Kaspersky Container Security solution obtained from the license;
- full version of the solution;
- solution license identifier;
- type of valid license;
- solution installation identifier (PCID);
- Identifier of the solution update launch;
- processed web address.
Kaspersky can use all the obtained data to generate statistical information about the distribution and use of Kaspersky software.
Any received information is protected in accordance with legally established requirements and applicable Kaspersky regulations. Data is transmitted over encrypted communication channels.
More detailed information about the processing, storage, and destruction of information obtained during the use of the solution and transferred to Kaspersky is provided in the End User License Agreement and the Privacy Policy on the Kaspersky website.
Page top
Working with clusters
Kaspersky Container Security provides a tool for displaying and analyzing the connections between various objects within namespaces in clusters.
A cluster is a set of
that run applications placed in containers.By using clusters, you can perform bulk scans of images within those clusters. When doing so, the registries found in a cluster during a scan are automatically created. Kaspersky Container Security automatically reads and records the identification data used for accessing registries in a cluster (user name, password, token), and generates a link to this object. Registries are also assigned a name in the following format: <cluster name>_<registry name>. When working with cluster objects, the received identification data is used to access the registries.
Kaspersky Container Security displays a list of available clusters as a table under Resources → Clusters.
View the list of clusters
The Resources → Clusters section displays a table of clusters available in Kaspersky Container Security. The following data is provided for each cluster:
- Cluster name. Clicking the cluster name in the Cluster name column takes you to the page where you can view the namespaces in that cluster
- Number of namespaces included in the cluster
- Name of the orchestrator where the cluster is deployed
- Maximum risk rating. The maximum risk rating assigned to the cluster is based on the risk ratings for the images in that cluster
You can use sorting to rearrange the data in the table as follows:
- By cluster name: you can arrange clusters alphabetically in the Cluster name column in ascending (A to Z) or descending (Z to A) order.
- By number of namespaces - You can sort clusters in descending or ascending order of the number of namespaces in the Namespaces column.
- By orchestrator name: by sorting on the Orchestrator column, you can group clusters by the orchestrator where they are deployed.
- By maximum risk rating: you can arrange clusters in descending or ascending order of the maximum risk rating, displayed in the Max risk rating column.
You can view the namespaces in the cluster and the links between these by clicking View in the View on graph column. Kaspersky Container Security opens the namespace graph for the selected cluster.
Cluster resources can be scanned and visually represented only if deployed agents are available.
Namespaces in the cluster
To view the namespaces included in the cluster:
- Go to the Table tab under Resources → Clusters.
- In the Cluster name column of the table with the list of clusters, click the cluster name.
Kaspersky Container Security opens a page displaying a table with a list of namespaces in the selected cluster.
The following information is indicated for each namespace in the cluster:
- Namespace name. Clicking the link in the name of the namespace in the Namespace column takes you to the page where you can view the pods in that namespace.
- The number of containers in all pods in the selected namespace.
- Number of scanned images. The Scanned images column displays this information in X/Y format, for example: 1/8. The first value (X) represents the number of images scanned, and the second value (Y) represents the total number of images in the namespace.
- Number of images with the Queued status. The Scans in queue column displays the number of images in the jobs that are queued and waiting to be scanned.
- Number of images with the Error status. The Failed scans column displays the number of images whose scanning completed with an error.
- The maximum risk rating assigned to images in the namespace.
You can use sorting to rearrange the data in the table as follows:
- By namespace name: you can arrange objects alphabetically in the Namespace column in ascending (A to Z) or descending (from Z to A) order.
- In the ascending or descending order of the number of containers in the pods in the selected namespace.
- In the ascending or descending order of the number of images with the Queued status.
- In the ascending or descending order of the number of images with the Error status.
- By maximum risk rating: you can arrange namespaces in descending or ascending order of the maximum risk rating, displayed in the Max risk rating column.
You can view the objects in the namespace by clicking View in the View on graph column. Kaspersky Container Security opens the application graph of the selected namespace.
To view the namespaces in a cluster and the relationships between them,
go to the Graph view tab under Resources → Clusters.
Page top
Pods in the cluster
To view a list of pods in a namespace:
- Under Resources → Clusters, open the table with a list of namespaces in the cluster.
- In the Namespace column, click namespace name.
Kaspersky Container Security opens a page that displays a table with a list of pods in the selected cluster.
The following is displayed for each pod in the selected namespace:
- Pod name.
- List of container names associated with the pod
- Name of the image the container was deployed from. By clicking the link in the image name, you can go to the page with the results of this image scanning under Resources → Registries.
- Status of compliance with security policy requirements
- Risk rating. Kaspersky Container Security displays the risk rating for the image specified in the Image column
- Number of security issues (vulnerabilities, malware, sensitive data, and misconfigurations) detected For vulnerabilities, the solution separately lists the number of security issues broken down by severity.
- Date and time of the last object scan
You can use sorting to rearrange the data in the table as follows:
- By pod name, container name, or image name: you can arrange objects in the Pod, Container and Image columns in ascending or descending alphabetical order.
- For compliance or non-compliance with security policies. Kaspersky Container Security can group objects in line with the Compliant and Non-compliant statuses.
- By risk rating: you can arrange objects according to the severity level.
- By date and time: Kaspersky Container Security can display objects starting with the earliest or latest by scan date and time.
Visualization of cluster resources
Kaspersky Container Security visualizes objects within one or more clusters, as well as the links between objects in a cluster and resources out of cluster or scope. Depending on the level of the cluster resources visualization, it displays the following:
- Namespace graph: represents the cluster and the namespaces in it.
- Application graph of the selected cluster: shows the cluster, its namespaces, and the applications of the expanded namespaces. The application graph can shown in maximum detail by expanding objects to the lowest level.
When working with cluster resource graphs, one must take into account the following specifics of object display:
- The number on the upper right of the object icon shows the number of lower-level objects within the specified object (child objects).
- Objects on the graph may be highlighted in color. The object is identified if it meets the parameters established regarding risk assessment and compliance with security policies.
- Objects on the graph are grouped according to the following rules:
- Highlighted objects are grouped together if their number is more than five.
- Unhighlighted objects are grouped together if their number is more than two.
- Objects on the graph can be hidden if needed.
A visual representation of cluster resources is generated if active agents exist for this cluster.
Page top
Cluster resources on a graph
Kaspersky Container Security scans and displays the resources of the cluster and the links between them. This scan is performed for all clusters with active agents.
Cluster resources are entities or objects that are stored in the orchestrator and used to represent the status of the cluster. With their help, you can get information about running containerized applications, where they are started (nodes), and the resources available to them. Cluster objects also define strategies for managing running applications (for example, restarting or updating).
In the interface of Kaspersky Container Security, the highest-level object (parent object) is the cluster. It includes namespaces in which applications are started. Applications, in turn, include pods and other objects.
A cluster is a set of physical or virtual machines (nodes) that run containerized applications. The following types of nodes are distinguished in Kubernetes:
- A master node implements API objects and is used to manage the cluster and its resources.
- A worker node is used to run the workload. A cluster includes one or more worker nodes.
Kaspersky Container Security displays the cluster as a graph using the cluster icon ( ).
).
Depending on the level of detail you want for the cluster resource display, Kaspersky Container Security displays the graph as a graph of namespaces or a graph of applications. The table below shows all objects that may be included in the cluster and are displayed on the graph.
Objects within the cluster
Object |
Icon |
Description |
|---|---|---|
Namespace |
|
A mechanism for isolating resources within a cluster. A namespace includes various objects necessary for an individual workspace (for example, Deployment, Service). Kaspersky Container Security can group namespaces on the graph and display such a group of objects with the number of entities in it indicated (for example, |
Pod |
|
An entity that includes one or more containers with shared network resources, as well as a set of rules for running containers included in the pod. |
Application |
|
A group of objects in the cluster that is conventionally considered as a single entity in Kaspersky Container Security. The application is formed from the following objects:
Individual pods do not form an application. They continue to function as part of a namespace and are displayed individually on the graph. |
Deployment |
|
An object that includes a set of rules that describe pods and the running of applications in them, the number of pod replicas, and the order in which they are replaced if their characteristics change. |
DaemonSet |
|
An object responsible for creating and running pods from the same image on all nodes of the cluster. In Kaspersky Container Security, a DaemonSet is used to deploy an agent (node-agent) on each node of the cluster to receive information and manage processes in pods. |
Ingress |
|
An object that provides external access to services in the cluster, usually over HTTP and HTTPS. |
ReplicaSet |
|
An object that manages pod replication. ReplicaSet maintains a certain number of identical pods. |
Secret |
|
An object for storing sensitive data (for example, a password, token, or key). Secret helps avoid storing such data in the application code. The Secret is created separately from the pods that use such objects to store sensitive data. This reduces the risk of secrets being revealed when creating, viewing, or editing pods. |
Service |
|
An object describing the network capabilities of applications in pods. Service combines pods into logical groups, forwards traffic to them, and balances the load among them. |
Endpoints |
|
A list of network endpoints that the Service object queries to determine which pods to direct traffic to. |
StatefulSet |
|
A workload object used for managing applications by keeping track of and saving their state. StatefulSet is used in applications that need:
|
ConfigMap |
|
An object for storing non-sensitive data in key-value pairs. ConfigMap is used in pods as an environment variable, command line argument, or configuration file within a volume. Using ConfigMap lets you separate environment-specific configuration settings from images in a container for better portability of your applications. |
Persistent volume (PV) |
|
A dedicated persistent resource (volume) for storing pod data in the cluster. PV is independent of pods, stores information contained in it and, when implementing multiple access, allows other pods to use this information. |
Persistent volume claim (PVC) |
|
A user-generated request to store data with persistent volume (PV) requirements. For example, a PVC can specify the size of the persistent volume required and the mode of access to data in it (for example, single read access or multiple read/write access). |


Namespace graph
To view the namespace graph for the selected cluster,
in the table with the list of clusters, click View.
Kaspersky Container Security displays the cluster with its namespaces.
Kaspersky Container Security can display information about the cluster and namespaces on the namespace graph in the sidebar or in a table. The sidebar provides a brief summary of the object. The table shows a more detailed security scan status for objects in the cluster. The data is partially duplicated between the sidebar and the table.
Page top
Viewing details about graph objects in the sidebar
To view cluster information in the sidebar:
- Click the cluster () or namespace (
 ) icon on the namespace graph.
 - In the menu that opens, select Details.
The details sidebar displays the following object-specific data:
- For a cluster:
- Cluster name.
- Number of namespaces in the cluster.
- Cluster orchestration platform.
- Maximum risk rating assigned to the objects in the cluster.
- The security policy compliance status is Compliant or Not Compliant.
- For a namespace:
- Namespace name.
- Number of containers and applications in the namespace.
- Number of scanned images in the namespace
- Number of processed and failed scan tasks.
- Maximum risk rating assigned to the objects in the cluster
- The security policy compliance status is Compliant or Not Compliant.
- Number of security issues across all risk types. For vulnerabilities, the number of security issues is specified, broken down by risk severity.
- For a cluster:
Viewing details about graph objects in the table
To view information about the objects on a graph in a table:
- Click one of the following icons in the namespace graph:
- Cluster ()
- Namespace group (
 )
) - Namespace ()
- Cluster (
- In the menu that opens, select Open in table.
Kaspersky Container Security opens a table with information about the selected object or group of objects at the bottom of the work pane under the graph. Depending on the object, Kaspersky Container Security displays the following container details in the table that opens:
- For a cluster or a namespace group:
- List of namespaces in the cluster.
- Number of containers in each namespace.
- Number of scanned images, scan jobs in queue, and failed scan jobs for each namespace.
- Maximum risk rating assigned to the objects in the cluster
- The security policy compliance status is Compliant or Not Compliant.
- For the selected namespace:
- List of applications in this namespace and their types.
- Number of pods and containers in each application.
- Maximum risk rating assigned to the objects in the namespace.
- The security policy compliance status is Compliant or Not Compliant.
- For a cluster or a namespace group:
You can also use the table to configure the way objects are displayed on the graph to hide or show namespaces.
Page top
Application graph
To view the application graph for the selected cluster:
- Go to Resources → Clusters.
- Do one of the following:
- On the Table view tab, open the table with the list of namespaces and click View.
- On the Graph view tab, open the namespace graph and do one of the following:
- Double-click to expand the namespace to applications.
- Click the namespace icon () to open a menu and select Expand on graph.
Kaspersky Container Security displays all applications in the selected namespace.
Each application can be expanded down to the pod level. You can view detailed information about the following objects on the application graph of the selected cluster:
Viewing information about application
To open information about an application in the application graph,
Click the application icon ( ) to open a menu and select Details.
Kaspersky Container Security opens a side panel with detailed information about the application.
The solution displays the following information about the application:
- The object type and application type (for example, Application: Deployment).
- Application name.
- Maximum risk rating. The solution assigns a risk rating to the application according to the highest severity level of all the objects within that application.
- The security policy compliance status is Compliant or Not Compliant.
- The Containers tab contains the following information about the containers in the selected pod:
- Name of the container.
- Name of the image the container was deployed from.
- The security policy compliance status is Compliant or Not Compliant.
- Maximum risk rating assigned to containers in the pod.
- Number of security issues across all risk types. For vulnerabilities, the number of security issues is specified, broken down by risk severity.
- Date and time of the last scan of the image from which the container was deployed.
- The Policies tab displays information about assurance policies and runtime policies that are applied to the application.
The following information is provided in the Assurance policies section:
- Policy application status (Passed/Failed).
- Policy name.
- Indication of existing security threats. In terms of the applied policy, the scan results can be displayed as follows:
- Scan was performed, security threats were identified (
 ).
). - Scan was performed, no security threats were detected (
 ).
). - No scan was performed for this type of security threat (
 ).
).
- Scan was performed, security threats were identified (
The Runtime policies section contains the following information:
- Policy name.
- Policy application mode (Audit/Enforce).
By clicking the link on the name of a policy in the Policies tab, you can view its detailed description. The sidebar displays the following information:
- Policy type and name.
- Description of the policy (if any).
- Author of the policy.
- Mode (for runtime policy).
- List of predefined scopes.
- Actions that are performed when the policy is applied (for an assurance policy).
- Set benchmarks and their parameters.
You can edit the settings of an assurance policy by clicking the Edit policy button.
To view the detailed description of policies, you must have rights to view them. Policy management rights are required to make changes to policy settings.
Viewing information about objects in the application
To open information about objects on the applications graph:
- On the applications graph, select the application about whose objects you want to obtain information and do one of the following:
- Double-click the application to expand it to its constituent objects.
- Click the application icon () to open a menu and select Expand on graph.
- Select the object of interest and double-click to expand its information in the side panel.
Kaspersky Container Security opens a side panel with detailed information about the selected object.
Depending on the type of the object, additional information about the selected entity is displayed. The table below describes the set of information that the solution displays for various objects in the application.
Information about objects in the application
Object |
Displayed object data |
|---|---|
Deployment |
|
DaemonSet |
|
Ingress |
|
Secret |
|
ReplicaSet |
|
Service |
|
Endpoint |
|
StatefulSet |
|
ConfigMap |
|
Persistent volume |
|
Persistent volume claim |
|
You can generate and download a file with the description of the object current state in the .YAML format for all objects by using the Download .yaml button.
Page top
Viewing information about pod
To open the pod information,
on the graph, select the pod about which you want to receive information, and double-click to expand its information in the side panel.
Kaspersky Container Security displays pods on all types of graphs: namespace graphs and application graphs.
The solution opens a side panel with detailed information about the pod.
Kaspersky Container Security displays the following information about the pod:
- Object type.
- Maximum risk score among pod images.
- The security policy compliance status is Compliant or Not Compliant.
- Pod name.
- The General tab contains the following information about the object:
- Date and time of creation.
- Labels.
- Pod running status.
- Pod lifetime—the period between the date and time of viewing the pod information and the date and time of its creation.
- List of ports used by pod containers in the following format: <
"port name" port protocol>. For example,"dns" UDP 53. - Available system functions of the pod.
- The name of the PV used by the pod.
- The name of the PVC used.
- The name of the application, namespace and cluster within which the pod is located.
Also in this tab, you can click Download *.yaml to generate and download a file with a description of the pod.
- The Containers tab contains the following information on containers within the pod:
- Name of the container.
- Name of the image the container was deployed from.
- Compliance status of the deployed image: Compliant or Non-compliant.
- Maximum risk rating of the deployed image.
- Number of security issues across all risk types. For vulnerabilities, the number of security issues is specified, broken down by risk severity.
- Date and time of the last scan of the image from which the container was deployed.
- List of ports used by pod containers in the following format: <
"port name" port protocol>. - Additional properties of the container—it is an .
- The Policies tab displays information about assurance policies and runtime policies applied to the pod. Information about policies applied to the pod is presented in two sections (Assurance policies and Runtime policies), similarly to the information displayed about the applicable policies when viewing information about the application on the graph.
To view the detailed description of policies, you must have rights to view them. Policy management rights are required to make changes to policy settings.
Viewing details about application graph objects in the table
To view information about the objects on the application graph as a table:
- Do one of the following:
- Click the namespace icon () that indicates the number of applications within the namespace on the graph.
- Click the icon of the application group within the namespace (
 ).
).
- Click the namespace icon (
- In the menu that opens, select Open in table.
The solution opens a table with information about applications in the lower part of the workspace below the graph. Kaspersky Container Security displays the following information:
- The list of applications in this namespace and their types (types of parent objects).
- Number of pods and containers in each application.
- Maximum risk rating assigned to the objects in the namespace.
- The security policy compliance status is Compliant or Not Compliant.
Highlighting objects on the graph
To highlight objects on the graph:
- Click the Highlight objects button above the graph.
Kaspersky Container Security opens a sidebar where you can configure the settings for highlighting objects.
- Select the check boxes to specify values for the following settings:
- Risk rating. You can select one or several risk severity levels (Critical, High, or Medium). If the check boxes are not selected, objects on the graph are not highlighted.
The check boxes for the Critical and High values are selected by default.
- Compliance If the Non-compliant check box is selected, Kaspersky Container Security highlights objects that do not comply with applicable security policies. If this check box is not selected, objects on the graph will not be highlighted, regardless of their compliance or non-compliance with standards.
Non-compliant is specified by default.
- Risk rating. You can select one or several risk severity levels (Critical, High, or Medium). If the check boxes are not selected, objects on the graph are not highlighted.
- Click Apply.
Kaspersky Container Security updates the graph and displays the objects according to your settings.
For each user, the solution saves the highlighting settings that the user has specified and applies them when displaying cluster objects that this user opens later.
Configuring visibility of objects on the graph
By default, Kaspersky Container Security displays all namespaces in the cluster on the graph. If necessary, you can hide namespaces if these namespaces and objects in them are not relevant to you for a specific analytical task.
You can configure graph object visibility:
- On the graph
- In the table with information about the child object
To hide a namespace with the help of the graph:
- Click the object icon on the graph.
- In the menu that opens, select Hide.
Kaspersky Container Security updates the graph and hides the object.
You can restore object visibility with the help of the table with detailed information about the parent object or group of objects.
To configure namespace visibility with the help of the table:
- In the table with namespaces as part of the column, select one or more objects for which you want to change the visibility settings.
- Use the buttons above the table to do one of the following:
- To display the object on the graph, click Show on graph.
- To hide the object on the graph, click Hide on graph.
Kaspersky Container Security updates the graph and displays the objects according to your settings. The Data display column indicates whether the object is shown or hidden on the graph.
Network connections on the graph
Kaspersky Container Security displays network interactions between objects on the graph, and also provides information about network connections between cluster resources.
To view network connections in the cluster:
- In the Resources → Clusters section, go to the Graph view tab.
- Click the Network connections button above the graph area.
The solution opens the sidebar with the types of network connections available for display.
- By selecting check boxes, select one or more network connections display options. You can select the following display options:
- Show Audit-mode connections . This displays network connections that were detected in accordance with the applied runtime policies in Audit mode.
- Show Enforce-mode connections. This displays network connection attempts that were blocked in accordance with the applied runtime policies in Enforce mode.
- Show all the rest connections. This displays network connections that were not covered by the applied runtime policies in Audit and Enforce modes.
- Click Apply.
The graph is reloaded and the selected network connections are displayed.
Principles of displaying network processes
The following principles apply to displaying of network connections on the graph in Kaspersky Container Security:
- The solution displays connections as edges between two objects (groups of objects within a cluster), or between an object (group of objects) and resources outside the cluster. An arrow on the graph points from the sender object to the recipient object. If the same types of network connections (for example, Audit-mode connections) occurs between a pair of objects that are linked by a network connection and the traffic between the object goes both ways, the solution represents this activity with a bidirectional arrow.
- If the recipient object is outside the relevant cluster, infrastructure or the scope assigned to the user, the solution indicates it as Resources out of cluster or scope.
- The graph displays network connections to a group of namespaces or applications if inbound or outbound traffic is detected involving at least one object inside such a group. When you expand a group to its constituent objects, the connection is displayed to the specific resource.
- If multiple network connections go from one object to another, the solution takes the priority of network connections when displaying them. Enforce-mode connections have the highest priority, whereas other connections have the lowest priority.
The solution displays different types of network connections as follows:
- Enforce-mode connection on the graph is represented by a dotted red line (
 ).
). - Audit-mode connection on the graph is represented by a solid red line with an arrow (
 ).
). - Other connections on the graph are represented by a solid black line with an arrow (
 ).
). - Two-way network connections are represented on the graph as a line corresponding to one of the activity types, with arrows on both ends (
 ).
). - If you hover over a network connection line on the graph, it is highlighted and changes color (
 ).
).
Viewing information about network connections
Kaspersky Container Security can provide brief and detailed information about network connections.
To view brief information about a network connection:
Hover over the network connection of interest.
The solution will display a tooltip with the number of non-unique connections for each network connection type (for connections in Audit and Enforce modes and other connections).
To view detailed information about a network connection:
Click the connection of interest.
Kaspersky Container Security opens the sidebar with information about network connections for the selected connection.
The sidebar displays information about network connections for the 15 minutes before the sidebar was opened. Information about network connections is provided in form of tables in the tabs Audit-mode connections, Enforce-mode connections, Other connections. The number of connections is indicated next to tab names.
The tables have the same structure and contain the following information:
- The Source column contains the name of the pod that is the sender of the network traffic and the IP address of the pod in the
<pod IP address:outbound traffic port>format. You can click the link in the pod name to open a detailed description of the pod. - The Protocol column indicates the pod interaction protocol.
- The Destination column contains the name of the pod that is the recipient of the network traffic and the IP address of the pod in the
<pod IP address:inbound traffic port>format. You can click the link in the pod name to open a detailed description of the pod. - The Number of connections column displays the total number of non-unique connections between the sender and the recipient of the traffic.
- The Last connection column displays the date and time of the last non-unique connection between the sender and the recipient of the traffic.
If the sender object or the recipient object is outside the relevant cluster, the Source or Destination columns display the domain name and IP address of such an object respectively (if the solution can obtain this information).
Displaying the graph subject to applicable scope
When displaying cluster resources on the graph, the scope assigned to the user role is taken into account. In this case, the following must be considered:
- If the default scope is assigned to the user role, the graph displays all cluster resources.
- If a scope with access to a specific image within the namespace is assigned to the user role, the graph displays the entire namespace (all entities in the namespace are displayed).
- If a scope that does not have access to specific namespaces is assigned to the user role, such namespaces are not displayed on the graph.
If there are no namespaces to display for the selected cluster in view of the assigned scope, the solution informs you that is no data to display.
Working with images from registers
The Resources → Registries section contains a list of image repositories scanned by Kaspersky Container Security and the image scan results. The list includes images from registries integrated with Kaspersky Container Security. You can add images to the list automatically or manually.
The list of images is empty until you configure integration with registries and settings for pulling and scanning images for the registry in the Administration section.
The list of images is displayed as a table, the images are grouped by repositories.
You can perform the following actions in the Resources → Registries section:
- Search for images by name or checksum.
A search is conducted only in the selected active image registry. If the sought image is absent from the selected registry but is part of a different registry, the search gives no results.
- Filter the list to display images that match the specified criteria:
- Images only from the specified registries;
- Images that comply with or fail to comply with benchmarks;
- Images scanned during a specified period of time;
- Images for which the specified risks are identified.
- Start rescanning of the specified images (the Rescan button is displayed above the table after you select one or more images).
- Generate reports on selected images (the Create report button is displayed above the table after you select one or more images).
- Add images to the list and remove images from the list.
- View detailed information about the image scanning results.
Adding and removing images
Images from the registries integrated with Kaspersky Container Security can be added to the list of images automatically, in line with the configured settings for pulling and scanning images for each registry. You can also add images to the list of images from registries manually. New images are queued for scanning.
To manually add images to the list:
- In the Resources → Registries section, click the Add images button above the table.
You cannot add images to an image registry that is created at the request of the external Harbor registry.
- In the displayed window, select a registry from the Registry drop-down list.
- In the Search field, enter the name or part of the name of the repository or image and click the Search button.
- Under Repositories, select a repository.
- Under Image tags, select images using check boxes.
You can select images from several repositories.
- Click the Add images button.
To optimize the load on image registries, a list of images in the connected registries is generated every 10 minutes. After a new image appears in the registry, its appearance in the Kaspersky Container Security interface may be delayed by the specified period.
To remove images from the list:
- In the Resources → Registries section, do one of the following:
- Select one or more images that you want to remove from the list and start removal using the Delete link located above the table.
- In the list, select the repository of images you want to delete, open the action menu on the row with the repository name, and select Delete repository.
- In the window that opens, confirm the deletion.
Viewing image scanning results from registries
Summary information about the scan results of all images in the repository and each specific image is displayed in the list of images within repositories in the Resources → Registries section.
Click the image name link to open a page with detailed information on image scanning results.
The tabs at the top of the window contain the following information:
- The Risk tab provides a summary of the scanning results. If threats are detected during scanning, recommended actions to protect the image are available at the bottom of the page. Click the Rescan image button to repeat scanning of the image.
- The Vulnerabilities tab shows the vulnerabilities detected in the image. Clicking the link in the name of the vulnerability can open a detailed description of the vulnerability and find out if it has an .
Kaspersky Container Security receives a description of vulnerabilities from the connected vulnerabilities database. The description is provided in the language of the vulnerabilities database. For example, a description of vulnerabilities from the NVD is displayed in English.
The classification of vulnerabilities in the solution matches the classification used in the connected vulnerabilities database. - The Layers tab displays layers used in the image with the specification of identified vulnerabilities. Click the layer name link to open a detailed description of the identified vulnerabilities.
- The Resources tab demonstrates resources (components) with the specification of identified vulnerabilities. Click the resource name link to open a detailed description of the identified vulnerabilities.
- Malware Scan lists malware that the scan detected in the image. Click the malware name link to open a detailed description.
- The Sensitive data tab shows sensitive data (secrets) found in the image such as passwords, access keys, or tokens.
- The Misconfigurations tab displays detected image misconfigurations that constitute a threat. Click the misconfiguration name link to open a detailed description.
- The Information tab provides the basic information about the image and image history.
- The Hash scan history displays the latest scan results for each version of the image. The results are updated if the same version of an image is scanned, or they are added in a separate row of the table if a different version of the image is scanned.
The following information is displayed for each image:
- Status of compliance with security policy requirements
- Risk rating with an indication of the risk severity level.
- Date and time of the last scan.
- The number of objects containing vulnerabilities, malware, sensitive data, and misconfigurations in the image. For vulnerabilities, the number of objects is indicated separately for each identified risk severity level.
- The results of image scanning using the appropriate security policies within the current scopes.
If an image is included in the registry of images created during integration with the solution by Harbor request, the solution indicates this and marks the image with the Harbor icon ( ).
).
By clicking the Create report button, you can generate a detailed report on images. You can also initiate a rescanning of the image by clicking the Rescan button.
Rescanning is not available for images received by Kaspersky Container Security from the image registry created during integration with the solution by Harbor request.
You can accept each identified risk.
Page top
Detailed information about detected vulnerabilities
The list of vulnerabilities detected during image scans is presented as a table on the Vulnerabilities tab in the image scan results window. For each vulnerability, the following information is provided:
- Vulnerability entry identifier The identifier is given in the CVE-YYYY-X... format, where:
- CVE is a prefix that indicates that the vulnerability is included in the database of known vulnerabilities and security defects.
- YYYY is the year when the vulnerability was reported.
- X... is the number assigned to the vulnerability by authorized bodies.
- The vulnerability's severity level based on its risk rating.
If a vulnerability contains an exploit, an exploit icon (
) is displayed next to the severity level. - Installed containerized resource in which the vulnerability was detected.
- Whether a fix for the vulnerability is available from the vendor. The solution shows the version number that has the fix, or indicates that no fix is available.
You can accept the risk of the vulnerability by clicking the Accept button in the Risk acceptance column.
To accept risks, risk management rights are required.
To view detailed information about a detected vulnerability:
- Click the link with the vulnerability record ID in one of the following sections:
- On the Vulnerabilities tab in the image scan results window.
- In the Vulnerabilities block on the dashboard.
- In the table with the complete list of vulnerabilities in the Investigation → Vulnerabilities section.
- This opens the sidebar with the following information about the detected vulnerability:
- Vulnerability entry identifier
- Description of the vulnerability from the vulnerability database. The description is provided in the language of the vulnerabilities database. For example, descriptions of vulnerabilities from the NVD are displayed in English.
- The General information tab displays the following:
- The vulnerability's severity level based on its risk rating.
- Installed resource in which the vulnerability was detected.
- Vulnerability severity score based on the open standard in the , , and vulnerability databases, as well as the final consolidated vulnerability severity score.
- The Artifacts tab displays detailed information on artifacts for images from registries and the runtime or CI/CD objects and indicates how many artifacts there are.
The block for an image from a registry or runtime shows the following information:
- Image object type and the name of the image. If autoprofiles were created based on the checksum of this image, an autoprofile icon (
 ) appears next to the image name.
By clicking on the image name, you can go to a page containing detailed information about the image scan results.
To view detailed information, you need the rights to view the image scan results.
- Operating system of the image.
- Compliance status of the image: Compliant or Not-compliant.
- Risk rating.
- Date and time of the last time the image was scanned
- Date and time when the vulnerability was first detected in the image.
The block for an object from the CI/CD pipeline shows the following information:
- Object type, which corresponds to the artifact type, and the object name.
By clicking the name of an artifact, you can go to a page containing detailed information about the results of scanning objects at the project building stage.
To view detailed information, you need the rights to view the results of scanning objects in CI/CD processes.
- Operating system in which the object was scanned.
- Compliance status of the image: Compliant or Not-compliant.
- Risk rating.
- Date and time of the last object scan
- Date and time when the vulnerability was first detected in the object.
- Timestamp for scanning the object in a CI/CD process.
- Image object type and the name of the image. If autoprofiles were created based on the checksum of this image, an autoprofile icon (
- The Workloads tab displays a list of the pods containing images with the vulnerability and how many of them there are. For each object, the following information is provided:
- Name of the cluster containing the pod in whose image or images the vulnerability was detected.
- Name of the namespace containing the pod in whose image the vulnerability was detected.
If you click the namespace name, the solution will open the namespace's side panel from the graph.
- Name of the pod in whose image the vulnerability was detected.
If you click the namespace name, the solution will open the pod's side panel from the graph.
- The Risk acceptance tab displays the following information:
- Risk acceptance date.
- Risk acceptance period.
- Subset.
- Person who initiated risk acceptance.
- Reason for risk acceptance.
The Risk acceptance tab is available if you have rights to view accepted risks.
For each accepted risk, you can do the following:
- Click the
 icon to set the duration of the risk acceptance.
 - Click the
 icon to cancel the risk acceptance.
This tab also lets you use the Add risk acceptance button to add a risk acceptance for the vulnerability.
The "Manage risks" rights are required to edit the risk acceptance settings.
Detailed information about detected malware
If image scanning detects malware, the solution displays this on the page with information about the image scan results. To view detailed information about a detected malicious object, in the window with image scan results, select the Malware scan tab.
For each object, the solution generates the MD5 or SHA256 hash and indicates the path to the location where it was detected.
You can view detailed information about detected malicious objects in the cyberthreat databases created in
and . To do this, click the link to Kaspersky OpenTIP and Kaspersky TIP resources.A page with a threat description on the Kaspersky OpenTIP portal is publicly available. Users must enter their account credentials to access Kaspersky TIP.
Misconfiguration control of images
Kaspersky Container Security allows detecting misconfigurations in configuration files using the configuration file scanner. This scanner can scan images, file systems, and repositories that contain IaC files (for example, Terraform, CloudFormation, Azure ARM templates, Helm Chart and Dockerfile packages).
Kaspersky Container Security scans the following configuration files:
- Configuration files of Kubernetes objects.
- Configuration files of cluster components.
- Configuration files of images.
- Configuration files of Amazon cloud environment services.
- Configuration files of Azure cloud environment services.
- Configuration files of the DigitalOcean cloud environment.
- Configuration files of the ApacheCloudStack cloud environment.
- Configuration files of Terraform GitHub Provider.
- Configuration files of Google cloud environment services.
- Configuration files of Nifcloud Provider.
- Configuration files of OpenStack.
- Configuration files of Oracle Compute Cloud.
The following table lists the types of configuration files and configuration files formats that Kaspersky Container Security supports.
Types and formats of configuration files
File type |
File format |
|---|---|
Kubernetes |
*.yml, *.yaml, *.json |
Docker |
Dockerfile, Containerfile |
Terraform |
*.tf, *.tf.json, *.tfvars |
Terraform Plan |
tfplan, *.tfplan, *.json |
CloudFormation |
*.yml, *.yaml, *.json |
Azure ARM Template |
*.json |
Helm |
*yaml, *.tpl, *.tar.gz |
YAML |
*.yaml, *.yml |
JSON |
*.json |
About risk rating
A scan conducted by Kaspersky Container Security results in rating a risk of the scanned object. While scanning, the solution may detect all or some of the following security issues in objects:
- Vulnerabilities
- Malware
- Sensitive data
- Misconfigurations
Each risk detected is assigned one of the following risk ratings, based on the severity of the security threats:
- Negligible.
- Low.
- Medium.
- High.
- Critical.
If no security issues are detected during scanning, such an image is considered secure and is marked as Ok.
Risk ratings of the detected vulnerabilities, malware, sensitive data, or misconfigurations correspond to the ratings specified in the security threat databases, which are used for scanning (for example, NVD and Data Security Threats Database). These vulnerability and threat databases use special scoring scales to assess the severity of security threats. For example, the Common Vulnerability Scoring System (CVSS) is applied in the NVD.
The object is assigned the highest severity level of all the detected with an appropriate risk rating.
For example, the following security threats were detected during an object scan:
- vulnerabilities with the low level of severity;
- sensitive data with the high and critical levels of severity;
- configuration errors with the medium severity level;
- malware with the low severity level.
Here, the risk rating is critical in accordance with the highest severity level of the detected threats.
Page top
Risk handling
Threats identified by Kaspersky Container Security (vulnerabilities, malware, sensitive data, and misconfigurations) are subject to the Risk acceptance procedure. If you accept the risk of a threat, it will not be considered by assurance policies when determining image security status (Compliant/Non-compliant with security policies) during the specified acceptance period. Image scanning continues to detect the threat, but does not label the image as Non-compliant.
If you accept the risk of a vulnerability detected in an image, this risk is accepted for the specific image registry. If the risk is accepted for all vulnerabilities in an image, the image is deemed compliant with security policy requirements and is given Compliant status.
If you change the settings of the assurance policy applied to images, the image security status also changes.
The risk from a threat is accepted for a period of 30 days by default. You can extend the period during which the risk is considered accepted. You can also cancel risk acceptance at any time. If you cancel risk acceptance, the associated threat will again affect the security status of the image.
You can view the list of all accepted risks in the Policies → Risk acceptance section.
Risk acceptance
You can accept the risks found by the solution taking into account the following:
- In case of vulnerabilities, configuration errors, and sensitive data, you can accept risks with all severity levels.
- In case of malware, you can accept risks only with the Medium, Low, and Negligible severity levels.
You cannot accept risks with the High and Critical severity levels.
You can accept risk in the following sections:
- In the Image scan results window, risks associated with all threat types (vulnerabilities, malware, misconfigurations, and sensitive data) detected by scanning a specific image can be accepted.
- In the Investigation → Vulnerabilities section, risks are accepted for all vulnerabilities detected by the solution. Risks are accepted in relation to all artifacts detected during the scanning process, including CI/CD objects.
To accept risks, risk management rights are required.
To accept a risk based on image scan results:
- In the image scan results window, open the tab with information about the required threat type.
- In the table, select a threat and click the Accept button in the Risk acceptance column.
- In the window that opens, specify the risk acceptance parameters:
- Select the extent of risk acceptance:
- For the selected image with the detected risk;
- For all images in the repository containing the image with the detected security threat;
- For all images in which this security threat has been or will be detected.
- Specify the period after which this security threat must be considered again when determining the image security status.
- Specify the reason for risk acceptance.
- Select the extent of risk acceptance:
- Click the Accept button.
The selected threat does not affect the security status of this specific image, images in the repository, or all images for the defined number of days (or for an unlimited term).
An accepted risk can be viewed in the Policies → Risk acceptance section.
To accept the risk of a detected vulnerability:
- Click the vulnerability record ID in one of the following sections:
- On the Vulnerabilities tab in the image scan results window.
- In the Investigation → Vulnerabilities section.
- In the sidebar that opens, go to the Risk acceptance tab.
The Risk acceptance tab is available if you have rights to view accepted risks.
- Click the Add risk acceptance button.
- In the window that opens, specify the risk acceptance parameters:
- Select the extent of risk acceptance:
- for the selected artifact (image or CI/CD object)
- for the repository containing the object with the detected vulnerability
- for artifacts in which this vulnerability is currently detected
- for all artifacts, including artifacts that the solution may find during subsequent scans.
The risk is assumed regardless of the scope.
- Specify a period from 1 to 999 days after which the risk acceptance for this vulnerability will be revoked. By default, the period is 30 days.
- Specify the reason for risk acceptance.
- Select the extent of risk acceptance:
- Click the Add button.
The accepted risk for the vulnerability is displayed on the Risk acceptance tab. It can also be viewed in the Policies → Accepted risks section.
Page top
Viewing information about accepted risks
The list of all accepted risks is displayed in the Policies → Risk acceptances section.
You can use the list to do the following:
- Search by risk name, repository name, image, or resource where the risk is detected.
- Filter the list by risk type and manufacturer fix availability.
- Generate a Risk acceptance report by clicking the Create report button above the table.
- Sort the list by date of acceptance, risk name, scope (applied to all images or just one image), and acceptance period. Sorting is performed using the () sort icon.
- View detailed information about risk acceptance and the associated threat. Click the risk name link to open the window with the related detailed information.
Use the buttons in the detailed information window to do the following:
- Specify or extend the time period after which this security threat must be considered again when determining image security status.
- Cancel risk acceptance.
You can also view information about the accepted risk in the list of detected threats in the image scanning results. In the row with the threat with accepted risk, you can find the time of risk acceptance. You can click the link to open a window with detailed information about the risk acceptance and the associated threat.
Information about risk acceptance for a specific vulnerability is also indicated in the table with the list of all vulnerabilities detected by the solution in the Investigation → Vulnerabilities section. The Risk acceptance column displays the number of artifacts (images, CI/CD objects) for which the risk was accepted.
To view the accepted risks of a vulnerability, you need the "View accepted risks" rights.
Information about accepted risks is shown regardless of scopes.
More detailed information on each accepted risk for a specific vulnerability is provided in the detailed description of the vulnerability on the Risk acceptance tab.
Page top
Cancelling risk acceptance
To cancel risk acceptance:
- In one of the following sections, open the table with the list of objects in which the risk was detected:
- On the tab corresponding to the risk in the image scan results window.
- In the Investigation → Vulnerabilities section.
- Select a risk and click the Edit button in the Risk acceptance column.
The Edit button is shown only for previously accepted risks.
- Click the Revoke button and confirm your action in the window that opens.
You can also revoke risk acceptance for vulnerabilities from the window with detailed information about the vulnerability by clicking the icon on the Risk acceptance tab.
Canceling risk acceptance means that the associated threat will again affect the security status of the image(s) for which the risk was accepted.
Page top
Scanning Java packages in images
Kaspersky Container Security can scan Java packages contained in registry images. For this purpose, the solution uses Java vulnerability databases.
Scanning for Java packages is available in Kaspersky Container Security v1.2.1 and later. If you have an earlier version installed, you must update the solution to v1.2.1. to use this functionality.
You can configure scanning of Java packages by setting the value of the ENABLE_JAVA_VULN environment variable in the values.yaml file. If ENABLE_JAVA_VULN = true, Kaspersky Container Security performs scanning using the Java vulnerability databases. If ENABLE_JAVA_VULN = false, Java packages are not scanned.
By default, ENABLE_JAVA_VULN is set to false.
Starting from v1.2.1, the kcs-updates component provided in the distribution kit contains Java vulnerability databases. Using this component, you should make sure that the environment variables in the values.yaml file are defined as follows:
ENABLE_JAVA_VULN = trueKCS_UPDATES_TAG=vХ.Х.Х (the value of the version variable is specified in accordance with the version of the solution)KCS_UPDATES=true
If Java packages scanning is activated (ENABLE_JAVA_VULN = true), the kcs-scanner solution component downloads Java vulnerability databases and notifies the kcs-middleware and kcs-ih components accordingly. Then the kcs-ih component receives the database files from kcs-scanner, assembles and validates the database, and uses it during scanning.
Vulnerabilities found using the Java vulnerability database are displayed in the image scanning results.
Kaspersky Container Security can also scan Java packages in images in external registries and during the CI/CD process when an external scanner is used. In this case, you must use the scanner with the vХ.Х.Х-with-db-java tag, which contains a pre-installed Java vulnerability database. The specified scanner is configured and used similarly to the vХ.Х.Х-with-db scanner.
Investigating security events
To investigate events that occur in containers and the vulnerabilities detected in images, Kaspersky Container Security lets you do the following:
- Analyze container forensics. The solution lets you identify events in containers based on running processes, file operations, network traffic, and detected malware.
- Analyze vulnerabilities. The solution generates a list of vulnerabilities that were detected during static analysis of registry images, image scans in the runtime and CI/CD objects.
Analyzing container forensics
In the Investigation → Container forensic section, Kaspersky Container Security lets you organize events that occurred in containers for further analysis. Information about events is presented in the form of a table.
This section is available if you have rights to view events.
In the table, the solution shows the following information about events:
- Date and time of the event.
- Event type — Process, File operations, Network traffic, or File Threat Protection.
- Additional information about the events, displayed in the following way:
- for a process launch, the command executed in the container is shown
- for file operations, the type of operation is indicated (for example, write or delete)
- for network traffic, the source and destination of traffic is displayed, namely the name of the pod or domain of the source, ports and IP addresses
- for events generated by the File Threat Protection component, the name of the detected malware is displayed.
- Runtime policy mode — Audit or Enforce.
- Full path and name of the container executable file to be started. For file operations, the path to the file is displayed as the name and location of the file or directory in the file system of the container on which any action was taken.
Using filters, you can customize the display of information in the table as follows:
- By event type:
- By running processes
- Bn file operations
- By network traffic
- By the malware detected by the File Threat Protection component
- By the time of the event (you must specify the date and time of the event). The solution shows events for the current day by default.
- By event data or path (you need to enter the data or path in the search field).
By clicking an event row in the table, you can expand the sidebar with detailed information about the selected event.
Page top
Searching container forensics
Under Investigation → Container forensic, you can search for events that occurred in containers.
To find security events that occurred in the container:
In the Search by event data and path field, enter the event data for your search.
Depending on the event type, you must specify the following:
- Container ID or container name (for all event types).
- Path to the files (for Process, File operations, or File Threat Protection events).
- IP address or domain name (for events of the Network traffic type).
The solution displays search results in the security event table in the Investigation → Container forensic section.
Page top
Detailed information about a running process
To open detailed information about a running process:
- Click anywhere in the row of a Process event in the table of security events in the Investigation → Container forensic section.
- In the sidebar that opens, go to the Information tab.
Kaspersky Container Security displays the following information:
- The General information section contains general information:
- Date and time the process was started.
- Command used to start the process, including arguments.
- Path to the file or directory.
- Runtime policy mode.
- The Location details section contains the following information about the container where the process was started:
- Container ID and name.
- Image name and checksum. You can open the page with image scan results by clicking the name of the relevant image.
To view the results of an image scan, you need the rights to view image scan results. You also need access to the scope for the clusters.
- Pod name. You can display pod details by clicking the name of the pod.
Viewing and managing cluster resources requires the corresponding rights. You also need access to the corresponding scope.
- Namespace name.
- Cluster name.
- Host name and IP address.
- The Process section contains the following data about the running process:
- Parent process ID (PPID)
- Process ID (PID) and a new PID.
- Effective User ID (EUID).
- Effective Group ID (EGID).
- Group ID (GID).
- The table under Runtime policies impacting the container displays a list of all runtime policies that could be applied to the container with the running process. For each policy, the solution shows the name of the policy and its mode.
You can open the sidebar with a detailed description of the applied by clicking the name of the policy. Policy information is displayed in a similar way to how information about applied policies is presented when viewing application information on the graph. Limitations apply when viewing policy information.
Detailed information about file operations
To open detailed information about file operations,
- Click anywhere in the row of a File operations event in the table of security events in the Investigation → Container forensic section.
- In the sidebar that opens, go to the Information tab.
Kaspersky Container Security displays the following information:
- The General information section contains general information:
- Date and time the file operation was performed.
- Type of file operation (for example, Create or Delete).
- Path to the file or directory.
- New path to the file or directory (displayed only for the Rename or move file operation type).
- New permissions (displayed only for the Change access permissions operation type).
- Runtime policy mode.
- Error code.
- The Location details block provides the following information about the container where the file operations were found:
- Container ID and name.
- Image name and checksum. You can open the page with image scan results by clicking the name of the relevant image.
To view the results of an image scan, you need the rights to view image scan results. You also need access to the scope for the clusters.
- Pod name. You can display pod details by clicking the name of the pod.
Viewing and managing cluster resources requires the corresponding rights. You also need access to the corresponding scope.
- Namespace name.
- Cluster name.
- Host name and IP address.
- The Process section contains the following data about the process where file operations were found:
- Parent process ID (PPID)
- Process ID (PID) and a new PID.
- User ID (UID).
- Group ID (GID).
- Effective User ID (EUID).
- Effective Group ID (EGID).
- UID of the new owner (displayed only for the Change ownership file operation type).
- GID of the new owner (displayed only for the Change ownership file operation type).
- The table under Runtime policies impacting the container displays a list of all runtime policies that could be applied to the container in which the file operations were detected. For each policy, the solution shows the name of the policy and its mode.
You can open the sidebar with a detailed description of the applied by clicking the name of the policy. Policy information is displayed in a similar way to how information about applied policies is presented when viewing application information on the graph. Limitations apply when viewing policy information.
Details information about network traffic
To open detailed information about file operations,
- Click anywhere in the row of a Network traffic event in the table of security events in the Investigation → Container forensic section.
- In the sidebar that opens, go to the Information tab.
Kaspersky Container Security displays the following information:
- The General information section contains general information:
- Date and time the file operation was performed.
- Runtime policy mode.
- Traffic type: ingress or egress connection.
- The Source section contains the following information about the connection:
- Pod name or domain of the source of the connection. You can display pod details by clicking the name of the pod.
Viewing and managing cluster resources requires the corresponding rights. You also need access to the corresponding scope.
- IP address of the source of network traffic.
- Port used for the connection.
- Pod name or domain of the source of the connection. You can display pod details by clicking the name of the pod.
- The Destination section contains the following information about the connection:
- Pod name or domain of the recipient of network traffic. You can display pod details by clicking the name of the pod.
- IP address of the recipient of network traffic.
- Port used for the connection.
- The Location details section provides the following information about the container where the network traffic was detected:
- Container ID and name.
- Image name and checksum. You can open the page with image scan results by clicking the name of the relevant image.
To view the results of an image scan, you need the rights to view image scan results. You also need access to the scope for the clusters.
- Pod name. You can display pod details by clicking the name of the pod.
- Namespace name.
- Cluster name.
- Host name and IP address.
- The table under Runtime policies impacting the container displays a list of all runtime policies that could be applied to the container in which the network connections were detected. For each policy, the solution shows the name of the policy and its mode.
You can open the sidebar with a detailed description of the applied by clicking the name of the policy. Policy information is displayed in a similar way to how information about applied policies is presented when viewing application information on the graph. Limitations apply when viewing policy information.
Detailed information about detected malicious objects
To open detailed information about detected malicious objects:
- Click anywhere in the row of a File Threat Protection event in the table of security events in the Investigation → Container forensic section.
- In the sidebar that opens, go to the Information tab.
Kaspersky Container Security displays the following information:
- The General information section contains general information:
- Date and time the malware was detected.
- Malware name.
- Type of malware detected (for example, virus software).
- Severity level of the malware.
- File checksums in MD5 and SHA286 formats.
- Event type (for example, detected threat).
- Path to the file or directory.
- Owner ID.
- Object ID.
- Runtime policy mode.
- File interceptor mode (the file interceptor runs regardless of the runtime policy mode).
- The Location details section contains the following information about the container where malware was detected:
- Container ID and name.
- Image name and checksum. You can open the page with image scan results by clicking the name of the relevant image.
To view the results of an image scan, you need the rights to view image scan results. You also need access to the scope for the clusters.
- Pod name. You can display pod details by clicking the name of the pod.
Viewing and managing cluster resources requires the corresponding rights. You also need access to the corresponding scope.
- Namespace name.
- Cluster name.
- Host name and IP address.
- The Process section contains the following information about the process where malware was detected:
- Process ID (PID) and a new PID.
- Effective User ID (EUID).
- The table under Runtime policies impacting the container displays a list of all runtime policies that could be applied to the container in which the malware was detected. For each policy, the solution shows the name of the policy and its mode.
You can open the sidebar with a detailed description of the applied by clicking the name of the policy. Policy information is displayed in a similar way to how information about applied policies is presented when viewing application information on the graph. Limitations apply when viewing policy information.
Restrictions on runtime policies
For each event type, Kaspersky Container Security displays a list of all runtime policies that can be applied to the container where the security event was found. Access to the list of policies is provided subject to the following restrictions:
- If a user has the rights to manage runtime policies and has the same role as the author of the policy, the user has access to all information about the policies, and also has the ability to edit runtime policy settings.
- If a user is granted rights to view runtime policies, the user has access to all information about the policies.
- If a user is not granted rights to view runtime policies, the user cannot open the detailed description of a runtime policy. A user only has access to information about the list of applied runtime policies on the Information tab in the sidebar with a detailed description of the security event.
Investigating container forensics while accounting for adjacent events
When investigating an event, you should pay attention to and analyze the events that occurred before and after the event in question.
To view the events that occurred before and after the event in question:
- Click anywhere in the row of an event in the table of security events in the Investigation → Container forensic section.
- Go to the Adjacent events tab.
By default, the solution displays a table with the following information:
- Event being examined.
- 3 events that occurred before the event being examined.
- 46 events that occurred after the event being examined.
For each event, you can also view events in a 90-day range. For example, if you are viewing an event from the current day, you can open events from the past 90 days. If an event of interest occurred 45 days ago, you can open events that occurred 45 days before the event being examined.
For each event in the table, the solution shows the following information:
- Date and time of the event.
- Event type.
- Additional information about the event
- Full path.
You can open the sidebar with detailed information about the selected event by clicking the row of the event in the table.
You can also download information about all events with a detailed description of each of them in text format.
Page top
Analyzing detected vulnerabilities
Kaspersky Container Security detects vulnerabilities through static analysis of registry images, image scans in the runtime and CI/CD objects. For analysis purposes, the full list of detected vulnerabilities is presented as a table in the Investigation → Vulnerabilities section.
The table lists the following for each detected vulnerability:
- The Vulnerability column contains the ID of the vulnerability entry. By clicking on the identifier, you can open a page with detailed information about the vulnerability detected in the image.
- The Severity column displays the severity level of the detected vulnerability and whether it has an exploit.
- The Resource column contains the name of the resource where the vulnerability was detected.
- The Vendor fix column shows whether a fix for the vulnerability is available from the vendor. The solution shows the version number that has the fix, or indicates that no fix is available.
- The Artifacts column shows the number of artifacts (images in registries and the runtime environment, as well as CI/CD objects) that are scanned by Kaspersky Container Security.
The solution displays the number of unique images based on
imagename:tagfor the selected scope. When determining the number of artifacts, the following rules apply:- If an image based on
imagename:tagis part of the resources of a scope based on resources and clusters, then the image is counted once. - If a user has access to resources of a scope based on clusters, but does not have access to resources based on registries in this scope, only the number of images in the runtime is counted.
- If you specify All in the scopes filter, the total number of artifacts for all scopes is displayed.
- CI/CD artifacts are only countable when working with the default scope.
- If an image based on
- The Workloads column shows the number of pods containing images with the vulnerability.
Using filters, you can select vulnerabilities to display in the table in the Investigation → Vulnerabilities section.
Page top
Selecting vulnerabilities to display
To use the filter buttons located above the table to select vulnerabilities to display in the table:
- Click the filter buttons with the values you want to display. Vulnerabilities can be selected based on the following criteria:
- Vulnerabilities by detection location:
- Image in registries.
- Image deployed in a runtime.
- CI/CD object.
- Vulnerabilities by severity level:
- Negligible.
- Low.
- Medium.
- High.
- Critical.
By default, all detection locations and vulnerability severity levels are selected.
- Vulnerabilities by detection location:
- If necessary, use the Disabled / Enabled switch to enable or disable the display of only vulnerabilities with available exploits. By default, the switch is set to Disabled.
- If necessary, enter a vulnerability ID or resource name in the search field.
To use a filter to select vulnerabilities to display in the table:
- Click the filter icon () above the table with the list of users.
- In the opened sidebar, use the Disabled / Enabled toggle switch to enable or disable the display of only vulnerabilities with available exploits. By default, the switch is set to Disabled.
- To determine the severity level, select one of the following options: Severity level or Score, and then do the following:
- If you select Severity level, select the buttons with the values that you want to display. You can select the following display values:
- Negligible.
- Low.
- Medium.
- High.
- Critical.
By default, all vulnerability severity levels are selected.
- If you select Score, use the slider to define the vulnerability score. Values from 0 to 10 are available. The solution will display vulnerabilities that match the specified vulnerability score.
- If you select Severity level, select the buttons with the values that you want to display. You can select the following display values:
- For the Vendor fix setting, specify whether a fix is available from the vendor: All, Available or Not available. The default value is All.
- For the Risk acceptance setting, specify whether the selected vulnerability has been accepted in the specified resource: All, Accepted, or Not accepted. The default value is All.
- For the Location details setting, specify the location where the vulnerability was detected:
- Image in registries.
- Image deployed in a runtime.
- CI/CD object.
By default, all detection locations are selected.
Restrictions related to scopes
The access to the list of detected vulnerabilities is given by scopes assigned to the user as follows.
- If a user is assigned the default scope, the has access to all information about the detected vulnerabilities, including CI/CD objects.
- If the scope assigned to a user entails access to resources based on registries, the user is shown vulnerabilities for which the value of the Workloads column is 0.
- If the scope assigned to a user entails access to resources based on clusters, the user is shown vulnerabilities for which the value of the Workloads column is greater than 0.
- If the scope assigned to a user entails access to resources based on registries and clusters, the user is shown vulnerabilities for which the value of the Workloads column is greater than or equal to 0.
Integration with third-party resources
To identify security issues and ensure protection of containerized applications, Kaspersky Container Security can integrate with the following third-party resources:
- External image registries. The solution allows scanning container and IaC images hosted on repository management and storage platforms, including as part of the CI/CD process, for vulnerabilities, malware, misconfigurations, and the presence of sensitive data.
- Image signature validators. Kaspersky Container Security can validate digital signatures of images using an external signature application.
- Output. When implementing response policies, the solution can notify users about security events by sending messages via email or Telegram.
- External LDAP directory services. When defining user roles and scopes, the solution allows configuring user accounts based on data from an external directory service and map user roles to user groups from Active Directory.
- SIEM systems. Kaspersky Container Security allows connection to security information and event management systems to notify about events for analysis and further respond to potential threats.
- HashiCorp Vault external storage. The solution allows to securely store and use passwords, tokens and secrets by means of HashiCorp Vault.
Setting up integration with external image registries
Kaspersky Container Security can scan images from the following external image registries:
- Harbor
- GitLab Registry
- JFrog Artifactory
- Sonatype Nexus Repository OSS
- Yandex Registry
- Docker Hub
- Docker Registry
Integration with Docker Registry requires support of the Docker Registry V2 API on the external registry server side.
- Red Hat Quay
- Amazon Elastic Container Registry
You need to configure the integration of the solution with external registries so that the solution can scan images from external registries. Images from registries integrated with Kaspersky Container Security can be scanned automatically or manually, depending on the configured image pulling and scanning settings for each registry.
Minimum sufficient rights for integration with registries
To integrate with external image registries, a Kaspersky Container Security account must have a certain set of rights, which differs depending on the registry type. The list of the minimum account rights required for integration is given below for each registry type.
GitLab
To integrate the solution with a GitLab user's registry, you should define the parameter values as follows:
- User role in the project or group: Reporter.
- Level of access to the project: Reporter.
- Rights assigned to the user token: read_api, read_registry.
JFrog Artifactory
To integrate the solution with a JFrog user's registry, you should define the parameter values as follows:
- User role in the project or group: Manage Reports.
- Project access: Can Update Profile.
- User rights: the right to read any repository (ANY repository).
Harbor
To integrate the solution with a Harbor user's registry, you should define the parameter values as follows:
- Member type: user. To do this, specify User in the Member Type column of the table in the Projects → Members section.
- User role in the project or group: user with limited rights. To do this, you must specify Guest in the Role column of the table in the Projects → Members section.
- User rights: user without administrator rights. To do this, you must select No in the Administrator column of the table in the Users section.
Nexus
To integrate the solution with a Nexus user's registry, you should define the parameter values as follows:
- User role in the project or group: user.
- Rights assigned to the user role in the project or group: nx-apikey-all, nx-repository-view-docker-*-browse, nx-repository-view-docker-*-read.
Docker Hub
The solution integrates with a Docker Hub user's registry after authorization using the user name and password.
This Docker Hub registry integration option only applies to a personal namespace.
RedHat Quay
To integrate the solution with a RedHat Quay user's registry, the following rights and permissions are required:
- User permissions for correct operation of the Test Connection functionality: user with the Administer Organization permissions.
- View all visible repositories permissions.
- Read/Write to any accessible repositories permissions.
Yandex
To integrate the solution with a Yandex user's registry, you should define the parameter values as follows:
- User role in the project or group:
container-registry.viewer. - Permissions given to a user role in a project or group: view container registries.
Amazon Elastic Container Registry
To integrate the solution with an Amazon Elastic Container Registry user's registry, you should define the parameter values as follows:
- AWS policy for accessing a project or group:
AmazonEC2ContainerRegistryReadOnly. - Permissions given to a user role in a project or group: view and read.
Working with public registries without authorization
Kaspersky Container Security 2.0 does not work with public registries without authorization. For example, you cannot use the solution to scan images when Docker Hub is accessed anonymously.
If you do not authorize in public registries, you can use such image registries in a cluster, add them to Kaspersky Container Security and manually assign them to a specific scope. If the scope includes only one or several public registries in which you are not authorized, and you try to add an image in the Resources → Registries section, the solution displays an error indicating that it is impossible to add images because the solution has no registry integration.
Page top
Adding integrations with external image registries
Integrated registries support only local image repositories that directly contain the images. In version 2.0, Kaspersky Container Security does not support working with remote or virtual repositories.
To add an integration with an external registry:
- In the Administration → Integrations → Image registries section, click the Add registry button.
The integration settings window opens.
- On the Registry details tab, specify the settings for connection to the registry:
- Enter the name of the registry.
- If required, enter a description of the registry.
- Select the registry type from the drop-down list. Kaspersky Container Security supports the following types of registries:
- Harbor (integration using the Harbor V2 API).
- GitLab Registry (integration using the GitLab Container Registry API).
- JFrog Artifactory (integration using the JFrog API).
- Sonatype Nexus Repository OSS (integration using the Nexus API).
- Yandex Registry (integration using the Yandex Container Registry API).
- Docker Hub (integration using the Docker Hub API).
- Docker Registry (integration using the Docker Registry V2 API).
- Red Hat Quay (integration using the Red Hat Quay API).
- Amazon Elastic Container Registry (integration using the Amazon Elastic Container Registry API).
The Docker Registry can be accessed using the Docker Registry V2 API if you configure integration with the Sonatype Nexus Repository OSS, Harbor, JFrog Artifactory (using a port or a subdomain), or Yandex Registry. Integrations with GitLab Registry, Docker Hub, and JFrog Artifactory (via Repository Path) are not supported.
- If you set up a JFrog Artifactory registry integration, select one of the following methods in the Repository Path method drop-down list to access Docker:
- Repository path.
- Subdomain.
- Port.
- If you configure integration with the Sonatype Nexus Repository OSS registry, select the pull mode: Tagged images or All images. If All images mode is selected, the solution pulls all registry images regardless whether they have or lack tags. Untagged images are displayed with the build hash.
- If you configure an integration with a registry such as JFrog Artifactory, Harbor, GitLab Registry, Sonatype Nexus Repository OSS, Docker Registry, or Red Hat Quay, enter the full URL of the registry that directly points to the container registry. We recommend that you use HTTPS connection (HTTP connection is also supported).
If you use HTTP or HTTPS with a self-signed or invalid certificate, you should check the insecure-registry box for the Docker engine on the nodes where the server and scanner are installed.
- If you configure an integration with a registry such as JFrog Artifactory, Harbor, GitLab Registry, and Sonatype Nexus Repository OSS, or Red Hat Quay, enter the full URL that points to the registry API.
- Select an authentication method and specify the necessary data for it as follows:
- If you configure an integration with such registry as GitLab Registry, select authentication using an account or an access token.
- If you configure an integration with such a registry as Yandex Registry, select authentication using an API key (Yandex OAuth token) or using a user name and token. Specify oauth for the user name when using the Yandex OAuth token, or iam when using the Yandex IAM token.
- For such registries as Sonatype Nexus Repository OSS and Docker Hub, authentication is performed only with an account.
- For such a registry as Harbor, authentication is only permitted with an account of a user or a robot.
- For such a registry as Docker Registry, authentication is only conducted using a user name and password, which are provided by the Docker V2 API.
- For Red Hat Quay registries, organization name and access token is the only authentication method. Specify these parameters in the Organization name and OAuth token fields.
- For Amazon Elastic Container Registries, you can authenticate by specifying the region, Access key ID, and Secret access key .
In the Region field, you must specify one of the Amazon Web Services regions (for example, us-west-2 or us-east-2).
For Access key ID and Access key settings, you must specify values that you can get using the AWS management console.
- Go to the Repository caching tab and use the Disabled/Enabled toggle switch to enable repository caching if necessary. If caching is disabled, repositories and images in the Registry section are displayed only if the Search field is used. If caching is enabled, the solution displays the list of available repositories and images. By default, repository caching is disabled.
Enabling repository caching may impact the performance of Kaspersky Container Security.
- Go to the Image scan details tab and specify the following image scan settings:
- Scan timeout in minutes for images from this registry. The default scan timeout is 60 minutes.
If image scanning lasts longer than the specified time, the scanning stops and the image is returned to the scanning queue. The solution will requeue the image up to 3 times. This means that the time required to scan an image from the registry may be tripled.
Image pull and scan settings for the registry. By default, the Manual option is selected in Pull and scan images: images are not automatically pulled from the registry, but the user can manually add images to the list of images for scanning. New images are automatically queued for scanning.
If you want images to be pulled from the registry and queued for scanning automatically, select Automatic in Pull and scan images and configure the settings for image pulling and scanning. The following options are available:
- Scan interval (days) is the interval in days of image pulling from the registry for scanning. The default setting is 1 day.
- Scan time (GMT) is the time when the images in the registry were scanned.
- If necessary, select the check box to re-scan previously pulled images whenever new images are scanned.
- If necessary, under Advanced settings, select the Name / tag criteria check box to use image name or tag patterns to specify which images you want to be pulled and scanned. If you select the check box, Kaspersky Container Security will only pull those images that match the specified patterns for scanning.
You can use the following patterns:
- by image name and tag – <name><:tag>
- by image name only – <name>
- by image tag only – <:tag>
For example:
- for the
alpinepattern, all images with the name "alpine" are pulled, regardless of the tag; - for the
4pattern, all images with tag 4 are pulled, regardless of the image name; - for the
alpine:4pattern, all images with the name "alpine" and tag 4 are pulled.
When generating patterns, you can use the * character, which replaces any number of characters.
You can add one or more patterns.
- Select one of the additional conditions for pulling images:
- If no additional conditions are required, select No additional conditions.
- If you want to pull only images created within a specific time frame, select this option and in the fields to the right, specify the duration of the period and the unit of measure. By default, the period is 60 days long.
- If you want to pull only images with the latest tags, counting from the date when the image was created, select this option and in the field to the right, specify how many of the latest tags from each repository you want to be taken into account.
- If necessary, under Exceptions, select or clear check boxes to specify exceptions for image pulling:
- Never pull images with the name/tag pattern - using image name/tag patterns you can specify, which images are excluded from pulling and scanning.
- Always pull images with the name/tag pattern—using image name/tag patterns you can specify, which images are always pulled and scanned, regardless of other conditions set above.
- Scan timeout in minutes for images from this registry. The default scan timeout is 60 minutes.
- Click Test connection to see if a connection with the registry can be established.
- Click the Save button in the top of the window to save the registry integration settings.
Example of Red Hat Quay registry integration settings
Page top
Viewing information about integrations with registries
You can view a table with the list of all registries integrated with Kaspersky Container Security in the Administration → Integrations → Image registries section.
The table displays the following information about integrated registries:
- Name of the image registry integration
- Description, if one was specified when creating the integration with the image registry
- The type of the connected registry.
- Registry URL
- Status of the last connection with the image registry: Success or Error. If Error is displayed, the solution also displays a brief description of the connection error.
In the table, you can:
- Add new registry integrations. Click Add registry above the table to open the integration settings window.
- View and modify registry integration settings, including image pull and scan settings. You can open the editing window by clicking the registry name link.
In this window, you can also click Test connection to see if a connection with the registry can be established.
- Delete integrations with registries.
Deleting integration with external registry
To delete an integration with an external registry:
- In the Administration → Integrations → Image registries section, select the integration you want to delete by selecting the check box in the row with the registry name. You can select one or more integrations.
- Click Delete above the table.
The Delete button becomes enabled after you select one or more integrations.
- In the window that opens, confirm the deletion.
Kaspersky Container Security does not scan images from a registry it is no longer integrated with.
Page top
Harbor integration
Integration of Kaspersky Container Security with the external Harbor registry can be performed in two ways:
- In the same way as integration with other external registries
- Upon the request of the external Harbor registry
Harbor views the solution as an additional external scanner to scan objects for vulnerabilities. Integration with Kaspersky Container Security is configured using the Harbor scanner plugin. The solution names this automatically created image registry as Harbor External Integration and marks the repository in which it is located with the Harbor icon ().
This integration remains the only automatically created integration with Harbor, and the name assigned to the image registry cannot be changed.
To start the Harbor scan process, you need to know the endpoint of the Kaspersky Container Security API.
To create an integration by Harbor request it is required to have rights to view and configure scanning in CI/CD. If these rights are absent, Harbor will not be able to connect the solution as a scanner and scan objects as part of the CI/CD process.
Page top
Creating an integration upon Harbor request
To create registry integration by Harbor request, you must have a Harbor account with administrator rights, as well as rights to view and configure scanning in CI/CD in Kaspersky Container Security. If these rights are not available, Harbor will not be able to connect the solution as a scanner.
To create a Harbor integration upon Harbor request:
- From the main menu in the left pane of the Harbor web interface, select Administration → Interrogation Services.
- Click the New Scanner button.
- Enter the following information:
- The unique name of the solution integration to be displayed in the Harbor interface.
- If necessary, a description of the external scanner that is being added.
- The address of the Kaspersky Container Security API endpoint displayed by Harbor.
- In the Authorization drop-down list, select APIKey as the authorization method when connecting the registry to the solution.
- In the APIKey field, enter the value of the API token.
If the API token changes, you must specify its new value before starting the Harbor scan. If a new API token is not added to the external scanner settings in Harbor, the scan fails.
- Select the Skip certificate verification check box to skip certificate verification.
- If necessary, click Test Connection to verify that Harbor can connect to the solution.
- Click Add to create the integration.
In the list of available scanners under Administration → Interrogation Services → Scanners, Harbor shows the name assigned to the solution in the Harbor.
The new scanner is used for scanning objects if it is specified as the default scanner in Harbor or assigned to the project. Both options require additional configuration in Harbor.
After scanning is started, an integration with the solution upon Harbor request is created in the external registry. Kaspersky Container Security displays the created Harbor External Integration registry in the list of image registries in the Administration → Integrations → Image registries section. The repository containing images from the external registry is marked with the Harbor icon (). Harbor External Integration is updated after starting and running another scan in the external registry.
You cannot add an image to an automatically created registry of images from Harbor by using the Add images button in the management console.
Harbor External Integration scans can be manually initiated or automatically started from the external registry. You cannot start scanning or rescanning images from the Harbor automatically created image registry in Kaspersky Container Security.
The Harbor External Integration registry (as well as the registry created as part of the standard integration with Harbor) is scanned in line with the applicable scanner policy.
At the end of the scan, the solution generates a report on vulnerabilities found during scanning of selected objects and sends it to Harbor. If sending a report takes more than five seconds (for example, because of the quality of the network connection), an error in receiving scan results is displayed in the external registry interface.
Page top
Viewing and editing the Harbor External Integration settings
The Harbor External Integration image registry is displayed in the list of registries integrated with Kaspersky Container Security in the Administration → Integrations → Image registries section.
To change the Harbor External Integration settings:
- Select the Harbor External Integration registry in the list of image registries in the Administration → Integrations → Image registries section.
- Specify the values of the following configurable settings:
- Description on the Registry details tab.
- Scan timeout on the Image scan details tab.
You cannot change other Harbor External Integration registry details.
- Click Save.
Rescanning
After receiving the scan results, objects from the Harbor External Integration registry cannot be sent for rescanning from Kaspersky Container Security. Rescanning can only be initiated from Harbor.
If you create an integration with Harbor from Kaspersky Container Security and the created image registry is similar to Harbor External Integration, the following rules are applied to rescanning:
- Scanning objects in the registry created in the solution does not trigger a rescan in Harbor External Integration.
- Scanning objects in Harbor External Integration does not trigger a rescan in the registry created in the solution.
Integration with CI/CD
Kaspersky Container Security lets you scan images of containers and IaC residing in code repository management systems in the CI/CD process to detect vulnerabilities, malware, misconfigurations, and exposed sensitive data.
At the project build stage in the repository management system, you can run the Kaspersky Container Security scanner to check the objects in the repository for compliance with the enabled security policies. The scanner is started from a registry using an agent, such as GitLab Runner in GitLab. Data on the scan job and sending scan results are forwarded through the application programming interface (API).
When running an object scan during the project build stage, you must make sure that the Fail CI/CD step is not selected in the settings of the applied assurance policy. If this setting is activated, the solution will notify you of an error during the scan.
The scan results are displayed in the list of images in the Inventory → CI/CD → Scanning in CI/CD section.
For each of the objects in the table, Kaspersky Container Security displays the following:
- Date and time of the last scan.
- Name.
- Risk rating.
- Summary scan results with an indication of the identified objects related to vulnerabilities, malware, sensitive data and misconfigurations.
- Artifact type.
- The number and pipeline of the build in which the image was scanned.
In the Resources → CI/CD → Scanning in CI/CD section, you can also generate a report for images that are scanned within the CI/CD process.
Reports are generated only for objects with the Image artifact type. In this section, a report cannot be generated for other types of artifacts.
Artifact scanning in CI/CD processes
Kaspersky Container Security allows you to scan images that are used in CI/CD. To scan images from CI/CD, you should configure the integration of Kaspersky Container Security with CI/CD processes.
Data from listening to and intercepting network traffic must be securely transferred between the CI/CD environment and the solution.
To scan images or repositories (in order to scan configuration files) used in the CI/CD process, add a stage to the CI/CD pipeline that runs the Kaspersky Container Security scanner.
To scan images from CI/CD, in the configuration file used to integrate the repository, specify the API_BASE_URL (web-address of the Kaspersky Container Security API server) and API_TOKEN (token to access API of the Kaspersky Container Security) environment variables for the scanner. You must also specify API_CA_CERT (certificate for verifying host server of the API solution) or SKIP_API_SERVER_VALIDATION = true to skip this scan.
The scanning results are forwarded to the server and displayed in the Management Console in the Resources → CI/CD section. The provided table lists the images that were scanned, shows the results of the risk assessment, and indicates the detected vulnerabilities.
You can click the image name link to open a page with detailed information about image scanning results. This page is similar to the page showing the results of registry images scanning.
Kaspersky Container Security also displays the type of artifact for each object. Two main artifacts are used:
- File system is repository containing configuration files.
- Container image is template used for runtime implementation of the container.
For each scan object, you can specify the build number (BUILD_NUMBER) and the build
BUILD_PIPELINE). These parameters can be used to determine the specific stage where the object failed.
For CI/CD images, rescanning is not provided.
Kaspersky Container Security performs the following types of scans in CI/CD:
- Scanning images from the image registry. The solution runs a scan after a successful build and saves the image into the image registry.
- Scanning of images in TAR archives. A TAR archive is stored as a build artifact that the solution scans in the next build pipeline.
- Scanning a Git repository, which can be performed in one of the following ways:
- for a project branch (individual development path) in the Git repository
- for a commit (state snapshot or checkpoint in the project's timeline)
To scan an image from an image registry:
Start the scan by running a command in the following format:
/scanner [TARGET] --stdout
where:
<TARGET>—full address of the image in the registry;<--stdout>is the output to the security event log.
To access the registry, you must set the login COMPANY_EXT_REGISTRY_USERNAME and password (token) COMPANY_EXT_REGISTRY_PASSWORD in the environment variables.
To use a certificate for secure connection to the registry, you must specify the certificate details in the COMPANY_EXT_REGISTRY_TLS_CERT environment variable as the following string in .PEM format: -----BEGIN CERTIFICATE-----\n... certificate data > ...\n-----END CERTIFICATE----- .
Examples of scanning images in GitLab CI/CD and Jenkins CI/CD.
To scan an image from a TAR archive:
- Build an image and save it as a TAR archive using any application for creating containerized images.
- Start the scan by running a command in the following format:
/scanner [TARGET] --file --stdoutwhere:
<TARGET>—path to the file with the image to be scanned<--file>—flag indicating scanning of theTARGETfile<--stdout>is the output to the security event log.
Example of a configuration file with settings for scanning a TAR archive
To scan the Git repository:
- In the configuration file of the Git repository, in the environment variables specify the token to access the repository (
GITHUB_TOKENorGITLAB_TOKEN). - Start the scan by running a command in the following format:
/scanner [TARGET] --repo [--branch BRANCH] [--commit COMMIT] --stdoutwhere:
<TARGET>—web address (URL) of the Git repository<--repo>—flag indicating scanning of theTARGETfile<--branch BRANCH>—branch of the repository to be scanned<--commit COMMIT>—hash of the commit to be scanned<--stdout>is the output to the security event log.
To scan the IaC file system, you must use the scanner image with the vX.XX-with-db database. To scan IaC files, the scanner must be given access to the files inside the container (for example, by mounting a volume with files or copying files to the container file system).
To scan the file system,
Start the scan by running a command in the following format:
/scanner [TARGET] --sources --stdout
where:
<TARGET>–path to the file folder for scanning<--sources>–flag indicating the need to scan files in the file system<--stdout>is the output to the security event log.
Example of a configuration file with variables used to scan files in the file system
Scan results can be viewed in Resources → CI/CD, or downloaded in the .SPDX, .JSON, and .HTML formats.
Page top
Configuring integration with GitLab CI/CD
This example uses a specific scanner image with the built-in vulnerability databases located in the image registry of the Kaspersky Container Security manufacturer.
To use the image scanning feature in the GitLab CI/CD process, you should enable the use of the GitLab Container Registry.
Integration configuration includes the following steps:
- Authorization of GitLab CI/CD in the image registry of the Kaspersky Container Security manufacturer.
- On the cluster operator's workstation, prepare a Base64 hash of the authorization data by running the following command:
printf "login:password" | openssl base64 -Awhere login and password are the user name and password of an account in the image registry of the Kaspersky Container Security manufacturer.
- In the GitLab CI/CD environment variables, create the DOCKER_AUTH_CONFIG variable (in the GitLab repository select Settings → CI/CD, click the Expand button to expand Variables, and then click the Add variable button).
- Specify the variable in the following form:
{"auths": {"repo.cloud.example.com": {"auth": "base64hash"}}}where base64hash is the string obtained in step 1a.
- On the cluster operator's workstation, prepare a Base64 hash of the authorization data by running the following command:
- Authorization of requests from GitLab CI/CD when sending data to Kaspersky Container Security.
- Copy the API token on the My profile page.
- Specify the copied API token value in the API_TOKEN variable in the .gitlab-ci.yml configuration file.
- Adding the image scanning stage to the CI/CD process.
To add scanning to the CI/CD pipeline, you should add the following lines to the .gitlab-ci.yml file:
- Add information about the scanner image that contains databases of vulnerabilities and other malicious objects after the code build stage in the following form:
scan_image:stage: scannerimage:name: repo.cloud.example.com/repository/company/scanner:v2.0-with-dbentrypoint: [""]pull_policy: alwaysWe recommend that you specify always for the
pull_policyparameter to receive relevant builds with updated databases of vulnerabilities and other malicious objects for each scan. - Specify the tag, build ID, pipeline ID and API token for authorization of the CI/CD scanner requests to Kaspersky Container Security as follows:
SCAN_TARGET: ${CI_REGISTRY_IMAGE}:master
BUILD_NUMBER: ${CI_JOB_ID}
BUILD_PIPELINE: ${CI_PIPELINE_ID}
API_TOKEN:
<API token value>The example here contains the
mastertag, you can also specify another tag. - If you configure scanning for a private repository, specify the authorization data to ensure the scanner can access an image. The authorization data can be set as variables.
COMPANY_EXT_REGISTRY_USERNAME: ${COMPANY_EXT_REGISTRY_USERNAME}
COMPANY_EXT_REGISTRY_PASSWORD: ${COMPANY_EXT_REGISTRY_PASSWORD}
- To use a certificate for secure connection to the registry, specify the certificate data in the
COMPANY_EXT_REGISTRY_TLS_CERTenvironment variable as a string in the .PEM format:-----BEGIN CERTIFICATE-----\n... <certificate details> ...\n-----END CERTIFICATE-----. - Specify the following parameters of communication using a proxy server:
HTTP_PROXY–<proxy server for HTTP requests>HTTPS_PROXY–<proxy server for HTTPS requests>NO_PROXY–<domains or appropriate domain masks to be excluded from proxying> - If necessary, specify a variable to check the data receiving server in CI/CD using the CA certificate of the Ingress controller:
API_CA_CERT: ${KCS_CA_CERT}The CA certificate of the Ingress controller is specified in the text field as a string in the .PEM format:
----- BEGIN CERTIFICATE ----- \ n...
<certificate details>...\ n ----- END CERTIFICATE -----If the
API_CA_CERTvariable is not set, scanning will start but will not be completed.Use of the CA certificate of the Ingress controller allows the scanner running in CI/CD to verify the authenticity of the data receiving server.
If you use a self-signed certificate, or want to skip checking the data receiving server using the CA certificate of the Ingress controller, specify the value of the variable to skip the check as follows:
SKIP_API_SERVER_VALIDATION: 'true'
- Specify the web address of the API host server for Kaspersky Container Security:
API_BASE_URL–<web address>variables:
API_BASE_URL: ${API_BASE_URL}
script:
- /bin/sh /entrypoint.sh $SCAN_TARGET --stdout > artifact-result.json
artifacts:
paths:
- artifact-result.json
- Add information about the scanner image that contains databases of vulnerabilities and other malicious objects after the code build stage in the following form:
After configuring integration with an external registry, you can scan images within the CI/CD process, including scanning in SBOM mode. Scan results can be viewed in Resources → CI/CD, or downloaded in the .SPDX, .JSON, and .HTML formats.
Page top
Configuring integration with Jenkins CI/CD
Configuring integration with Jenkins CI / CD consists of the following steps:
- Authorization of Jenkins CI/CD in the image registry of the Kaspersky Container Security manufacturer. To do so, on the cluster operator's workstation, prepare a Base64 hash of the authorization data by running the following command:
printf "login:password" | openssl base64 -Awhere login and password are the user name and password of an account in the image registry of the Kaspersky Container Security manufacturer.
- Authorization of Kaspersky Container Security API. To perform authorization, complete the following steps:
- Copy the API token on the My profile page.
- Specify the copied API token value in the API_TOKEN variable in the Jenkinsfile configuration file.
- Authentication of the data receipt server in CI/CD using the CA certificate of the Ingress controller. To perform authentication, in the Jenkinsfile configuration file, specify one of the following variables:
-e API_CA_CERT=${KCS_CA_CERT}means the authentication is performed, and the scanner started in CI/CD can make sure the receiving server is authentic.-e SKIP_API_SERVER_VALIDATION=truemeans authentication of the receiving server using the CA certificate of the Ingress controller is not performed.
- Creating Jenkins environment variables.
To create environment variables, add the following lines to Jenkinsfile:
- Add information about the container registry where the scanner is located as follows:
LOGIN: the name of the account in the scanner registryPASS: the password for the scanner registry - If you configure scanning for a private repository, specify the following authorization data to ensure the scanner access to an image:
COMPANY_EXT_REGISTRY_USERNAME: the name of the account in the registry of the scanned imageCOMPANY_EXT_REGISTRY_PASSWORD: the password for the registry of the image being scanned - To use a certificate for secure connection to the registry, specify the certificate data in the
COMPANY_EXT_REGISTRY_TLS_CERTenvironment variable as a string in the .PEM format:-----BEGIN CERTIFICATE-----\n... <certificate details> ...\n-----END CERTIFICATE-----. - Specify the following variables for communication using a proxy server:
HTTP_PROXY–<proxy server for HTTP requests>HTTPS_PROXY–<proxy server for HTTPS requests>NO_PROXY–<domains or appropriate domain masks to be excluded from proxying>
- Add information about the container registry where the scanner is located as follows:
- Adding information to start the scanner. Information for starting the scanner that contains databases of vulnerabilities and other malicious objects is added to the Jenkinsfile configuration file in the form of a declarative or scripted pipeline.
Example of information for starting the scanner in the form of a declarative pipeline
Example of data for starting a scanner in the form of a scripted pipeline
- Generating an artifact for downloading.
You can generate an artifact for downloading in the .HTML, or .JSON format to receive the scan results. You can specify an artifact format in
--stoutas follows:pipeline {agent anystages {stage('run scanner') {steps {sh 'docker login -u ${LOGIN} -p ${PASS} company.example.com'sh 'docker run -e API_BASE_URL=https://kcs.int.company.com -e SKIP_API_SERVER_VALIDATION=true -e API_TOKEN=${API_TOKEN} -e COMPANY_EXT_REGISTRY_USERNAME=${COMPANY_EXT_REGISTRY_USERNAME} -e COMPANY_EXT_REGISTRY_PASSWORD=${COMPANY_EXT_REGISTRY_PASSWORD} company.example.com:5050/company/kcs/scanner:v2.0.1-lite jfrog.company.com/demo-kcs/bad:bad-project-test --html --stdout > result.html'}}stage('archive') {steps {archiveArtifacts artifacts: 'result.html'}}}}To generate a .JSON artifact, rewrite the
--html --stdout> result.html'line in the example above as follows:--stdout > result.json',and in the
archiveArtifacts artifactsline, specify the file name in the defined format: 'result.json'.Scan results can be obtained in the format you specified and can also be viewed in the Resources → CI/CD section.
Configuring integration with TeamCity CI/CD
To configure integration with TeamCity CI/CD:
- Copy the API token on the My profile page to authorize the Kaspersky Container Security API in TeamCity.
- In the settings menu in the TeamCity web interface, select Build Configuration Home → Parameters.
- Click Add new parameters to add the values of the following environment variables:
API_TOKEN— specify the copied value of the Kaspersky Container Security API token.API_BASE_URL— specify the URL of Kaspersky Container Security.RUST_BACKTRACE— If necessary, specifyfullto use backtracing.SKIP_API_SERVER_VALIDATION— specifytrueif you are using a self-signed certificate or if you need to skip authentication of the receiving server using the CA certificate of the Ingress controller.COMPANY_EXT_REGISTRY_USERNAME– specify the account name in the registry of the scanned image.COMPANY_EXT_REGISTRY_PASSWORD– specify the password for the registry of the scanned image.COMPANY_EXT_REGISTRY_TLS_CERT– specify details of the certificate for secure connection to the registry.The certificate details are specified as a string in the .PEM format:
-----BEGIN CERTIFICATE-----\n... <certificate details> ...\n-----END CERTIFICATE-----.HTTP_PROXY– a proxy server for HTTP requestsHTTPS_PROXY– a proxy server for HTTPS requestsNO_PROXY– domains or appropriate domain masks to be excluded from proxying
- Go to the Build Configuration Home → Build Step: Command Line section and click Add build step to add a build step.
- In the window that opens, specify the following settings of the build step:
- In the Runner type drop-down list, select Command Line.
- In the Run drop-down list, select Custom script.
- In the Custom script field, specify the path to the container for scanning (for example,
/bin/sh /entrypoint.sh nginx:latest).
- Under Docker Settings, specify the following settings:
- In the Run step within Docker container field, specify the address of the scanner in the Docker registry. For example,
company.gitlab.cloud.net:5050/companydev/example/scanner:v2.0.0-with-db. - In the Additional docker run arguments field, increase the privilege value to
--privileged.
- In the Run step within Docker container field, specify the address of the scanner in the Docker registry. For example,
- Click Save to save the settings.
- Click Run in the upper-right corner of the page to start the build.
- If necessary, download the scan results artifact, which is available on the Artifacts tab on the build scan results page in the TeamCity web interface.
Defining the path to container images
To start scanning, the solution needs to determine the path to the container images that need to be scanned. The path to container images can be specified in two ways:
- By specifying an image tag after the registry name, repository name, and image name. The tag is a changeable and easy-to-read description of the image.
In this case, the path looks as follows:
<registry>/<repository>/<image name>:<tag>. For example, http://docker.io/library/nginx:1.20.1. - By specifying an image digest after the registry name, repository, and image name. A digest is an integral internal property of an image, specifically a hash of its contents (the SHA256 hash algorithm is used).
When using a digest, the path is formed as follows:
<registry>/<repository>/<image name><digest>. For example, http://docker.io/library/nginx@sha256:af9c...69ce.
A tag can match different digests, whereas digests are unique for each image.
Depending on the method used to specify the image path, Kaspersky Container Security performs one of the following actions before scanning:
- Converts the tag to a trusted digest.
- Checks whether the digest specified in the image path is trusted. A digest is considered trusted if it ensures the required degree of confidence in maintaining the desired protection relative to the object encoded using the hash algorithm.
Only trusted digests are sent to the container runtime.
Before running a container, the content of the image is compared with the received digest. To recognize a digest as trusted and the image as not corrupted, Kaspersky Container Security checks the integrity and authenticity of the image signature.
Monitoring the integrity and origin of images
When scanning images in CI/CD, Kaspersky Container Security protects against image spoofing at the registry level. The integrity and origin of images of containers deployed in an orchestrator cluster is controlled by verifying image signatures, starting at the build stage in CI.
Image integrity is monitored in two stages:
- Container images are signed after they are created. This process is implemented using external signature applications.
- Image signatures are checked before images are deployed.
The solution saves a signature key, which is based on the SHA256 hash function and used as the code for signature validation. When deployed in an orchestrator, Kaspersky Container Security asks the signature server to confirm the authenticity of the signature.
Kaspersky Container Security checks image signatures as follows:
- In the Administration → Integrations → Image signature validators section, you can configure the settings for integrating the solution with external image signature validation applications.
- In the Policies → Runtime → Policies section, a runtime policy is added to protect the content of the image. This runtime policy validates the authenticity of signatures. Digital signatures are validated based on the configured image signature validators.
- The orchestrator starts image deployment and uses a to make a deployment request to the agent (kube-agent).
To send the request to the Kaspersky Container Security agent, configure the dynamic admission controller in the values.yaml configuration file.
- Based on the applicable runtime policy, the agent checks the signature validation settings configured in the Administration → Integrations → Image signature validators section.
- If the check confirms the authenticity and validity of the signature, the solution allows image deployment. Otherwise, deployment is blocked.
Running the scanner in SBOM mode
Kaspersky Container Security allows you to start a scanner to check images for vulnerabilities in
mode. In this case, the solution scans a specially created SBOM file instead of a TAR archive.The advantages of using SBOM are the following:
- Less resources required to scan images for vulnerabilities.
- Reduced scanning time due to automatic verification of correct operation and proper use of solution components.
- Capability to scan all existing vulnerabilities in an image without exceptions.
- High reliability of scanning results.
In CI/CD, the scanning process consists of two stages: receiving an SBOM file and scanning an image based on the received SBOM file. The image scanning process is implemented as follows:
- The CI/CD scanner generates a list of image components and sends the generated artifact to Kaspersky Container Security.
- Using the image handler, the solution forwards the received SBOM file to the scanner for scanning.
To scan in SBOM mode, Kaspersky Container Security runs a scanner with pre-installed databases containing information about vulnerabilities and other malicious objects (
scanner:v2.0-with-db,scanner:v2.0-with-db-java).
To scan images in CI/CD, you must specify the values of the following environment variables in the file:
API_TOKEN– the value of the Kaspersky Container Security API token is specified.API_BASE_URL– Kaspersky Container Security URL is specified.API_CA_CERT– details of the CA certificate of the Ingress controller are specified, which allows the scanner running in CI/CD to verify the authenticity of the data receiving server. If you use a self-signed certificate, or want to skip checking the data receiving server using the CA certificate of the Ingress controller, the value of the variable to skip the check is provided as follows:SKIP_API_SERVER_VALIDATION: 'true'
COMPANY_EXT_REGISTRY_USERNAME– specify the account name in the registry of the scanned image.COMPANY_EXT_REGISTRY_PASSWORD– specify the password for the registry of the scanned image.COMPANY_EXT_REGISTRY_TLS_CERT– specify details of the certificate for secure connection to the registry.The certificate details are specified as a string in the .PEM format:
-----BEGIN CERTIFICATE-----\n... <certificate details> ...\n-----END CERTIFICATE-----.HTTP_PROXY– a proxy server for HTTP requestsHTTPS_PROXY– a proxy server for HTTPS requestsNO_PROXY– domains or appropriate domain masks to be excluded from proxying
For subsequent scanning, Kaspersky Container Security generates a report in the CycloneDX format. You can also generate an artifact with SBOM to download within the CI/CD process in the
or format.To generate an SBOM file in the .SPDX format when the scanner operates with SBOM creation:
Enter the following command in the .gitlab-ci.yml configuration file:
- /bin/sh /entrypoint.sh $SCAN_TARGET --sbom --spdx --stdout > example.spdx
where:
<--sbom> indicates the creation of an SBOM file.
<--spdx> indicates that an artifact is generated in the .SPDX format.
<--stdout > example.spdx> indicates data output to a file in the .SPDX format.
To generate an SBOM file in the .СDX format when the scanner operates with SBOM creation:
Enter the following command in the .gitlab-ci.yml configuration file:
- /bin/sh /entrypoint.sh $SCAN_TARGET --sbom --cdx --stdout > example.cdx.json
where:
<--sbom> indicates the creation of an SBOM file.
<--cdx> indicates that an artifact is generated in the .CDX format.
<--stdout > example.cdx.json> indicates data output to a file in the .JSON format.
The resulting file (for example, example.cdx.json) is specified as an artifact: artifacts: paths:
Scanning using an SBOM file is only applicable when scanning an image for vulnerabilities. If your CI/CD process requires scanning for other risks and threats (such as misconfigurations), you must separately run the corresponding scanning and add its results to the image handler in addition to the SBOM file.
Page top
Running the scanner in lite SBOM mode
Kaspersky Container Security allows you to start a scanner to check images for vulnerabilities in the lite SBOM mode. In this case, the solution scans a specially created SBOM file, and the results of this scan become available at the CI/CD stage.
Data from listening to and intercepting network traffic must be securely transferred between the CI/CD environment and the solution.
You can generate an artifact for download in the .SPDX, .HTML, .JSON or .CDX format to receive the results.
Scan results can be obtained in the format you specified and can also be viewed in the Resources → CI/CD section.
Running a scanner in GitLab
To start the scanner in lite SBOM mode in GitLab, when configuring image scanning in CI/CD process, edit the .gitlab-ci.yml configuration file as follows:
- Add information about the image of the scanner that is started for image scanning in CI/CD as follows:
scan_image:stage: scannerimage:name:repo.cloud.example.com/repository/company/scanner:v.2.0.0-liteentrypoint: [""]pull_policy: always - Specify the orchestration platform tag as follows:
k8s
In the example provided, the
k8stag is specified for Kubernetes, you can also specify the tag for another supported orchestration platform. - Specify such variables as the build ID, image registry data of the scanned image and certificate for secure connection to this registry, pipeline ID, and API token for authorization of requests from the CI/CD scanner in Kaspersky Container Security as follows:
SCAN_TARGET: ${CI_REGISTRY_IMAGE}:master
COMPANY_EXT_REGISTRY_USERNAME: ${COMPANY_EXT_REGISTRY_USERNAME}
COMPANY_EXT_REGISTRY_PASSWORD: ${COMPANY_EXT_REGISTRY_PASSWORD}
COMPANY_EXT_REGISTRY_TLS_CERT: ${COMPANY_EXT_REGISTRY_TLS_CERT}BUILD_NUMBER: ${CI_JOB_ID}
BUILD_PIPELINE: ${CI_PIPELINE_ID}
API_TOKEN:
<API token value>HTTP_PROXY–<proxy server for HTTP requests>HTTPS_PROXY–<proxy server for HTTPS requests>NO_PROXY–<domains or appropriate domain masks to be excluded from proxying>The details of the certificate for secure connection to the image registry in the
COMPANY_EXT_REGISTRY_TLS_CERTvariable are specified as a string in the .PEM format:
-----BEGIN CERTIFICATE-----\n...certificate details> ...\n-----END CERTIFICATE-----. - If necessary, specify a variable for scanning the API certificate of the solution:
API_CA_CERT: ${KCS_CA_CERT}
If the
API_CA_CERTvariable is not set, scanning will start but will not be completed. - Specify the web address of the API host server for Kaspersky Container Security:
API_BASE_URL:
<web address> - Specify the command to create an artifact when the scanner is started in one of the following supported formats:
- To generate an artifact in the .JSON format:
script:
- /bin/sh /entrypoint.sh $SCAN_TARGET --stdout > artifact-result.json
artifacts:
paths:
- artifact-result.json
- To generate an artifact in the .HTML format:
script:
- /bin/sh /entrypoint.sh $SCAN_TARGET --html --stdout > artifact-result.html
artifacts:
paths:
- artifact-result.html
- To generate an SBOM artifact in the .SPDX format:
script:
- /bin/sh /entrypoint.sh $SCAN_TARGET --spdx --stdout > artifact-result.spdx
artifacts:
paths:
- artifact-result.spdx
- To generate an SBOM artifact in the .JSON format:
script:
- /bin/sh /entrypoint.sh $SCAN_TARGET --cdx --stdout > artifact-result.cdx.json
artifacts:
paths:
- artifact-result.cdx.json
- To generate an artifact in the .JSON format:
Running a scanner outside of the CI / CD process
In case of limited resources, you can run the Kaspersky Container Security scanner apart from the worker nodes in the CI/CD process. For example, by using the docker run command on a Docker node, or as a Job in a Kubernetes cluster.
To save resources to the greatest extent possible, we recommend using the scanner: 2.0.0-lite image, as it does not contain vulnerability databases and sends the SBOM file based on the target image scan results to the solution using the API.
To start Kaspersky Container Security scanner outside the CI/CD process, you must specify the following mandatory parameters:
API_TOKEN: <API token value>is the Kaspersky Container Security user token for authentication in the API interface of the solution.API_BASE_URL: <web address>is a link to access the API interface of Kaspersky Container Security. The interface can be accessed using the HTTP and HTTPS protocols, depending on the environment variables of the deployed solution.API_CA_CERT: <certificate in the .PEM format>is a variable for validation of the API certificate of the solution.SKIP_API_SERVER_VALIDATION = true- a variable that, if necessary, can be specified to skip the validation of the API certificate of Kaspersky Container Security.
You can also specify additional parameters for the scanner operation:
COMPANY_EXT_REGISTRY_USERNAME: <registry user name>is the name of the user of the registry where the image to be checked by the scanner is stored.COMPANY_EXT_REGISTRY_PASSWORD: <registry user password>is the password of the user of the registry where the image to be checked by the scanner is stored.BUILD_NUMBER: <ID of the build number>is the ID that is used to track the build number in the solution interface. Kaspersky Container Security displays the number in the CI\CD process scan results.BUILD_PIPELINE: <pipeline number ID>is the identifier that is used to track the pipeline number in the solution interface. Kaspersky Container Security displays the number in the CI\CD process scan results.HTTP_PROXY: <proxy server for HTTP requests>is a variable that indicates the use of an HTTP proxy server when access to external resources is requiredHTTPS_PROXY: <proxy server for HTTPS requests>is a variable that indicates the use of an HTTPS proxy when access to external resources is requiredNO_PROXY: <domains or masks corresponding to domains that are used for exclusion from proxying>is a variable that indicates the locally available resources if a proxy server is used.
Running the scanner as a Job in a Kubernetes cluster
Page top
Getting scan results in JSON or HTML format
When using Kaspersky Container Security to scan images in CI/CD, you can generate and save an artifact with the scan results within your CI/CD platform. This can be done using a configuration file of the external repository system that is integrated with the solution. For example, you can use a .gitlab-ci.yml configuration file in GitLab.
You can generate an artifact containing scan results in the following scenarios:
- When the scanner conducts a complete CI/CD scan - scanning results file can be generated in the .HTML format or the .JSON format.
- When the scanner operates with SBOM creation - file containing scanning results can be generated in the .SPDX format or the .JSON format.
To generate a scan results file in .HTML format:
Enter the following command in the .gitlab-ci.yml configuration file:
- /bin/sh /entrypoint.sh $SCAN_TARGET --html --stdout > example.html
where:
<--html> indicates that an artifact is generated in .HTML format.
<--stdout > example.html> indicates data output to a file in .HTML format.
To generate a scan results file in .JSON format when performing a complete CI/CD scan:
Enter the following command in the .gitlab-ci.yml configuration file:
- /bin/sh /entrypoint.sh $SCAN_TARGET --stdout > example.json
where:
<--stdout > example.json> indicates data output to a file in .JSON format.
The resulting file (for example, example.json) is specified as an artifact: artifacts: paths:
Specifying secrets when starting a scan
When starting a scan job in the CI/CD process, the registry containing the scanner image (the lite or with-db scanner for the corresponding version of Kaspersky Container Security) can be accessible only after authorization. For authorization, you can pass the required secrets in the scan job.
To be authorized for access to the registry when starting a scan job:
- Create a secret:
kubectl create secret docker-registry ci-creds --docker-server=client.repo.example.com --docker-username=username --docker-password=password - In the scan job, specify the value of the
imagePullSecretsvariable:imagePullSecrets:- name: ci-creds - Start the scan job.
In this example, the scan job contains the following secrets:
- The secret for downloading the scanner image (specified in the
imagePullSecretsvariable). - The password for downloading the image to be scanned if access to the relevant registry is restricted (specified in the
COMPANY_EXT_REGISTRY_PASSWORDvariable).
You can omit these passwords if the registry that the solution gains access to when running a scan job is accessible without authorization.
Page top
Configuring integration with image signature validators
Kaspersky Container Security can verify the authenticity and validity of the digital signatures of images. To use this functionality, you need to configure integration of the solution with one or more external signature applications. The specifics of signing an image digest, the location of signatures, and protecting signatures depend on the signature application you have selected. The solution supports two configurable external signature validation applications:
- Notary v1 is a web service developed by Docker that is used to ensure the security of containers at various stages of their life cycle, including the creation and subsequent storage of signatures.
- Cosign is a web service designed to create signatures for containers, verify signatures, and place signed containers in repositories. The tool was developed as part of the project.
You can configure integration with an image signature validator in the Administration → Integrations → Image signature validators section.
Page top
Viewing the list of integrations with signature validators
In the Administration → Integrations → Image signature validators section, a table of all configured integrations with image signature validators is displayed.
The table displays the following information about the integrated image signature validators:
- Name of the validator
- Description, if one was specified when creating the integration
- Type of the image signature validator—Notary v1 or Cosign.
- Web address to which the image signature validator connects
In the table, you can:
- Add new integrations with signature verification modules. Click Add signature validator above the list to open the integration settings window.
- View and edit the settings for integration with an image signature verification module. You can open the editing window by clicking the link on the verification module name.
- Remove an integration with an image signature validator.
Adding an integration with an image signature validator
To add an integration with an image signature validator:
- In the Administration → Integrations → Image signature validators section, click the Add signature validator button.
The integration settings window opens.
- In the General information section, enter a policy name and, if necessary, a policy description.
- In the Type section, select one of the following signature validators:
- Notary v1.
- Cosign.
- Depending on the selected signature validator, specify the server authentication credentials:
- For Notary v1, specify the following settings:
- Web address – the full web address of the server where image signatures are stored.
- Signature server authentication secret name – the name of the orchestrator secret with credentials for accessing the server where image signatures are stored.
The secret must be in the Kaspersky Container Security namespace.
- Certificate – a self-generated certificate for the server where signatures are stored. The certificate is provided in .PEM format.
- Delegations – list of signature holders participating in the signing process.
- Under Trusted roots, specify the pairs of all public keys that the solution will check during signature verification. A key pair includes the name and value of the key.
If necessary, you can add additional keys by clicking the Add key pair button. The solution supports up to 20 key pairs.
- For Cosign, specify the following settings:
- Signature server authentication secret name – the name of the orchestrator secret with credentials for accessing the server where image signatures are stored.
The secret must be in the Kaspersky Container Security namespace.
- Certificate – a self-generated certificate for the server where signatures are stored. The certificate is provided in .PEM format.
- Under Trusted roots, specify the pairs of all public keys that the solution will check during signature verification. A key pair includes the name and value of the key.
For Cosign, specify the public keys for the ECDSA or RSA algorithms provided by cosign.pub.
If necessary, you can add additional keys by clicking the Add key pair button. The solution supports up to 20 key pairs.
- In the Signature requirements section, specify the minimum number of signatures and signature holders who must sign the image.
- Signature server authentication secret name – the name of the orchestrator secret with credentials for accessing the server where image signatures are stored.
- For Notary v1, specify the following settings:
- Click the Save button in the top of the window to save the settings for integration with an image signature validator.
You can use the configured integration in runtime policies to ensure protection of the image content.
Page top
Viewing and editing information about integration with an image signature validator
To view and edit the settings for integration with an image signature validator:
- In the Administration → Integrations → Image signature validators section, click the integration name link in the list of integrations with signature validators.
- If necessary, in the window that opens, edit the integration settings, which depend on the selected signature validator, as follows:
- For Notary v1, you can modify the following settings:
- Validator name.
- Description.
- URL.
- Signature server authentication secret name.
- Certificate.
- Delegations.
- Key name.
- Key value.
- For Cosign, you can modify the following settings:
- Signature server authentication secret name.
- Certificate.
- Key name.
- Key value.
- Threshold.
- Required signers.
- For Notary v1, you can modify the following settings:
- If necessary, add key pairs by clicking the Add key pair button.
- Click the Save button in the upper part of the window.
Removing an integration with an image signature validator
To remove an integration with an image signature validator:
- Open the list of the configured integrations with image signature validators.
- Select the integration that you want to delete by selecting the check box in the row with the integration name.
- Click Delete above the table.
The Delete button becomes enabled after you select one or more integrations.
- In the window that opens, confirm the deletion.
Setting up integration with notification outputs
Kaspersky Container Security can notify users about events while operating in accordance with the response policy settings. To use the notification feature, you should set up an integration of Kaspersky Container Security with one or more notification outputs.
Kaspersky Container Security can use the following outputs:
- Telegram instant messaging system
Viewing the list of integrations with outputs
To view the list of configured integrations with outputs:
- Go to the Administration → Integrations → Notifications section.
- Depending on the type of notification you want, go to the Email tab or the Telegram tab.
The table with a list of all configured integrations displays the following information about existing integrations:
- Integration name.
- Updated by.
- Date and time of the last update.
- Status of the last connection to the output—Success or Error. If Error is displayed, the solution also displays a brief description of the connection error.
In the table, you can:
- Add new integrations with email or Telegram. Click Add integration above the table to open the integration settings window.
- View and edit the settings of integration with outputs. You can open the editing window by clicking the integration name link.
In this window, you can also click Test connection to see if integration with an output is completed.
- Delete integration with outputs.
Adding email integrations
To add an email integration:
- Under Administration → Integrations → Notifications, in the Email section, click Add integration.
The integration settings window opens.
- Specify the following information in the form:
- Name of the integration — Displayed in the response policy settings.
- User name and password of the account used to send messages.
- SMTP server name.
- E-mail encryption method.
- Port that the SMTP server uses.
- Email address of the message sender.
- Email addresses of message recipients. You can enter one or more addresses in this field.
- Click Test connection to see if a connection with email can be established.
- Click Add to save the email integration settings.
Example email integration settings
You can use the configured integration in response policies.
Page top
Viewing information about email integration
To view and change an email integration:
- In the Email section, under Administration → Integrations → Notifications, click the integration name link in the list of integrations.
- In the editing window that opens, change the following integration settings if necessary:
- Name.
- User name.
- Password of the user account that is used to send messages.
- SMTP server name.
- E-mail encryption method.
- Port that the SMTP server uses.
- Email address of the message sender.
- Email addresses of message recipients.
- Click Test connection to see if a connection with email can be established.
- Click Save.
Adding Telegram integrations
To add a Telegram integration:
- Under Administration → Integrations → Notifications, under Telegram, click Add integration.
The integration settings window opens.
- Specify the following information in the form:
- Name of the integration — Displayed in the response policy settings.
- ID of the chat to post the messages — you can get the ID in the following way:
- Write the first message to the message bot. The chat ID is generated the first time a message is sent.
- In the address bar of your browser, type:
https://api.telegram.org/bot<token>/getUpdateswhere <token> is the token of the message bot.
- In the received .json response file, find the "ID" value in the "chat" object. This is the chat ID.
After changing the message history visibility settings for new participants in a Telegram chat, the chat ID is also changed. In this case, you must change the Telegram integration settings and specify the new value for the chat ID.
- Token of the message bot — you receive this token as a result of executing the
/newbotcommand in the BotFather bot to create a bot. You can also get the token of a previously created bot by running the/tokencommand.
- Click Test connection to see if a connection with Telegram can be established.
- Click Add to save the Telegram integration settings.
Example Telegram integration settings
You can use the configured integration in response policies.
Page top
Viewing and editing information about integration with Telegram
To view and change a Telegram integration:
- Under Telegram in the Administration → Integrations → Notifications section, click the integration name link in the list of integrations.
- In the editing window that opens, change the following integration settings if necessary:
- Name.
- Chat ID.
- Bot token.
- Click Test connection to see if a connection with Telegram can be established.
- Click Save.
Deleting integrations with notification outputs
To delete email integration or Telegram integration:
- Open the list of configured email or Telegram integrations in the Administration → Integrations → Notifications section.
- Select the integration that you want to delete by selecting the check box in the row with the integration name.
- Click Delete above the table.
The Delete button becomes enabled after you select one or more integrations.
- In the window that opens, confirm the deletion.
You cannot delete an integration that is used in one or more response policies.
Page top
Configuring LDAP server integration
Kaspersky Container Security lets you connect to servers of external
that are used in your organization . This is an integration with a specific group in .Connection to an external directory service over the LDAP protocol enables you to perform the following tasks:
- Configure user accounts to take into account data from an external directory service for working with Kaspersky Container Security.
- Correlate user roles in Kaspersky Container Security to groups of users from Active Directory. Users in these groups will be able to use their domain account credentials to log in to the solution web interface and access application functionality based on their assigned role.
We recommended that you create these user groups in Active Directory in advance to allow them to complete authorization using their domain accounts in the Kaspersky Container Security web interface.
An email address must be indicated for user accounts in Active Directory.
Creating LDAP server integration
To create an integration with an LDAP server:
- In the Administration → Integrations → LDAP section, click the Connect server button.
The LDAP server settings window opens.
- Select certificate validation mode for connection to the LDAP server. By default, Certificate chain mode is specified and the certificates saved by Kaspersky Container Security during the first connection to the LDAP server are verified. You can also select Root certificate mode and enter your root certificate details in the corresponding text field.
Do not change the default certificate validation mode unless you are using a root certificate to connect to the LDAP server.
- Specify the following required settings:
- Web address (URL) of your company's LDAP server.
The web address of the LDAP server is specified as follows:
ldap://<host>:<port>. For example:ldap://ldap.example.com:389. - The name and password of the technical user account.
Bind DN is the distinguished name of the technical user account that is necessary for initial authentication and searching for a user in Active Directory.
You can specify the name of the technical user account in full or in the <
login@domain>format if your LDAP server supports this name format for authentication.In the Bind DN password field, you must enter the password corresponding to the specified account name.
Before updating the solution, make sure that the Bind DN and Bind DN password fields are filled in. If these settings are not specified, LDAP server integration will not work.
- Base DN is the name that uniquely identifies and describes a record of the LDAP directory server.
For example, the base distinguished name for example.com is
dc=example,dc=com.
- Web address (URL) of your company's LDAP server.
- If necessary, Kaspersky Container Security cane use available data to fill in the remaining fields of the integration creation form. To this end, depending on why you are creating the integration, do one of the following:
- If you want to create an integration with the server using the LDAP protocol, click the Autofill as LDAP button.
- If you want to configure the integration directly for the group in the Active Directory service that is associated with your role in Kaspersky Container Security, click the Autofill as Active Directory button.
Kaspersky Container Security specifies attributes of parameter values, not the values themselves. For example, the solution specifies an attribute of the user name that can be used to find the user, not the user name directly.
The solution populates the integration creation form with the following attributes of parameter values:
- User filter for defining the user search settings in Active Directory.
- Group filter for defining the group search settings in Active Directory.
Kaspersky Container Security uses the most general filter values to ensure operation for virtually all possible configurations. When configuring User filter and Group filter, we recommend that you store only those attribute values that are used in Active Directory.
- Under Base schema, the solution specifies the following settings:
- Organizational unit name attribute
- Distinguished name attribute
- Under User lookup schema, the solution specifies the following settings:
- User first name attribute.
- User lastname attribute.
- Group name attribute.
- User username.
- Group member.
- User email attribute.
- User member of.
If necessary, you can edit the values specified by the solution in the integration creation form.
- To check if the values are specified correctly, click Test connection.
Kaspersky Container Security will display a notification informing you of the successful connection to the LDAP server or a failure to establish the connection.
- Click Save.
If the LDAP server certificate changes, reconfigure the integration.
You can use the configured integration when creating and assigning user roles.
Page top
Viewing, configuring, or deleting an LDAP server integration
To view the LDAP server connection:
Go to the Administration → Integrations → LDAP section.
Kaspersky Container Security displays the following information about the connected LDAP server:
- The web address of the connected LDAP server.
- The status of the last server connection—Success, Not available, or Error. If Error is displayed, the solution also displays a brief description of the connection error.
To edit LDAP server integration settings:
In the Administration → Integrations → LDAP section, click the Edit settings button.
Kaspersky Container Security opens the page containing the form for LDAP server integration data.
To delete an integration with an LDAP server:
- In the Administration → Integrations → LDAP section, click Delete integration.
- In the window that opens, confirm the deletion.
Testing connection with LDAP server
To test connection with the LDAP server:
- Go to the Administration → Integrations → LDAP section.
- Do one of the following:
- If the integration with the LDAP server is created, click the Test connection button.
- If you are creating an integration with an LDAP server or editing its settings, click Test connection below the form for LDAP server integration data.
Kaspersky Container Security will display a notification informing you of the connection to the LDAP server or a failure to establish the connection.
Gaining access to Active Directory group
After the integration with the LDAP server is configured, you can specify an Active Directory group for each Kaspersky Container Security role. After authorizing their account credentials, the users from this group gain access to solution functionality based on their defined roles.
Page top
Configuring integration with SIEM systems
Kaspersky Container Security allows connecting to
to send event messages for analysis and subsequent response to potential threats. The messages contain data for the same types and categories of events that are logged in the security event log. The transmission of data about cluster node monitoring events is also achieved by integrating with SIEM systems and linking agent groups to them.Messages are sent to a SIEM system in the
format, for example:CEF:0|Kaspersky|Kaspersky Container Security|2.0|PM-002|Process management|7|dpid=1846367 spid=1845879 flexString2=0ce05246346b6687cb754cf716c57f20f226e159397e8e5985e55b448cb92e3f flexString2Label=Container ID cs6=alpine cs6Label=Container name outcome=Success
The transmitted message consists of the following components:
- The header, which specifies the date, time, and host name.
- Prefix and CEF version number.
- Device vendor.
- Solution name.
- Solution version.
- Solution-generated unique event type code.
- Event description.
- Event severity assessment.
- Additional information, such as device IP address, event reason, event result, and event status.
For detailed information about the components, refer to the CEF message value matching table.
Matching of CEF message fields
CEF messages are sent in the English language.
The table below lists the man components of the header and body of CEF messages sent by Kaspersky Container Security.
Components and values of CEF message components
Component |
Value |
Example |
|---|---|---|
Standard header of the CEF message (syslog header) |
The header is sent in the following format: |
|
CEF format prefix and version |
|
|
Event ID |
Device Vendor Device Product Device Version |
|
Unique ID of the event type (Signature ID) |
Kaspersky Container Security sends the following event type IDs:
|
Some of the event type IDs sent by the solution:
|
Event description (Name) |
The description must be user-readable and relevant to the event type ID. For example, 'Administration' for ADM or 'Process management' for PM. |
Some of the event names sent by the solution:
|
Importance of the event (Severity) |
The severity of the event on a scale from 0 to 10 is determined as follows:
The severity score of an event depends on the event type and status (Success or Failure). |
For example, the severity score can be determined as follows:
|
Additional information about the event (Extension) |
Additional information may include one or more sets of key-value pairs. |
Information about the key-value pairs that Kaspersky Container Security transfers is provided below. |
Additional information about an event which is transferred by Kaspersky Container Security
Creating an integration with a SIEM system
To add a SIEM integration:
- In the Administration → Integrations → SIEM section, click Add SIEM.
A sidebar is displayed, in which you can enter the parameters of SIEM system.
- On the General tab, specify the following required parameters:
- Name of the SIEM system.
- Protocol for connecting to the SIEM system. TCP is selected by default.
- Address of the SIEM system server in one of the following formats:
- IPv4
- IPv6
- FQDN
- Port for connecting to the SIEM system. You can specify ports 1 through 65535. The default setting is 514.
- Event categories for which you want messages to be exported to the SIEM system. To configure this, select the check boxes next to one or more event categories from the following list:
- Administration.
- Alert.
- CI/CD.
- Policies.
- Resources.
- Scanners.
- Admission controller.
- Forensic data.
- API.
An advanced license is required to view events in the Resources, Scanners, Admission controller, and Forensic data categories.
By default, all statuses are selected.
Messages about selected event categories are sent to the specified SIEM system, regardless of whether it is linked to agent groups.
- On the Agent group logs tab, select the check boxes next to one or more event types as part of node monitoring in the runtime.
The log of event messages sent to the runtime environment can be very large, which can impact available disk space and network load.
- If you want to verify the correctness of the specified SIEM integration parameters, click Test connection.
The solution tests the connection to the SIEM system if the TCP connection protocol is selected. If the UDP connection protocol is selected, the Test connection button is disabled.
- Click Save.
Linking agent groups with a SIEM system
You can link agent groups to SIEM systems while creating agent groups or editing their parameters in the Components → Agents section.
To link an agent group in Kaspersky Container Security, you must have sufficient rights to manage agent groups; you must also create and configure at least one SIEM integration.
Viewing and editing SIEM integration settings
To view a SIEM integration:
- Open the list of SIEM integrations in the Administration → Integrations → SIEM section.
- Click the integration name in the list of integrations.
To edit SIEM integration settings:
- In the Administration → Integrations → SIEM section, click the integration name in the list of integrations.
- If necessary, in the displayed sidebar, edit the integration parameters as follows:
- On the General tab, edit the following required parameters:
- Name of the SIEM system
- Protocol for connecting to the SIEM system
- SIEM system server address
- SIEM system connection port
- Categories of events to be exported
- If necessary, on the Agent group logs tab, you can edit the list of network node monitoring event types selected for the runtime.
- On the General tab, edit the following required parameters:
- If TCP is used for the connection, click Test connection to see if the connection to the SIEM system is can be established.
- Click Save.
Deleting an integration with a SIEM system
To delete a SIEM integration:
- Open the list of configured SIEM integrations in the Administration → Integrations → SIEM section.
- Select the integration that you want to delete by selecting the check box in the row with the integration name.
- Click Delete above the table.
The Delete button becomes enabled after you select one or more integrations.
- In the window that opens, confirm the deletion.
Integrating with HashiCorp Vault
Kaspersky Container Security provides the ability to securely transfer passwords, tokens, and secrets using HashiCorp Vault, an external storage service. The solution generates pod annotations, which the Vault injector uses to mount the necessary secrets from storage at startup.
Kaspersky Container Security supports integration with Hashicorp Vault 1.7 or later.
Version 2.0 of Kaspersky Container Security supports working with HashiCorp Vault only in sidecar mode using sidecar containers; in this case, only the Kubernetes authentication method is supported.
If the service accounts for pods are not defined, and default service accounts are used, we recommend against assigning roles dedicated to the storage to such service accounts, in line with a critical security requirement.
Values of HashiCorp Vault settings are specified in the values.yaml configuration file and deployed when the Helm Chart package is launched.
HashiCorp Vault settings are configured in the values.yaml configuration file as follows:
- If the
enabledsetting in thevaultblock is set tofalse, integration with the vault is not used. - If the
enabledsetting in thevaultblock is set totrue, integration with the vault is enabled, and the values of the variables in thevaultsettings block take precedence.
The vault settings block contains the following sections:
secret– to specify secrets and credentials.certificate– to specify certificates and certificate keys.
The secret section lists the paths to files that contain the secrets for the following parameters:
- Secrets of proxy servers for requests to the external information environment.
- Credentials for the PostgreSQL database.
- Credentials for an s3-compatible file storage for storing files that are generated by the solution.
- Credentials for the ClickHouse database management system.
Secrets are specified in key:value format
where:
<key>is the name of the environment variable<value>is the full path to the secret in the secret storage, followed by the @ sign and the name of the key of the secret created in the storage.
For example: POSTGRES_USER: kv/secret/kcs/psql@POSTGRES_USER
To get a certificate, in the vault.certificate section, you must specify the following in the fields:
- To get a CA certificate, the
casetting is set totrue.In this case, the path to access the certificate is formed based on the standardcert/capath based on the name in the public key infrastructure (Public Key Infrastructure, PKI). If the CA certificate is not a root certificate, use thecaListparameter to list all certificates, including the root certificate. For example:cert-ca:ca: truetls.crt: pki_kcs/cert/cacaList:- pki/cert/ca - To generate certificates and keys, you need to specify the path from the PKI name with the standard
issuepath and the name of the created role. The common name (cn) and all possible alternative names (altname) are automatically added to the certificate. If necessary, thecn,altnameandipsansvalues can be specified manually as shown below for an external database:cert-pguser:cn: pguseraltname: pguser,pguser.psql,pguser.psql.svc,pguser.psql.svc.cluster.local,localhostipsans: 0.0.0.0,127.0.0.1 - To set the certificate lifetime, you need to specify the value of the
ttlparameter. The default value is 8760 hours.The parameter value cannot be greater than the value set in the PKI HashiCorp Vault.
The certificate section also contains the paths to files that contain the following certificates and keys:
- CA certificate and client certificate for an external PostgreSQL database.
- Certificates required for the solution components:
- CA certificate and CA certificate key for the admission controller.
- Certificate and certificate key for the Kaspersky Container Security licensing module.
- Certificate and certificate key for the module with the solution's main business logic.
- Certificate and certificate key for the remote procedure call platform (GRPC).
- Certificate and certificate key for the scanner server.
- Certificate and certificate key for the scanner server API.
- Certificate and certificate key for the update file server for private corporate networks.
- Certificate and certificate key for s3-compatible file storage.
- Certificate and certificate key for the event broker.
- Certificate and certificate key for the agent broker.
- Certificate and certificate key for the ClickHouse database management system.
HashiCorp Vault storage settings:
For Kaspersky Container Security to work with HashiCorp Vault, you must specify the values of the following configuration settings in the values.yaml configuration file:
- The
enabledflag enables the integration with the storage. Thevault.enabled = truevalue indicates that the integration with HashiCorp Vault is established; the values of environment variables are obtained from the storage. The default value isfalse. mountPath— path to mount secrets from the Vault to the pod. The default is/vault/secrets.roleis the role to be used for authentication in the storage.When creating a role in Vault, you need to specify all existing values from the serviceAccount section in the values.yaml file.
agentInitFirst— variable for defining the initialization queue of the init container. A value oftrueindicates that the pod first initializes the Vault init container. This value must be set when other containers in the initialization require prepopulated secrets to function. If it is set tofalse, the order of initialization of the containers is randomized. The default value istrue.agentPrePopulate— variable for enabling the init container for prepopulating the shared memory with secrets before the containers are started. The default value istrue.agentPrePopulateOnly— variable that indicates whether the init container will be the only one injected in the pod. If it is set totrue, no sidecar container is added when the pod is run. The default value isfalse.preserveSecretCase— variable for preserving the case in the names of secrets when creating secret files. The default value istrue.agentInjectPerms— variable that defines rights to access the mounted file with secrets from the storage. The default value is0440(owner and group have the read permission).annotations— instructions that configure the correct operation of the sidecar container. You can add instructions to thevaultblock for use by all Helm Chart components or specify them in theArchitecturesection separately for each component, for example:kcs-middleware:enabled: trueappType: deploymentannotations:vault.hashicorp.com/agent-limits-cpu: 200m
Limitations related to storage
There is a number of non-critical limitations when Kaspersky Container Security works with HashiCorp Vault:
- Integration with HashiCorp Vault works only with KV1/KV2 storages and Secrets Engine components for rotating PKI certificates.
- The solution does not support working with external components of the Secrets Engine, except for PKI Secrets.
- Kaspersky Container Security does not support dynamic processing of secrets. To get an updated secret, you have to restart the solution.
- If you are using Vault integration, you can specify credentials only for an external PostgreSQL database in the
vaultsection. To use an internal PostgreSQL database, these credentials must be commented out.
Security policies configuration
Kaspersky Container Security components use the following security policies:
- Scanner policies determine the settings for scanning different types of resources. Scan policies use rules to detect sensitive data, as well as vulnerabilities, malware, and misconfiguration.
- Assurance policies define Kaspersky Container Security actions to provide security if vulnerabilities, malware, sensitive data and misconfigurations detected during image scanning meet the criteria specified in the policy.
- Response policies define the actions of the solution in case events specified in the policy occur. For example, Kaspersky Container Security can notify the user about an event.
- Runtime policies allow you to control and, where appropriate, restrict the deployment and operation of containers on the cluster in line with your corporate security requirements.
Kaspersky Container Security applies only enabled policies during its operation. Disabled policies cannot be used during checks.
Scanner policies
Scanner policy determines the settings for scanning different types of resources.
When installing Kaspersky Container Security, a default scanner policy is created; it can be applied to all resources and executed in all environments. It is called the global scan policy (default). This policy is assigned default scope by default.
You can enable, disable, or configure global scanner policy settings if your role has been assigned the rights to manage scanner policies and view the default scope.
The following actions cannot be performed on a global scanner policy:
- Change the assigned default scope.
- Remove the global scanner policy.
The list of configured scanner policies is displayed as a table in the Policies → Scanner policies section.
You can use the list to do the following:
- Add new policies. Click the Add policy button located above the table to open the policy settings window.
- Enable or disable policies by using the Disabled / Enabled toggle button in the Status column of the table.
- Change policy settings. You can open the editing window by clicking the policy name link.
You can also enable and disable policies in the edit window. Kaspersky Container Security does not use disabled policies when operating.
- Configure rules for detecting sensitive data. To do this, go to the Sensitive data tab.
- Delete policies.
Creating a scanner policy
Rights to manage scanner policy settings are required to add a scanner policy in Kaspersky Container Security.
To add a scanner policy:
- In the Policies → Scanner policies section, click the Add policy button.
The policy settings window opens.
- Use the Disabled / Enabled toggle switch to disable the added policy, if necessary. In this case, it will be added but not applied until it is activated.
By default, the status of a newly added scanner policy is Enabled.
- Enter a policy name and, if required, policy description.
- In the Scope field, select the scope for the scanner policy from the available options.
If you plan to implement the policy with the default scope, one of your user roles must be granted the rights to view default scopes.
- In the Vulnerabilities section, configure the following settings:
- Use the Disabled / Enabled toggle switch to configure scanning using the National Vulnerability Registry (NVD) databases.
- Use the Disabled / Enabled toggle switch to configure scanning using the Data Security Threats Database.
- In the Malware section, use the Disabled / Enabled toggle switch to configure scanning for malware in the image as part of the File Threat Protection component.
- In the Misconfigurations section, use the Disabled / Enabled toggle switch to configure a scan for configuration errors.
- Click Save.
Editing scanner policy settings
You can edit the scanner policy settings in Kaspersky Container Security if your account has been assigned at least one role that the policy's creator had at the time of the policy's creation.
To change scanner policy settings:
- In the Policies → Scanner policies section, click the policy name link.
The policy settings editing window opens.
- If required, use the Disable / Enable toggle switch to change the policy status (enabled / disabled).
- Make changes to the policy settings. The following settings are open for editing:
- The policy's name, description, and scope.
- Vulnerability control settings. Select the check boxes for the vulnerabilities database(s) to check images against.
- Malware control settings. Select the check box if you need to scan images for malware and other file threats. This control is conducted by using the File Threat Protection component.
- Misconfiguration control settings. Select the check box if you need to check images for misconfigurations. The control is conducted with the default settings configured by the Kaspersky Container Security manufacturer.
- Click Save.
Configuration of sensitive data detection rules
The list of configured rules for detecting sensitive data (hereinafter referred to as Secrets) during image scanning is displayed in the Policies → Scanner policies → Sensitive data section.
The rules are grouped into categories depending on the purpose and scope of secrets to be detected. The list of categories is determined by the Kaspersky Container Security manufacturer. Categories contain predefined rules.
You can use the list to do the following:
- View and change the settings for secrets detection rules. You can open the editing window by clicking the rule ID link.
- Add new rules to the selected category. Click the Add rule button located above the table to open the integration settings window. To add rules that do not belong to any of the preset categories, use the Other category.
- Delete rules. Check the box next to one or more rules in the list. The delete icon is then displayed.
To change the settings of sensitive data detection rules:
- In the table, in the Policies → Scanner policies → Policies section, select the scanner policy.
- In the Sensitive data section, select the necessary rules by selecting the check boxes in the rule lines.
- Use the Disable / Enable toggle switch in the Status column in the table with the list of policy rules to enable or disable this policy component.
Do not click the Save button.
Kaspersky Container Security immediately applies the changes to the sensitive data settings and displays the corresponding notification. You can also refresh the page to see the settings change.
Assurance policies
Assurance policy defines Kaspersky Container Security actions to provide security if threats detected during image scanning meet the criteria specified in the policy.
The configured assurance policies are displayed as a table in the Policies → Assurance policies section.
You can use the list to do the following:
- Add new policies. Click the Add policy button located above the table to open the policy settings window.
- Change policy settings. You can open the editing window by clicking the policy name link.
- Enable and disable policies. Policies are disabled and enabled by using the Disable/Enable toggle button in the Status column of the table containing the list of created policies.
- Delete policies.
If you add an assurance policy, modify its settings, or delete a policy, the compliance status is reviewed (Compliant / Non-compliant) for the images to which the policy is applied.
Creating an assurance policy
Rights to manage security policy settings are required to add a security policy in Kaspersky Container Security.
To add an assurance policy:
- In the Policies → Assurance policy section, click the Add policy button.
The policy settings window opens.
- Enter a policy name and, if required, policy description.
- In the Scope field, select the scope for the image security policy from the available options.
If you plan to implement the policy with the default scope, one of your user roles must be granted the rights to view default scopes.
- Specify the actions that Kaspersky Container Security should perform in accordance with the policy:
- Fail CI/CD step—if Kaspersky Container Security scanner detects threats while scanning the image in the CI/CD pipeline matching the severity level specified in the policy, the scanning ends with an error (Failed). This result is transferred to the CI system.
- Label images as non-compliant—Kaspersky Container Security labels images containing detected threats that meet the criteria specified in the policy.
- In the Vulnerability level section, configure the following settings:
- Use the Disabled / Enabled toggle switch to configure the scan based on the vulnerability severity level.
- Set the assigned severity level based on the vulnerability databases. You can select it from the Severity level drop-down list or specify a severity score from 0 to 10.
- Use the Disabled / Enabled toggle switch to configure blocking in case of specific vulnerabilities and specify these vulnerabilities in the Vulnerabilities field.
- In the Malware section, use the Disabled / Enabled toggle switch to configure scanning for malware in the image.
- In the Misconfigurations section, configure the following settings:
- Use the Disabled / Enabled toggle switch to configure the scan based on the misconfiguration severity level.
- Select the misconfiguration severity level from the Severity level drop-down list.
The severity level is assigned based on the vulnerability databases.
- In the Sensitive data section, configure the following settings:
- Use the Disabled / Enabled toggle switch to configure the scan based on the sensitive data severity level.
- Select the sensitive data severity level from the Severity level drop-down list.
The severity level is assigned based on the vulnerability databases.
- Click Save.
By default, the added policy is Enabled.
Page top
Editing assurance policy settings
You can edit the image security policy settings in Kaspersky Container Security if your account has been assigned at least one role that the policy's creator had at the time of the policy's creation.
To change assurance policy settings:
- In the Policies → Assurance policies section, click the policy name in the list of existing assurance policies.
The policy settings window opens.
- Make changes to the relevant policy settings:
- The policy's name, description, and scope.
- Actions of the solution in accordance with this policy.
- Required scans.
- Severity level of vulnerabilities detected during scans.
- Identify number of vulnerabilities for blocking purposes.
- Click Save.
Response policies
Response policy defines the actions of the solution in the case that events specified in the policy occur. For example, Kaspersky Container Security can notify the user about the detected threats.
If you want to configure response policies to notify the user, you should first set up integration with notification outputs.
The configured response policies are displayed as a table in the Policies → Response policies section.
You can use the list to do the following:
- Add new policies. Click the Add policy button located above the table to open the policy settings window.
- Change policy settings. You can open the editing window by clicking the policy name link.
- Enable and disable policies. Policies are disabled and enabled by using the Disable/Enable toggle button in the Status column of the table containing the list of created policies.
If you disable a policy, Kaspersky Container Security will not perform the actions specified in that policy.
- Search for policies. To find a policy, use the search field above the list of response policies to specify the policy name or part of it.
- Delete policies.
In this version of the solution, response policies define only the actions that Kaspersky Container Security takes to notify the user when a specific event detailed in the policy occurs. For example, if an object with a critical vulnerability is detected, the solution can send an email notification to the user.
Creating a response policy
Rights to manage response policy settings are required to add a response policy in Kaspersky Container Security.
To add a response policy:
- In the Policies → Response policies section, click the Add policy button.
The policy settings window opens.
- Enter a policy name and, if required, policy description.
- In the Scope field, select the scope for the response policy from the available options.
If you plan to implement the policy with the global scope, one of your user roles must be granted the rights to view global scopes.
- In the Trigger field, use the drop-down list to select an event that will trigger Kaspersky Container Security to notify the user if this event occurs during a scan. One of the following events can be selected as a trigger event:
- Sensitive data. A notification is sent if the solution detects signs of exposed sensitive data in an object during a scan.
- Non-compliant. Kaspersky Container Security notifies you if a scanned object contains images that do not comply with the requirements of security policies.
- Critical vulnerabilities. A notification is sent if a scanned object contains vulnerabilities with Critical status.
- Malware. A notification is sent if a scan finds malware.
- Risk acceptance expiration. Kaspersky Container Security notifies you if a scanned object contains risks that you had previously accepted but the risk acceptance period has expired.
- Configure the required notification methods:
- Select an Output: Email or Telegram.
- From the drop-down list in the Integration name field, select the name of the pre-configured integration with the selected notification output.
- To add another notification method, click the Add button and fill in the fields as described in paragraphs a and b above.
- If needed, you can remove the added notification methods by clicking the icon located to the right of the Integration name field.
- Click Save.
By default, the added policy is Enabled.
Page top
Editing response policy settings
You can edit the response policy settings in Kaspersky Container Security if your account has been assigned at least one role that the policy's creator had at the time of the policy's creation.
To change response policy settings:
- In the Policies → Response policies section, click the policy name in the list of existing response policies.
The policy settings window opens.
- If necessary, make changes to the relevant policy settings:
- Change the policy name.
- Add or edit the policy description.
- Add or edit the policy scope.
- Change the trigger event by selecting it from the drop-down list.
- Add an output by clicking the Add button.
- Delete the output by clicking the delete icon () located next to the line of the selected output.
- Click Save.
Runtime policies
A runtime policy determines the actions that are taken by the solution when monitoring and controlling runtime operations of containers in accordance with the security policies. Kaspersky Container Security maintains control based on security threats detected in an image, the severity level of these threats, and the availability of
.Containers in the runtime may run from verified images or from images that are still unknown to the solution.
On the Policies tab, under Policies → Runtime policies, a table lists configured runtime policies.
You can use the list to do the following:
- Add new policies. Click the Add policy button located above the table to open the policy settings window.
- Change policy settings. You can open the editing window by clicking the policy name link.
- Enable and disable policies. Policies are disabled and enabled by using the Disable/Enable toggle button in the Status column of the table containing the list of created policies.
If you disable a policy, Kaspersky Container Security will not perform the actions specified in that policy.
- Search for policies. To find a policy, use the search field above the list of response policies to specify the policy name or part of it.
- Delete policies.
To work optimally, a runtime policy must be supplemented by runtime container profiles, which define the rules and restrictions for running containers in the runtime environment.
Creating a runtime policy
Rights to manage runtime policy settings are required to add a runtime policy in Kaspersky Container Security.
To add a runtime policy:
- Under Policies → Runtime policies, select the Policies tab.
- Click the Add policy button.
The policy settings window opens.
- If necessary, use the Disabled / Enabled switch to set the policy status. By default, the added policy is Enabled.
- Enter a policy name and, if required, policy description.
- In the Scope field, select the scope for the runtime policy from the available options. Since runtime policies are only used for deployed and/or running containers, scopes containing resources across clusters can be selected.
Scopes containing only registry resources are not available for selection. If necessary, you can specify individual images and pods for the runtime policy that you are creating in the Container runtime profiles section, as specified in step 11.
If you plan to implement the policy with the global scope, one of your user roles must be granted the rights to view global scopes.
- In the Mode section, select one of the following policy enforcement modes:
- Audit. In this mode, a scan takes into account the contents of containers.
- Enforce. In this mode, the solution blocks all objects that do not comply with the rules and criteria defined in the policy.
If a scope includes an object subject to a runtime policy in Audit mode and a runtime policy in Enforce mode, all actions specified in the runtime policies are applied in Enforce mode.
- On the Admission controller tab, configure the following settings:
- In the Best practice check section, use the Disabled / Enabled toggle switch to activate the scan for compliance with best security practices. From the list of settings, select the scan settings that guarantee that the correct image is run and that the CPU and RAM usage settings are correctly configured.
- In the Block non-compliant images section, use the Disabled / Enabled toggle switch to prevent containers running from images that do not comply with the requirements. This check will be performed only for scanned images that are registered in the solution and have the Compliant status.
- In the Block unregistered images section, use the Disabled / Enabled toggle switch to block image deployment if the image is unknown to Kaspersky Container Security. To deploy the image, you must register it in the solution and wait for it to appear in the registry.
- In the Dynamic Admission Controller bypass criteria block, use the Disabled / Enabled switch to define the exclusions for which the runtime policy will not be applied. To do so, select the relevant objects in the drop-down list, specify their names, and then click Add.
Existing exclusions in the policy are checked when deploying a container.
- In the Capabilities block section, use the Disabled / Enabled toggle switch to block the use of specified Unix functions. To do so, select specific system functions from the drop-down list. You can also lock the use of all Unix system functions by selecting ALL from the drop-down list.
- In the Image content protection section, use the Disabled / Enabled toggle switch to enable verification of digital signatures that confirm the integrity and origin of images in the container. To do this, perform the following actions:
- In the Image registry URL template field, enter the template for the web address of the image registry in which you want to verify signatures.
- In the drop-down list, select Check to enable verification or Don't check to disable verification.
- In the drop-down list, select one of the configured image signature validators.
- If necessary, add signature verification rules by using the Add signature verification rule button. The solution will apply multiple signature verification rules under a single runtime policy.
- In the Limit container privileges section, use the Disabled / Enabled toggle switch to block the start of containers with a specific set of rights and permissions. In the list of settings, select the rights and permissions configuration to block pod settings.
- In the Registries allowed section, use the Disabled / Enabled toggle switch to allow deployment of containers in a cluster only from specific registries. To do so, select the relevant registries from the Registries drop-down list.
- In the Volumes blocked section, use the Disabled / Enabled toggle switch to prevent the selected volumes from being mounted in containers. To do this, specify the volume mount points on the host system in the Volumes field.
The Volumes field must begin with a forward slash ("/") because this represents the operating system path.
- On the Container runtime tab, configure the following settings:
- In the Container runtime profiles section, use the Disabled / Enabled toggle switch to block processes inside containers and network connections for pods. To do this, perform the following actions:
- In the drop-down list, select an attribute to define the pods that the container runtime profiles will be applied to.
- Depending on the selected attribute, do the following:
- If you selected By pod labels, enter the pod label key and the pod label value.
You can add additional pod labels for pod selection by clicking the Add label pair button.
- If you selected Image URL template, enter the template for the web address of the image registry.
If the cluster contains images from the public Docker Hub registry, the solution equally considers the full path and the short path to the images. For example, if you specify the URL of the container image in the cluster as docker.io/library/ubuntu:focal, the solution accepts it equally as ubuntu: focal.
You can add additional web addresses for pod selection by clicking the Add Image URL button.
- If you selected Image digest, enter the image digest created using the SHA256 hash algorithm. You can specify the image digest with or without the sha256 prefix (for example, sha256:ef957...eb43 or ef957...eb43).
You can add additional image digests to select pods by clicking the Add image digest button.
- If you selected By pod labels, enter the pod label key and the pod label value.
- In the Container runtime profile field, specify one or more runtime profiles that will be applied to pods that match the attributes you defined.
- If necessary, you can add pods for mapping using the Add pod mapping button. Pods with different attributes or applied runtime profiles will be mapped under the same runtime policy.
- In the Container autoprofiles section, use the Disabled / Enabled switch to activate scanning of containers in the specified scope using the autoprofiles associated with images in these containers.
You can view all autoprofiles included in the scope by clicking the Show autoprofiles attributed to the scope link. In the sidebar that opens, the solution shows a table with a list of autoprofiles. For each autoprofile, its name, date and time of the last modification, as well as the image associated with the autoprofile are displayed.
- In the Container runtime profiles section, use the Disabled / Enabled toggle switch to block processes inside containers and network connections for pods. To do this, perform the following actions:
- Click the Add button.
Editing runtime policy settings
You can edit the runtime policy settings in Kaspersky Container Security if your account has been assigned at least one role that the policy's creator had at the time of the policy's creation.
To change runtime policy settings:
- In the Policies → Runtime policies → Policies section, click the policy name in the list of existing runtime policies.
The policy settings window opens.
- Change the status and name of the policy.
- Add or edit the policy description.
- Add or remove scopes.
- Select the policy mode — Audit or Enforce.
- On the Admission controller tab, make changes to the relevant sections of the policy:
- Best practice check.
- Block non-compliant images.
- Block unregistered images.
- Dynamic Admission Controller bypass criteria.
- Capabilities block.
- Image content protection.
- Limit container privileges.
- Registries allowed.
- Blocking volumes.
- On the Container runtime tab, make changes to the relevant sections of the policy:
- Container runtime profiles.
- Container autoprofiles.
- Click Save.
Managing container runtime profiles
When implementing runtime policies, Kaspersky Container Security can apply user-defined rules for monitoring processes and the network. To do so, add runtime profiles to the appropriate runtime policies. Runtime profiles are essentially lists of restrictions for containers. Image profiles define the settings for secure image deployment and safe activities of an application deployed from an image. The actions assigned in profiles can significantly reduce the capabilities of cybercriminals who could potentially infiltrate a facility, and can improve security during the runtime operation of containers.
The following settings specify restrictions in an image profile:
- Executable files that should be blocked.
- Network restrictions for inbound and outbound connections.
Container runtime profiles in runtime policies apply to images that are running in orchestration environments using objects within the cluster. If a container is started outside the orchestration environment (for example, using the docker run or ctr run command), the solution will not detect malware in such a container.
The solution does not automatically perform a malware scan when objects are saved in a container. We recommend additionally protecting containerized files outside the orchestration environment.
The list of configured profiles is displayed as a table on the Container runtime profiles tab under Policies → Runtime policies. In this section, you can also do the following:
- Create new container runtime profiles. Open the profile settings window by clicking the Add profile button above the list.
- Edit profile settings by clicking the link in the runtime profile name.
- Delete runtime profiles.
Creating a runtime profile
To add a container runtime profile:
- Under Policies → Runtime policies → Container runtime profiles, click the Add profile button.
The profile settings input window opens.
- Enter a name for the runtime profile and, if necessary, a description.
- In the Scopes drop-down list, select one or more scopes.
Scopes in runtime profiles allow profiles to be used correctly in runtime policies.
- Under File Threat Protection, use the Disabled / Enabled toggle to activate File Threat Protection. It is used to find and analyze potential file threats, and provides security for containerized objects, such as archives and email files.
When a runtime profile is applied with the File Threat Protection component enabled, Kaspersky Container Security activates real-time file threat protection on all nodes within the scopes defined for that policy. The configuration of the deployed agents depends on the settings that you specify for File Threat Protection. You can configure the File Threat Protection settings by clicking the File Threat Protection settings button on the Container runtime profiles tab in the Policies → Runtime section.
- In the Restrict container executable files section, use the Disabled / Enabled toggle switch to restrict executable files according to rules. In the list, select the blocking option that guarantees optimal container performance:
- Block process from all executable files - application blocks all executable files from starting while the container is running.
- Block specified executable files - application blocks the executable files that you select in the Block the specified executable files field. You can block all executable files or a list of specific executable files. You must specify the full original path to the executable file (for example,
/bin/php). You can also use an*mask (for example,/bin/*) to apply a rule to an entire directory and its subdirectories.You can fine-tune the list of allowed and blocked executable files by specifying exclusions for blocking rules. For example, you can specifically exclude the path
/bin/catfor a rule applied to/bin/*. In this case, all executable files from the directory/bin/will be blocked from running except the/bin/catapplication.Example path to executable files
When working with the
busyboxbinary that is delivered with many basic container images (such asalpine), you must take into account thatbusyboxcontains a set of commands to fetch applications without an explicit specification of such applications. For example, thelscommand is used to fetch the/bin/lsexecutable file, which in turn is a symbolic link to/bin/busybox. In this case, you must specify the path to the executable file as follows:/bin/busybox/ls(that is, you must concatenate the original path of the/bin/busyboxexecutable file and itslscommand with the/symbol).If you select the Allow exclusions check box, the application will block all executable files except those specified in the Allow exclusions field when a container is started and running.
All rules and exceptions specified for this group of parameters are regular expressions (regexp). The solution uses the specified patterns and indicators to find all files that match a specific regular expression.
- In the Restrict ingress container connections section, use the Disabled / Enabled toggle switch to activate the capability to restrict inbound connections of a container. When this restriction is active, Kaspersky Container Security will block all sources of inbound connections except those that you specified as exclusions.
If you select the Allow exclusions check box, you can specify the parameters of one or more allowed sources of inbound network connections. To define exclusions, you must specify at least one of the following parameters:
- Sources. In the Sources field, enter an IP address or a range of IP addresses for the inbound connection source in CIDR4 or CIDR6 notation.
- In the TCP ports field and in the UDP ports field, enter a specific port or range of ports for the connection.
If you need to specify multiple ports, use a comma, e.g. 8080, 8082.
If you do not specify a value for the ports, the application will allow a connection over all ports.
- In the Restrict egress container connections section, use the Disabled / Enabled toggle switch to activate the capability to restrict outbound connections for defined destinations.
If you select the Allow exclusions check box, you can specify the parameters of one or more allowed destinations for outbound network connections. To define exclusions, you must specify at least one of the following parameters:
- Destinations. In the Destinations field, enter an IP address or a range of IP addresses for an outbound connection destination in CIDR4 or CIDR6 notation, or the web address (URL) of a destination.
- In the TCP ports field and in the UDP ports field, enter a specific port or range of ports for the connection.
If you need to specify multiple ports, use a comma, e.g. 8080, 8082.
If you do not specify a value for the ports, the application will allow a connection over all ports.
- In the File operations sections, use the Disabled / Enabled switch to enable the ability to monitor file operations in the container. To do this, specify values for the following settings:
- Path. Paths to files or folders can be specified with or without a forward slash (/) at the end of the path. You can allow access to all subdirectories by placing an asterisk (*) after the forward slash (/) at the end of the path.
When specifying paths to files, only enter full paths that begin with a forward slash.
- If necessary, in the Exclusions field, you can specify paths to files for which file operations will not be monitored.
- Operation type. You can specify the file operations that the solution monitors when the runtime policy is applied. To do this, use the check box to select one or more of the following operation types:
- Create — The solution logs all file creation operations in the specified directories.
- Open - the solution logs all file opening operations.
- Read — The solution logs file read operations.
- Write — The solution logs information about changes saved in files.
- Rename or move — The solution logs operations that change the name of files or move files to other folders.
- Delete — The solution logs information about the deletion of files or folders from the specified directories.
- Change access permissions — The solution logs information about changes in the rights to access files and directories.
- Change ownership — The solution monitors operations that change the owner of a file or folder in the specified directory.
If necessary, add rules for monitoring file operations using the Add rule button. The solution will apply multiple file operation monitoring rules within a single runtime policy.
For file operations, only Audit mode is supported. If the Enforce mode is specified in the applicable runtime policy, file operations are performed in Audit mode.
- Path. Paths to files or folders can be specified with or without a forward slash (/) at the end of the path. You can allow access to all subdirectories by placing an asterisk (*) after the forward slash (/) at the end of the path.
- Click the Add button.
The added runtime profile is displayed in the Policies → Runtime policies → Container runtime profiles section.
Page top
Examples of configured runtime profiles
The table below presents a few of the images that are most frequently used by the application, and the settings for their configured restrictions in runtime profiles.
Images and their configured settings
Image name |
Restrict container executable modules |
Restrict network connections |
|---|---|---|
Nginx |
Allowed executable file:
|
Block outbound connections |
Mysql |
Allowed executable files:
|
Block outbound connections |
Wordpress |
Allowed executable files:
|
|
Node |
Allowed executable file:
|
Block outbound connections |
MongoDB |
Allowed executable files:
|
|
HAProxy |
Allowed executable files:
|
|
Hipache |
Allowed executable files:
|
|
Drupal |
Allowed executable files:
|
|
Redis |
Allowed executable files:
|
Block outbound connections |
Tomcat |
Allowed executable files:
|
Block outbound connections |
Celery |
Allowed executable files:
|
|

Changing runtime profile settings
To change container runtime profile settings:
- Under Policies → Runtime policies → Container runtime profiles, click the name of the profile in the list of existing container runtime profiles.
- In the window that opens, change the values of one or more of the following settings:
- Name of the runtime profile.
- Description of the runtime profile.
- Scopes.
- File threat protection.
- Restrict container executable files.
- Restrict inbound network connections.
- Restrict outbound network connections.
- File operations.
- Click Save.
Changes made to runtime profile settings are immediately applied to the running container and affect its operation.
Page top
Deleting a runtime profile
To delete a container runtime profile:
- In the table of configured runtime profiles under Policies → Runtime policies → Image profiles, click the delete icon () in the row containing the name of the profile that you want to delete.
- In the window that opens, confirm the action.
Managing runtime autoprofiles
Kaspersky Container Security can monitor processes, network traffic, and file operations in containers, and then use the obtained information to automatically generate container runtime profiles. The autoprofiling process is performed within a time interval set by the user and within the selected scope. Such a scope can be a cluster, a namespace, or a pod.
The content of an automatically generated profile (autoprofile) depends on the agent group's node monitoring settings. To start autoprofiling, you need to activate the monitoring settings for network connections, processes being started, and file operations of containers for the corresponding agent group.
The autoprofile is made unique by a combination of three settings: the name of the cluster, the name of the namespace, and the image digest. Accordingly, within one namespace, an autoprofile is generated for all containers with the selected build of an image.
Creating a runtime autoprofile
We recommend that you restart the pods after autoprofiling begins so that the solution records the start of the pods in its rules. This will prevent pods from being incorrectly blocked when they restart.
Kaspersky Container Security allows creating autoprofiles at three levels:
- At the cluster level
- At the namespace level
- At the pod level
At the cluster and namespace level, you can create an autoprofile using a table with a list of clusters or namespaces, or from a graph of objects within a cluster. At the pod level, an autoprofile can only be created using the table.
To create a container runtime autoprofile using the table with a list of objects:
- Go to Resources → Clusters.
- Follow these steps depending on the level at which you are creating an autoprofile:
- If you want to create an autoprofile at the cluster level, in the cluster table, select check boxes for one or more clusters.
- If you want to create an autoprofile at the namespace level, follow these steps:
- Click the name of the cluster in the cluster table.
- On the Table tab, in the table that lists the namespaces in the cluster, use the check box to select one or more namespaces.
- If you want to create an autoprofile at the pod level, follow these steps:
- Click the name of the cluster in the cluster table.
- Click the name of the namespace in the table of namespaces in the cluster.
- In the displayed sidebar, select the Pods and containers tab, and in the table of pods within the namespace, select check boxes for one or more pods.
Make sure that the autoprofiling process is not running in the selected objects. If the process is running, the solution will not allow another autoprofiling task to start.
- Click the Build autoprofile button above the table.
In a cluster, you can run only one autoprofile creation task at a time. The solution will allow a new autoprofiling task only after the previous task has finished or has been stopped.
- This opens a window; in that window, specify the duration of autoprofiling. This duration can be 1 to 1440 minutes.
The default setting is 60 minutes.
- Click Start.
In the Autoprofiles column of the table of objects (clusters, namespaces, or pods), the solution displays the time remaining until the end of autoprofiling for that object or the number of autoprofiles created for the object.
To create a container runtime autoprofile from a graph:
- Go to Resources → Clusters.
- Follow these steps on the Graph view tab, according to the level at which you are creating an autoprofile:
- If you want to create an autoprofile at the cluster level, left-click on the cluster icon () on a namespace graph.
- If you want to create an autoprofile at the namespace level, follow these steps:
- Double-click to expand the group of namespaces within the cluster on the graph.
- In the namespace graph, left-click on the icon of the namespace you are interested in ().
- If you want to create an autoprofile at the cluster level, left-click on the cluster icon (
- In the menu that opens, select Build autoprofile.
If the autoprofiling process is already running in the cluster, you will not be able to select Build autoprofile. If you have the appropriate rights, you can stop the creation of an autoprofile in the selected cluster by selecting Stop autoprofiling in the menu. Alternatively, wait for previously started autoprofiling task to complete. The solution allows running only one autoprofiling task at a time in a cluster.
- This opens a window; in that window, specify the duration of autoprofiling. This duration can be 1 to 1440 minutes.
The default setting is 60 minutes.
- Click Start.
The created runtime autoprofiles are displayed in the Policies → Runtime policies → Autoprofiles section.
Page top
Viewing the list of runtime autoprofiles
Kaspersky Container Security displays a list of all created runtime autoprofiles in the table under Policies → Runtime → Autoprofiles. The following information is displayed for each autoprofile:
- The name of the autoprofile, which is a concatenation of the following data:
- Pod name.
- Namespace name.
- Cluster name.
- The first 12 characters of the image checksum (after the SHA256 prefix)
These components of the autoprofile name are separated by underscores (for example, kube-company_sampled-operations_docker-cluster__9a74fc18ee07).
- The status of the autoprofile with regard to its verification by the user: Verified or Not verified. By default, an autoprofile is created with the Not verified status.
If necessary, you can use the Verified/Not verified toggle switch to change the status of the autoprofile in the table. You can also assign the Verified status to one or more autoprofiles by clicking the Verify button above the table.
Only autoprofiles with the Verified status can be applied.
- Date and time of the last modification.
- The cluster and namespace that the autoprofile is based on.
- The image whose checksum the autoprofile was based on.
Kaspersky Container Security also displays a list of autoprofiles for each image whose digest was used to create the autoprofiles.
To view a list of autoprofiles created for an image:
- Go to Resources → Registries.
- In the desired registry, click the icon and expand the list of images in the registry. Images used to create autoprofiles are marked with the autoprofiling icon ().
- Click the name of an image, go to the page with detailed information about the scan results for this image.
The list of all autoprofiles for the image is presented as a table in the Associated autoprofiles section. The following information is displayed for each autoprofile:
- Autoprofile name. Click the name of an autoprofile to open a window with a detailed description of the autoprofile. The information in this window is read-only.
- Date and time of the last modification.
- The cluster and namespace that the autoprofile is based on.
Viewing runtime autoprofile settings
To view autoprofile parameters:
- In Policies → Runtime policies → Autoprofiles section, click the name of the autoprofile in the list of created container runtime autoprofiles.
- In the displayed sidebar, General and Building parameters tabs contain information about the parameters of the selected autoprofile. The General tab displays the following:
- Autoprofile status.
- Name of the runtime autoprofile.
- Description of the runtime autoprofile, if it was specified manually. By default, no description is added when autoprofiling.
- Under Parameters, you can view the parameters of the following modules:
- File threat protection.
- Restrict container executable files.
- Restrict inbound network connections.
- Restrict outbound network connections.
- File operations.
If necessary, you can make changes to the autoprofile parameters.
The Building parameters tab displays the following data:
- Name of the runtime autoprofile.
- Date and time of the last modification of the autoprofile.
- Name of the user that initiated the creation of the autoprofile.
- Image checksum, namespace, and cluster the autoprofile was based on.
- Name of the image whose checksum the autoprofile was based on. You can view the scan results for this image by clicking the image name.
Editing runtime autoprofile settings
To edit autoprofile parameters:
- In Policies → Runtime policies → Autoprofiles section, click the name of the autoprofile in the list of created container runtime autoprofiles.
- If necessary, in the displayed sidebar, on the General information tab, edit the values of one, multiple, or all of the following parameters:
- Autoprofile status. Use the Verified/Not verified toggle switch to change the autoprofile status to Verified or Not verified.
- Name of the runtime autoprofile. You can specify a custom autoprofile name to replace the name automatically generated by the solution.
- Description of the runtime autoprofile. By default, no description is added when autoprofiling.
- Under Parameters, edit the network status monitoring parameters as follows:
- File threat protection. If necessary, use the Disabled/Enabled toggle switch to enable or disable File Threat Protection. By default, the settings under File Threat Protection are disabled.
- Restrict container executable files. You can specify specific file names and paths to block, as well as specify exceptions.
If processes are running inside containers in the relevant build, the solution performs the following actions:
- When events are detected in processes in Audit and Enforce mode, the solution activates the Block specified executable files setting and all unique paths are indicated in the Executables or path field.
- If there are no events in processes in Audit and Enforce mode, the solution applies the Block all executable files setting.
- If it detects events other than the above, the solution activates the Allow exclusions setting and specifies all unique path values in the Executables or path field.
- Restrict inbound network connections. If necessary, you can use the Disabled/Enabled toggle switch to disable the ability to restrict inbound connections of the container.
If inbound traffic is observed in containers in the relevant build, the solution performs the following actions:
- When events related to inbound connections are detected in Audit and Enforce mode, the solution activates the Restrict inbound network connections setting.
- If there are no events related to inbound traffic in Audit and Enforce mode, or if other events are detected, the solution activates the Allow exclusions option. The Sources, TCP ports and UDP ports fields contain all the unique recipients of inbound connections.
- Restrict outbound network connections. If necessary, you can use the Disabled/Enabled toggle switch to disable the ability to restrict outbound connections of the container.
If outbound traffic is observed in containers in the relevant build, the solution performs the following actions:
- When events related to outbound connections are detected in Audit and Enforce mode, the solution activates the Restrict outbound network connections setting.
- If there are no events related to inbound traffic in Audit and Enforce mode, or if other events are detected, the solution activates the Allow exclusions option. The Sources, TCP ports and UDP ports fields specify all unique outbound connection sources.
- File operations. You can edit the settings for monitoring file operations in the container.
If actions are observed inside the containers in the relevant build, upon detection of file management events in Audit and Enforce mode, the solution activates the File operations setting. In this case, all unique paths are indicated in the Path field, and the check boxes of all detected operation types are selected in the Operation type field.
You can also click Add rule to add rules to be applied when monitoring file operations.
If a setting is enabled in the Settings section, the solution determines the specific build of the image and scans all containers deployed from that build.
- Save changes to the autoprofile by doing one of the following:
- To save without changing the autoprofile status to Verified, click Save.
- To save and change the status of the autoprofile to Verified, click Save and verify.
Stopping autoprofiling
If an autoprofile task is running in the selected cluster, Kaspersky Container Security displays the time remaining until the process completes:
- in the Autoprofiles column of the table with the list of clusters
- in the Autoprofiles column of the table with the list of namespaces in the cluster
- in the Autoprofiles column of the table with the list of pods in the selected namespace in the cluster.
You can stop a running autoprofiling process at three levels:
- At the cluster level
- At the namespace level
- At the pod level
At the cluster and namespace level, you can stop creating an autoprofile using a table with a list of clusters or namespaces, or from a graph of objects within a cluster. At the pod level, autoprofiling can only be stopped using the table.
Autoprofiling can be stopped for the entire profiled object (cluster, namespace, or pod) or for specific entities within the profiled object (for example, for selected namespaces or pods).
You can stop a running autoprofiling process if you have the necessary rights.
Stopping an autoprofiling task
To stop running an autoprofiling task using the table with a list of objects:
- Go to Resources → Clusters.
- Follow these steps depending on the level at which you are stopping the autoprofiling:
- If you want to stop autoprofiling at the cluster level, use the check box to select one or more clusters for which the autoprofiling task has been started.
- If you want to stop autoprofiling at the namespace level, follow these steps:
- Click the name of the cluster in the cluster table.
- On the Table tab, in the table that lists the namespaces in the cluster, use the check box to select one or more namespaces for which the autoprofiling task has been started.
- If you want to stop autoprofiling at the pod level, do the following:
- Click the name of the cluster in the cluster table.
- Click the name of the namespace in the table of namespaces in the cluster.
- In the displayed sidebar, select the Pods and containers tab, and in the table of pods within the namespace, select check boxes for one or more pods for which the autoprofiling task has been started.
- Click the Stop autoprofiling button located above the table.
If the list of selected objects includes a cluster, namespace, or subcluster where the autoprofiling process has not been started, the Stop autoprofiling button becomes inactive.
- Click the Stop button to confirm stopping the autoprofiling process.
To stop an autoprofiling task from a graph:
- Go to Resources → Clusters.
- Do the following on the Graph view tab, depending on the level at which you are creating an autoprofile:
- If you want to stop an autoprofiling task at the cluster level, left-click on the cluster icon () on a namespace graph.
- If you want to stop an autoprofiling task at the namespace level, do the following:
- Double-click to expand the group of namespaces within the cluster on the graph.
- In the namespace graph, left-click on the icon of the namespace you are interested in ().
- If you want to stop an autoprofiling task at the cluster level, left-click on the cluster icon (
- In the menu that opens, select Stop autoprofiling.
- Click the Stop button to confirm stopping the autoprofiling process.
Stopping autoprofiling for individual objects
To stop autoprofiling for individual objects in an autoprofiling task:
- Start an autoprofiling task.
- Do one of the following:
- If a cluster autoprofiling task is running, do the following:
- In the table with the list of clusters, click the name of the cluster for which an autoprofile is being created.
- In the window that opens, do one of the following:
- Select one or more namespaces for which you want to stop auto-profiling.
- Click the namespace name and in the window that opens, select one or more pods for which you want to stop autoprofiling.
- If a namespace autoprofiling task is running, do the following:
- In the table with the list of namespaces in the cluster, click the name of the namespace for which an autoprofile is being created.
- In the window that opens, select one or more pods for which you want to stop autoprofiling.
- If a cluster autoprofiling task is running, do the following:
- Click the Stop autoprofiling button located above the table with the list of objects.
- Click the Stop button to confirm stopping the autoprofiling process.
Kaspersky Container Security stops the autoprofiling process for the selected objects. The solution will continue running the autoprofiling task for the rest of the objects in the cluster or namespace.
When stopping autoprofiling for individual objects, bear in mind that stopping the task at the level of a larger object will completely stop the task. For example, an autoprofiling task is completely stopped in the following cases:
- If a task for autoprofiling namespaces or pods is started and you stop autoprofiling at the level of the cluster that includes the selected namespaces or pods.
- If a task for autoprofiling pods is started and you stop autoprofiling at the level of the namespace that contains the selected pods.
Deleting a runtime autoprofile
To delete a container runtime autoprofile:
- Open the table of the generated runtime autoprofiles in one of the following sections:
- In the Policies → Runtime → Autoprofiles section.
- In the Associated autoprofiles section, on the page with detailed information about the image scan results, in the Resources → Registries section.
- Do one of the following:
- In the Policies → Runtime → Autoprofiles section, use the check box to select the autoprofile that you want to delete and click the Delete button located above the table.
- On the page with detailed information about the image scan results, in the Resources → Registries section, in the row with the name of the autoprofile that you want to delete, click the delete icon ().
- In the window that opens, confirm the action.
Restrictions related to autoprofiles
When working with runtime autoprofiles, consider the following restrictions related to scopes and user roles:
- If an image is not added to the scopes assigned to the user as part of a namespace in a cluster, the user cannot access autoprofiles generated using the digest of the image.
A user assigned the default scope can view all created autoprofiles.
- If a user has the rights to manage autoprofiling, the user can start a task to build an autoprofile, change the settings and re-generate an autoprofile.
- A user who did not start an autoprofiling task can change the settings, as well as rebuild and delete an autoprofile, if all of the following conditions are met:
- The user has rights to manage autoprofiling
- One of the user's roles coincides with the role of the autoprofiling task's creator at the time the autoprofile is created
- The scopes assigned to the user include the image (as part of the namespace in the cluster) that the autoprofile is based on
Deleting policies
You can delete security policies if your account has been assigned at least one role that the policy's creator had at the time of the policy's creation. You also need rights to manage the corresponding types of policies in order to delete them.
To delete a policy:
- Open the list of configured scanner policies, assurance policies, response policies or runtime policies.
- In the line containing the name of the policy that you want to delete, click the delete icon ().
- In the window that opens, confirm the action.
If security policy configuration errors block Kaspersky Container Security and you cannot manage the solution using the Management Console, the security policies must be deleted manually.
To manually delete a policy and recover the solution:
- Run the following command to remove the agents (kube-agent and node-agent) as applicable:
kubectl delete deployment kube-agentkubectl delete daemonset node-agent - Delete all customer resources in the target cluster by running the following command:
kubectl get crd -o name | grep 'kcssecurityprofiles.securityprobe.kcs.com' | xargs kubectl delete - Restart all Kaspersky Container Security pods and access the Management Console.
- Make the necessary changes to the security policies.
- Install the agents using the instruction in the .YAML format.
Compliance check
Kaspersky Container Security lets you check cluster nodes and resources for compliance with the following benchmarks:
- Kubernetes benchmarks. The solution checks cluster nodes for compliance with recommendations for creating a robust security system for Kubernetes-based software.
The results of the check are displayed in the Compliance → Kubernetes benchmarks section.
- Cluster benchmarks. The solution checks how well resources in clusters are protected. Clusters are checked using rules described in and / benchmarks, as well as Kubernetes benchmarks, which are used to assess threats and develop resource protection strategies.
The results of the check are displayed in the Compliance → Cluster benchmarks section.
Not all orchestration platforms supported by Kaspersky Container Security can be scanned for compliance with standards. The check is performed for Kubernetes, OpenShift and DropApp.
In Kaspersky Container Security, you can generate reports based on the results of benchmark compliance checks. The list of generated reports is displayed under Administration → Reports.
Kubernetes benchmarks compliance check
Kaspersky Container Security agents can check Kubernetes cluster nodes for compliance with the Kubernetes information security benchmarks.
Kaspersky Container Security checks for compliance with the Kubernetes benchmarks on Kubernetes versions 1.15–1.29.
The agent checks the state of the node where it is installed and sends the results to the server. Check results are displayed in the Compliance section.
You can view the results of checks on cluster nodes for compliance with the Kubernetes benchmarks in the Compliance → Kubernetes benchmarks section. The node scan results are displayed in a table. By default, Kaspersky Container Security displays a list with the results of the last scan of all nodes in all clusters. The nodes in the list are not grouped; you can use the filter to build a list of objects according to the cluster name.
Above the scan results table, there is the Control status section that displays the number of controls each status was assigned to during the scan. Kaspersky Container Security displays this information for the following scan statuses:
- Passed—check completed successfully.
- Warning—check shows that problems may occur during the execution of operations or tasks.
- Failed—check revealed non-compliance with the benchmark.
You can select nodes with which statuses you want to display after the scan. To do this, in the Control status section, select the button with the status that you want to hide. After that, the scan results table will only display the nodes whose benchmarks received this status (besides others) when scanned.
In Kaspersky Container Security, you can generate a report based on the result of a Kubernetes benchmarks compliance check. Depending on the level of detail you require, you can generate a Kubernetes benchmarks summary or detailed report. The list of generated reports is displayed under Administration → Reports.
Click the node name link to open a page with detailed information about the results of the node check.
The solution displays summary information at the top of the window. In the table, each benchmark is correlated with node compliance status.
You can check a node against the standard benchmarks by clicking the Rescan button.
Cluster security benchmarks compliance check
The clusters that you can check for compliance with cluster benchmarks are listed in a table in the Compliance → Cluster benchmarks section.
To view information on individual clusters:
In the Cluster field in the Compliance → Cluster benchmarks section, do one of the following:
- In the drop-down list, select one or more clusters.
- Enter the name of one or more clusters.
By default, the table displays all clusters available for the compliance check.
The table includes the following information for clusters:
- Cluster name.
- Date and time of the last scan.
- Orchestrator and version. If the orchestrator version is no longer officially supported, the solution indicates this using the
 icon.
icon. - Compliance score
- Non-compliant controls with the severity of each identified risk type
You can select one or more clusters by selecting the check box in the row containing the name of the cluster. By clicking the buttons above the table, you can perform the following actions with the selected clusters:
- Send for rescan.
- Generate a report on the compliance of resources of one or more clusters with cluster security benchmarks.
Kaspersky Container Security queries category and subcategory names, control names, and remediation recommendations from connected databases of applicable benchmarks in the language of these databases. The information is displayed in the form in which it was received. Accordingly, information from the MITRE, NSA/CISA, and Kubernetes benchmarks is presented in English.
Viewing cluster scan results
To view detailed cluster check results:
In the Compliance → Cluster benchmarks section, click the cluster name in the table.
This opens a window with the results of the cluster check, which displays information about the compliance of the cluster resources with benchmark controls, as well as information about cluster resource management. You can view the results in the Benchmarks scan results and Information tabs.
The solution displays the scan results for all resources in the cluster, even if individual resources of that cluster are selected for your scope.
The table on the Benchmarks scan results tab includes the following information:
- Control ID.
- Description of the control.
- Compliance score as a percentage.
- Number of non-compliant resources for each control found
- Remediation recommendations
- Category of the control
- Severity of the control
On the Information tab, the solution displays the following information about the checked cluster:
- Orchestrator and its version
- Git version
- CPU architecture
- Date and time of cluster build
- Date of end of support for the specified version of the orchestrator. If the orchestrator version is no longer officially supported, the solution indicates this using the icon.
If necessary, you can send the cluster for a rescan by clicking the Rescan button on the Benchmarks scan results tab.
You can also generate a report on the compliance of resources of one or more clusters with cluster security benchmarks by clicking the Create report button on the Benchmarks scan results tab. The list of generated reports is displayed under Administration → Reports.
Configuring how cluster scan results are displayed
To configure the display of cluster scan results:
- In the Compliance → Cluster benchmarks section, click the cluster name.
The solution will open a window with a detailed description of the results of scanning the selected cluster.
- Select the date and time of the scan. By default, the results of the last performed scan are displayed.
- If necessary, filter the scan results by severity and applicable cluster security benchmarks by doing the following:
- Click the filter icon () above the table.
- In the displayed sidebar, specify the following parameters of controls:
- For the Severity setting, select one or more of the severity buttons (Critical, High, Medium, and Low).
- For the Framework setting, select one or more buttons corresponding to the relevant benchmarks (All, MITRE, NSA/CISA).
- Click Apply.
The solution closes the sidebar and the test results table displays only the controls that match the selected parameters of controls.
By default, scan results are displayed for all severity levels and all cluster security benchmarks.
- Click the filter icon (
- If necessary, select the category or subcategory of controls that you want to display in the table. To do so:
- If you want to select a category of controls to display, click the category name above the results table.
- If you want to select a subcategory of controls to display:
- Expand the lists of subcategories under categories of controls by clicking the Expand subcategories link.
- Click the subcategory name in the above the results table.
Control details
To view information about a control:
In the window with detailed scan results for the selected cluster, click the control ID in the table on the Benchmarks scan results tab.
The displayed sidebar contains the following information:
- The General tab:
- ID and name of the control
- Category and subcategory of the control
- Checking method
- Rules for performing the check
- Description of the control
- Remediation recommendations
- Checking technique that was used
- Benchmarks:
- On the Resources tab:
- Total number of checked resources.
- Compliance score as a percentage.
- The number of resources for which the check could not be performed. This value is indicated next to the title of the tab.
- A table of the following parameters of resources in the cluster:
- Namespace
- Resource name
- Resource type
- Verification status (Passed, Failed).
You can configure the display of resource information in the table by clicking the All, Passed, and Failed buttons above the table.
Configuring and generating reports
Kaspersky Container Security provides the capability to generate reports based on the results of scanning registries, clusters, and images. The list of generated reports is displayed under Administration → Reports.
Reports generated by the solution display the following information:
- Events related to the operating logic of Kaspersky Container Security, such as the results of scanning images or analyzing nodes.
- Statistical data, such as a list of images and their identified security issues.
Kaspersky Container Security provides the following report templates:
- Summary images report.
- Images detailed report.
- Risk acceptance report.
- Kubernetes benchmarks summary report
- Kubernetes benchmarks detailed report
- Cluster benchmarks report
Depending on the applied report template, reports are created and generated in different sections of the solution.
The report generation process may take several minutes.
The list of generated reports is displayed under Administration → Reports. Reports are available for download in .HTML, .PDF, .CSV, .JSON, or .XML format.
In Kaspersky Container Security, reports are generated only in English.
Image reports
In Kaspersky Container Security, you can generate reports on image scan results. Depending on the required level of detail, image reports can be summary reports or detailed reports.
Images summary report.
A summary report provides consolidated information on the selected images. This report provides the names of images and the names of the clusters containing these images. A summary report contains data on image compliance with security policy requirements, the names of policies that invoked the image scans, and the scan status. For each image, the report contains data on the number of identified risks related to vulnerabilities, malware, sensitive information, and misconfigurations.
Images detailed report
A detailed report provides more detailed information about selected images, completed scans, and identified security issues. Each report includes the date and time of the last scan, the cluster containing the selected image, a risk assessment, and an assessment of compliance with security policy requirements. Kaspersky Container Security displays the number of objects with different severity levels based on identified vulnerabilities, malware, sensitive data, and misconfigurations.
In the block with the description of the applied image security policies, the application provides a list of image security policies and indicates whether this scan stage was completed successfully or with errors. The report also specifies the action performed by Kaspersky Container Security in accordance with a specific policy. In this case, the report may show that the CI/CD stage was blocked, that images were marked as non-compliant with security requirements, or that both of these actions were performed.
The Vulnerabilities section provides a list of identified vulnerabilities, their severity levels, the resource in which they were detected, and the image version in which the vulnerabilities were fixed.
The Malware and Sensitive data sections display lists of detected malicious objects and objects containing sensitive data. For each object, the severity level and path are indicated.
The Misconfigurations block provides a list indicating the names of files in which misconfigurations were identified, the severity levels of the misconfigurations, and the types of files (for example, a Docker file). It also specifies the detected issue and provides recommendations on resolving the issue.
Kaspersky Container Security receives a description of misconfiguration-related issues from the internal database for configuration file analysis. This includes modules that scan configuration files from: Kubernetes, Dockerfile, Containerfile, Terraform, Cloudformation, Azure ARM Template, and Helm Chart. The description of misconfigurations and remediation recommendations are presented in the same language as the specified scan modules. For example, the description of misconfigurations from Kubernetes is provided in English.
This database is updated when a new version of the application is released.
Risk acceptance report
The Risk acceptance report contains data on accepted risks, including the date and time they were accepted. You can generate a report on all accepted risks or a group of accepted risks based on a filter.
For each selected risk that you accepted, its name is specified in the following format:
- Risk type (vulnerability, malware, sensitive data, or misconfiguration).
- Risk name or ID.
- Risk severity.
Kaspersky Container Security provides the image name, name of the resource and repository where the specific risk was detected, and the image version in which the risk was fixed. The report table also displays the following information about risk acceptance:
- Risk acceptance scope.
- Time period after which the risk should be considered again when determining image security status.
- User who accepted the risk.
Kubernetes benchmarks reports
In Kaspersky Container Security, you can generate reports based on the results of objects checking for compliance with the Kubernetes benchmarks.
By default, reports are generated for nodes with all statuses - Passed, Warning, and Failed. If you need to generate a report for nodes with a specific scan status, in the Control status section located above the table, click the appropriate status button. Kaspersky Container Security updates the display of the compliance check results, and a report is generated for nodes with the relevant status.
Depending on the level of detail, the reports can be summary reports or detailed reports.
Kubernetes benchmarks summary report
A summary report provides consolidated information on the selected clusters. It lists the names of nodes with the specified compliance check status, as well as the date and time of the last check of each node. The report for all nodes displays information on the number of Kubernetes benchmarks with selected statuses that were detected during object scanning.
Kubernetes benchmark detailed report
A detailed report provides more detailed information about the nodes of the selected cluster or about a specific node of the cluster. It depends on which subsection of the solution you are generating the report from:
- A detailed report on the nodes of the selected cluster is created from the table with a list of clusters.
- A report on a node is generated on the page with the detailed description of that node.
For each node in the cluster selected for generating the report, the date and time of the last scan performed, the number of Kubernetes benchmarks with the scan statuses assigned to them, and the benchmarks that were assigned the statuses selected before the report generation are also listed.
Kubernetes benchmarks provide configuration baselines and recommendations for secure configuration of solutions and applications to improve protection against cyberthreats. Hardening is a process that helps protect against unauthorized access, denial of service, and other security events by elimination of potential risks.
Example of Kubernetes benchmarks
Page top
Cluster benchmarks report
The report provides information about the compliance of cluster resources with benchmarks. You can generate a report for one or more clusters.
The report includes the following information:
- Date and time when the report was generated.
- Name of the checked cluster. If the report is generated for multiple clusters, the report presents information broken down by cluster.
- Date and time of the scan.
- The categories and subcategories of controls selected when the report was generated. By default, the report is generated for all categories and subcategories of controls in the cluster. If you need to generate a report for resources in a specific category and subcategory of controls, specify the relevant categories or subcategories.
- Compliance score as a percentage.
- The number of controls that could not be checked.
- The number of resources in the cluster that are not compliant with benchmarks.
The report also includes a table with the following information about the compliance of cluster resources with benchmark controls:
- ID and name of the control
- Severity of the control
- Remediation recommendations
- Category of the control
- Compliance score as a percentage
- Number of non-compliant resources for each control found
Cluster benchmark controls represent the most important cluster configuration parameters that can be exploited by hackers conducting cyber attacks. The controls are based on a systematic description of cybersecurity hardening techniques and tactics in the MITRE and NSA/CISA benchmarks. Analyzing the compliance of cluster resources with benchmark controls allows ensuring an appropriate level of protection and timely identifying risks to the infrastructure.
By default, reports are generated for resources at all severity levels (Critical, High, Medium, and Low) that have been checked for compliance with all benchmarks (MITRE and NSA/CISA). If you need to generate a report for resources with a specific severity and a check for compliance with a specific benchmark, use the filter to select the values that you need. Kaspersky Container Security updates the display of the compliance check results, and a report is generated for resources with the relevant parameters.
Generating reports
In Kaspersky Container Security, reports are generated in different sections of the application depending on the specific report template that you are using.
The report generation process may take several minutes.
You can view a list of generated reports under Administration → Reports. In this section, generated reports can be downloaded as .HTML, .PDF, .CSV, .JSON, or .XML files.
Page top
Generating Images reports
To generate an Images summary report:
- Go to one of the following sections:
- Resources → Registries to generate a report on images from registries integrated with the solution.
- Resources → CI/CD to generate a report on images that are scanned in CI/CD.
Under Resources → CI/CD, reports are generated only for objects with the image artifact type (
container_imageorimage). In this section, a report cannot be generated for other types of artifacts.
- Depending on the section that you selected, do one of the following:
- In the Resources → Registries section, select a repository or one or more images for which you want to generate a report.
You can select all repositories and images by selecting the check box in the table header.
- In the Resources → CI/CD section, select one or more images for which you want to generate a report.
You can specify all images in all repositories by selecting the check box in the table header.
- In the Resources → Registries section, select a repository or one or more images for which you want to generate a report.
- Click the Create report button above the table, and select Images summary report in the drop-down list.
- In the window that opens, confirm report generation.
To generate an Images detailed report:
- Go to one of the following sections:
- Resources → Registries to generate a report on images from registries integrated with the solution.
- Resources → CI/CD to generate a report on images that are scanned in CI/CD.
Under Resources → CI/CD, reports are generated only for objects with the image artifact type (
container_imageorimage). In this section, a report cannot be generated for other types of artifacts. - Components → Scanners → Scanner tasks to generate a report based on an image scanned as part of a scan task.
- Depending on the section that you selected, do one of the following:
- Under Resources → Registries, perform the following steps:
- Select a repository or one or more images for which you want to generate a report.
- Click the Create report button above the table, and select Images detailed report in the drop-down list.
- Under Resources → CI/CD, complete the following steps:
- Select a repository or one or more images for which you want to generate a report.
- Click the Create report button above the table, and select Images detailed report in the drop-down list.
- Under Components → Scanners → Scanner jobs, complete the steps specified below:
- In the list of scanner tasks, select the scanned object for which you want to generate a report. You can select only one image from the page with a detailed description of the scan results for this image.
- In the window containing the object scan results, click the Create report button located to the right of the description of the object's compliance with security policy requirements.
A scan results window with a Create report button opens only for scanner jobs that have Finished status.
- Under Resources → Registries, perform the following steps:
- In the window that opens, confirm report generation.
Generating Risk acceptance reports
To generate a Risk acceptance report:
- Go to the Policies → Risk acceptance section.
By default, a report is generated for all accepted risks, which are displayed in the table. If necessary, you can generate a report for specific objects. To specify the objects for which you want to generate a report, perform one or more of the following actions:
- In the Search field, enter a risk name, repository name, or image name.
- Use the Risk type drop-down list above the table to select objects by risk type.
- Use the Vendor fix drop-down list above the table to select objects by risk type.
- Click the Create report button above the table.
Kaspersky Container Security will start generating a report, and will prompt you to follow a link to a page containing a list of generated reports.
Generating Kubernetes benchmark reports
To generate a Kubernetes benchmarks summary report:
- Go to Compliance → Kubernetes benchmarks.
- In the Cluster field, select one or more clusters to generate a report for.
You can generate a report on all clusters by selecting All from the Cluster drop-down list.
- Above the table, under Control status, select check statuses for which you want to generate a report: Passed, Warning, or Failed.
All statuses are selected by default.
- Click the Create report button above the table, and select Summary report from the drop-down list.
- In the window that opens, confirm report generation. You can download the generated report in .HTML, .PDF, .CSV, .JSON, and .XML formats in the Administration → Reports section.
To generate a Kubernetes benchmarks summary report:
- Go to Compliance → Kubernetes benchmarks.
- Above the table, under Control status, select check statuses for which you want to generate a report: Passed, Warning, or Failed.
All statuses are selected by default.
- Do one of the following:
- In the Cluster field, select the cluster for which you want to generate a report, and complete the following steps:
- Click the Create report button above the table.
- Select Detailed report from the drop-down list.
- In the table with the check results, click the cluster name and complete the following steps:
- Click the name of a node in the selected cluster.
Kaspersky Container Security displays the available data on the Kubernetes benchmarks that was obtained for this node during the scan.
- Click the Create report button above the table.
- Click the name of a node in the selected cluster.
- In the Cluster field, select the cluster for which you want to generate a report, and complete the following steps:
- In the window that opens, confirm report generation. You can download the generated report in .HTML, .PDF, .CSV, .JSON, and .XML formats in the Administration → Reports section.
A Kubernetes benchmarks detailed report is generated for one cluster only. However, it contains information about all nodes in this cluster.
To get detailed reports for multiple clusters, you must generate a report for each cluster separately.
Generating cluster benchmarks reports
To generate a Cluster benchmarks report for a single cluster:
- Go to the Compliance → Cluster benchmarks section.
- Do one of the following:
- In the table, select the check box for the cluster for which you want to generate a report.
- Click the cluster name in the table and go to the window with the cluster resource check results.
- Click the Create report button, which is located:
- Above the table, if you selected the cluster using the check box.
- Above the check date and time selection field, if you have navigated to the window with the results of the cluster resource check.
- In the window that opens, confirm report generation. You can download the generated report in .HTML, .PDF, .CSV, .JSON, and .XML formats in the Administration → Reports section.
To generate a Cluster benchmarks report for multiple clusters:
- Go to the Compliance → Cluster benchmarks section.
- In the table, select the check boxes for the clusters for which you want to generate a report.
- Click the Create report button, which is located above the table.
- In the window that opens, confirm report generation. You can download the generated report in .HTML, .PDF, .CSV, and .JSON formats in the Administration → Reports section.
Downloading and deleting reports
Kaspersky Container Security displays a list of generated reports in the table in the Administration → Reports section.
For each generated report, the table provides the name that the application assigned to the report, the report template, the date and time of report creation, and the report generation status. The table also lets you download a successfully generated report in the desired format, or delete a report.
To download a report:
In the row containing the report, click the button for the relevant format: .PDF, .HTML, .CSV, .JSON, or .XML.
To delete a report:
- In the row containing the name of the report that you want to delete, click the delete icon ().
- In the window that opens, confirm the action.
File Threat Protection
Kaspersky Container Security uses the File Threat Protection component to search and analyze potential file threats in order to protect containerized files (including files in archives and email) from malware. If malware is detected, Kaspersky Container Security can block or delete the infected object, and terminate the malicious process started using that object. The results of malware scan are displayed together with the overall scan results.
You can enable or disable File Threat Protection and configure protection settings:
- Select the file interceptor operation mode (audit or blocking objects).
- Select a file scan mode (when opened, when opened and modified).
- Enable or disable scanning of archives, mail databases, email messages in text format.
- Temporarily exclude plain text files from re-scanning.
- Limit the size of an object to be scanned and the scan duration.
- Select the actions that the solution will perform on infected objects.
- Configure scan scopes. Kaspersky Container Security will scan objects in the specified area of the file system.
- Configure the use of the heuristic analyzer and the iChecker technology during a scan.
- Enable or disable the recording of information about scanned uninfected objects, scanning of archived objects, and unprocessed objects to the security event log.
The File Threat Protection settings can be activated under Policies → Runtime policies → Container runtime profiles, configured in the File Threat Protection settings window, and applied to all existing runtime policies.
If you do not want File Threat Protection to be activated when a certain security environment policy is started, disable it in the policy settings using the Disabled / Enabled toggle. Also, make sure that File Threat Protection is not running under a different applicable runtime policy.
Configuring the File Threat Protection settings
Configuring File Threat Protection requires the IS Administrator permissions.
To configure File Threat Protection:
- In the Policies → Runtime policies → Container runtime profiles section, click the Settings button.
The window for configuring the File Threat Protection settings opens.
- Under File interceptor mode, select one of the following object scan modes:
- In the Audit mode, the solution scans and keeps track of the content of objects.
- In the Enforce mode, the solution blocks all objects that do not satisfy the configured rules and criteria.
- Under Scan mode, select a File Threat Protection mode:
- Smart mode (default): a file is scanned on attempts to open it, and then scanned again on attempts to close it if the file has been modified. If a process accesses an object multiple times in the course of its operation and modifies it, the solution scans the object again only when the process closes it for the last time.
- Open and modify: a file is scanned on attempts to open it, and then scanned again on attempts to close it if the file has been modified.
- Open: a file is scanned on attempts to open it for reading, execution, or modification.
- Under Actions on detected objects, select the following from the drop-down lists:
- The First action that the File Threat Protection component will perform on a detected infected object:
- Perform recommended action that depends on the risk severity level detected in the file and the possibility of disinfecting it (default).
For example, Trojans are deleted immediately as they do not infect other files and disinfection is not applicable here.
- Disinfect the object. A copy of the infected object will be moved to backup.
- Block access to the object.
- Remove an object. A copy of the infected object will be moved to backup.
- Perform recommended action that depends on the risk severity level detected in the file and the possibility of disinfecting it (default).
- The Second action that the File Threat Protection component will perform on a detected infected object if the first action fails:
- Perform recommended action that depends on the risk severity level detected in the file and the possibility of disinfecting it (default).
- Disinfect the object. A copy of the infected object will be moved to backup.
- Block access to the object.
- Remove an object. A copy of the infected object will be moved to backup.
We recommend specifying both actions for detected objects.
Consider the following when selecting actions to perform on detected objects:
- If Block or Remove is selected as the first action, the second action does not need to be specified.
- If the second action is not selected, the default action is Block.
- If the applicable runtime policy mode is set to Audit, no action is taken on detected objects.
- The First action that the File Threat Protection component will perform on a detected infected object:
- Under Scan settings, use the check boxes to define the scan objects that contain files and directories to scan. If a check box is selected, the solution scans the selected objects. You can select one or several scan settings from the following list:
- Scan archives: this check box enables or disables archive scanning. By default, the check box is cleared and the solution does not scan archives.
The solution scans archives in such formats as .ZIP, .7Z *, .7-Z, .RAR, .ISO, .CAB, .JAR, .BZ, .BZ2, .TBZ, .TBZ2, .GZ, .TGZ, .ARJ, as well as .SFX self-extracting archives. The list of supported archive formats depends on the databases used.
If archive scanning is enabled and Perform recommended action is set as the first action on a detected object, the solution deletes the infected object or the entire archive containing the threat, depending on the archive type.
You can define the scope of archives for scanning by specifying Self-extracting archives or All archives. If you choose to scan self-extracting archives, the solution scans only archives that contain an executable unpacker.
To start scanning, the solution first unpacks the archive, which may slow down the scan. You can reduce the duration of archive scanning by enabling and configuring the Skip object if scan takes longer than (sec) and Skip objects larger than (MB) settings.
- Scan mail databases: this check box enables or disables scanning of Microsoft Outlook, Outlook Express, The Bat! and other mail application databases. By default, the check box is cleared, and the solution does not scan mail database files.
- Scan plain mail: this check box enables or disables scanning of plain text email message files. By default, the check box is cleared and the solution does not scan plain text messages.
- Skip text files: this check box enables or temporarily disables scanning of plain text files if they are reused by the same process within 10 minutes after the last scan. This setting allows you to optimize scanning of application logs. By default, the check box is cleared and the solution does not scan plain text files.
- Skip object larger than (MB): this check box enables or disables scanning of objects with the specified maximum size in megabytes. If the size of an object to be scanned exceeds the specified value, the solution skips the object during scanning.
Available values: 0–999999. If the value is set to 0, the solution scans files of any size.
Default value: 0.
- Skip object if scan takes longer than (sec): this check box enables or disables time limit in seconds for scanning an object. After the specified time expires, the solution stops scanning the file.
Available values: 0–9999. If the value is set to 0, the scan time is unlimited.
Default value: 60.
- Scan archives: this check box enables or disables archive scanning. By default, the check box is cleared and the solution does not scan archives.
- In the Technologies section, select the check boxes to define the technology that the solution will use to scan objects. You can select one of the following options:
- Use iChecker: this check box enables or disables scanning of only new files and files that have been modified since the last scan. iChecker is a scanning method that reduces the overall scan time by skipping some of the previously scanned files that have not been modified since the scan.
If the check box is selected, the solution scans only new files and those modified since the last scan. If the check box is cleared, the solution scans files regardless of their creation or modification dates.
The check box is selected by default.
- Use heuristic analysis: this check box enables or disables the use of heuristic analysis when scanning objects. Heuristic analysis enables the solution to identify security threats unknown to malware analysts.
The check box is selected by default.
If the Use heuristic analysis check box is selected, you can select the heuristic analysis level. A heuristic analysis level balances the rigor of security threat scanning, the load on the operating system, and the scan duration. The higher the level, the more resources the scan requires, and the longer it takes. You can select one of the following options:
- Recommended (default): the optimal level recommended by Kaspersky experts. This provides an optimal combination of protection quality and impact on the performance of protected servers.
- Light: the least detailed scan, minimal system load.
- Medium: medium scan detail, balanced system load.
- Deep: the most detailed scan, maximum system load.
- Use iChecker: this check box enables or disables scanning of only new files and files that have been modified since the last scan. iChecker is a scanning method that reduces the overall scan time by skipping some of the previously scanned files that have not been modified since the scan.
- Under Event logging, select the check boxes to determine whether the event will be recorded in the security event log. You can select one or several options for event logging:
- Log clean objects: this check box enables or disables the logging of information about scanned objects that the solution has recognized as uninfected.
- Log unprocessed objects: this check box enables or disables the logging of information about scanned objects that have not been processed for any reason.
- Log packed objects: this check box enables or disables logging of information about scanned objects that are part of composite objects, such as archives.
If the check box is selected, the solution logs the event for all objects. If the check box is cleared, the event is not logged. The check box is cleared by default.
- Click Save.
File interceptor operation
When running object scan jobs, File Threat Protection uses the file operation interceptor. It is set to one of the following file interception modes (InterceptorProtectionMode):
- Enforce (default): blocks files for the duration of the scan job that uses the file interceptor. No file can be accessed until the scan has been completed. When detecting infected objects, the solution performs the actions specified in the settings under Actions on detected objects.
- Audit: does not block files during the scan job that uses a file interceptor. Access to any file is allowed; scanning is performed asynchronously. When infected objects are detected, the solution only records an event in the Event Log. The actions specified in the settings under Actions on detected objects are not performed.
If the Audit value is selected, the solution enables the notification mode of File Threat Protection.
The configured component settings are applied when File Threat Protection is activated in runtime policies. These settings are the same for all created runtime policies. If the applicable runtime policy is set to audit mode and InterceptorProtectionMode in File Threat Protection is set to Enforce, the solution blocks the files.
Database updates
The File Threat Protection databases are kept up to date to ensure the maximum level of containerized object protection against file threats. Updates run automatically on a schedule or on demand.
When a new agent is deployed, the solution updates and then applies the updated File Threat Protection databases.
When the solution is deployed in a public corporate network, an update is performed directly from the update server. When installing the solution in a private corporate network, the updated File Threat Protection databases are added to the kcs-updates container for subsequent running and updating.
Applying updated databases to a running agent does not violate active runtime protection of nodes. Database updates are recorded in the event log.
If an error occurs while updating the databases, the solution cancels the File Threat Protection updates and continues using the previously installed databases. Errors that occur during the update are logged to the events.db file located in the node-agent pod.
The events.db file is available if File Threat Protection is enabled for the group of agents.
Page top
Force disabling of File Threat Protection
In Kaspersky Container Security 2.0, you can completely disable the File Threat Protection component. This can be necessary if you experience problems with the component.
You can forcibly disable the File Threat Protection component in two ways—by modifying the file for deploying agents on the cluster, and by modifying running agents.
To forcibly disable File Threat Protection using an agent deployment file:
- Open the .YAML file with instructions for deploying agents on the cluster that you downloaded when you deployed the agents.
- In the
DaemonSetsection for the node-agent, set theFILE_THREAT_PROTECTION_ENABLEDenvironment variable tofalse.name: FILE_THREAT_PROTECTION_ENABLEDvalue: false - Save changes to the instructions file.
- In the console, apply the instructions file by running
kubectl apply -f agents.yamlThe orchestrator redeploys the node-agent pods with File Threat Protection disabled.
To forcibly disable File Threat Protection when agents are running:
- In the console, open running agents using the
kubectl editcommand. - In the
DaemonSetsection for the node-agent, set theFILE_THREAT_PROTECTION_ENABLEDenvironment variable tofalse.name: FILE_THREAT_PROTECTION_ENABLEDvalue: false - Save your changes.
The orchestrator applies the saved changes and disables File Threat Protection.
Users, roles, and scopes
This section describes how to work with users and user roles, and provides instructions on how to create, edit, and delete them. This section also describes how to use scopes to give different levels of access to different user roles.
Managing users
Multiple users can have access to Kaspersky Container Security. A user account is created for each user, and one or more user roles are assigned to them.
The list of Kaspersky Container Security users is displayed in the table in the Administration → Access management → Users section.
You can do the following:
- Add users.
- View and edit user account settings.
- Reset password for the selected accounts.
- Delete users.
- Sort values in the list of users by clicking the icon in the corresponding column (displayed user name, user name, assigned role). Sorting can be done in alphabetic order and reverse alphabetical order.
- Search by user name by using the Search by user name field above the table.
About user roles
A user role in Kaspersky Container Security is a set of permissions to perform certain actions in the solution web interface. Depending on their role, users have access to different sections and functional capabilities.
Kaspersky Container Security provides user roles as well as system roles, which have predefined sets of access permissions to perform common tasks for protecting container environments.
The following system roles are provided during initial installation of the solution:
- The Administrator of Kaspersky Container Security role is intended for users who are tasked with deploying and supporting the infrastructure and system software required for the solution to work (for example, operating systems, application servers, and databases). These users manage user accounts, roles and access permissions in Kaspersky Container Security.
In the web interface, this role is indicated by the KCSADM abbreviation.
- The Information Security Administrator (IS Administrator) role is intended for users who are tasked with creating and managing user accounts, roles and access permissions of users, changing settings, connecting public image registries, Agents and outputs, and configuring security policies.
In the web interface, this role is indicated by the ISADM abbreviation.
- The IS auditor role is intended for users who view the resources and user list of a solution, and who monitor the results of scans and compliance checks.
In the web interface, this role is indicated by the ISAUD abbreviation.
- The IS officer role is intended for users who view and manage security policies, connect public image registries, and view the results of runtime container analyses for projects in which these users are directly involved.
In the web interface, this role is indicated by the ISOFF abbreviation.
- The Developer role is intended for users who perform compliance checks and view the results of scanning images from registries and CI/CD, cluster resources and accepted risks.
In the web interface, this role is indicated by the DEV abbreviation.
You can assign system roles to user accounts when creating or viewing these user accounts.
Multiple user roles can be assigned to a user.
If a specific system role is not needed, you can delete it.
However, you cannot delete the last active system role that has permissions to manage other roles.
If the available system roles do not offer the required access permissions, you can create your own unique sets of permissions as custom roles.
When creating custom roles, consider the necessary set of permissions for accessing related functionalities. For example:
- To view and configure the settings of the response policies, you need permission to view integrations with notification services. If this permission is not granted, Kaspersky Container Security will display an error when you try to configure a response policy.
- Permissions to manage response policies must be granted with permissions to manage notifications, otherwise, you will not be able to select the outputs in the policy settings.
- To create a user, you need permission to view and manage roles. If such permission is not granted, only the dashboard is displayed to the created user.
- The permission to manage users must be granted together with the permission to manage roles, otherwise you will not be able to assign a role when creating a user.
You can assign user roles to user accounts just like with system roles. In addition, you can also change the settings of user roles and delete user roles.
When assigning the scopes to roles, you must take into account that a security policy can be implemented within a specific scope only if this scope is assigned to one of your roles.
If you integrated the solution with an LDAP server, Kaspersky Container Security also receives and displays the roles and user groups from the Active Directory service.
Page top
Working with system roles
The table below lists the main actions that are available to users with system roles in the Kaspersky Container Security web interface after installation.
User roles and their available actions
Action |
Administrator of Kaspersky Container Security |
IS Administrator |
IS auditor |
IS officer |
Developer |
|---|---|---|---|---|---|
View image scan results |
|
|
|
|
|
Manually start scanning images |
|
|
|
|
|
Manage risks (accept a risk, edit a risk and cancel risk acceptance) |
|
|
|
|
|
View accepted risks |
|
|
|
|
|
View clusters |
|
|
|
|
|
Manage clusters |
|
|
|
|
|
View registries |
|
|
|
|
|
Add an image to a registry |
|
|
|
|
|
Delete a repository/image from a registry |
|
|
|
|
|
View CI/CD scan results |
|
|
|
|
|
Manage CI/CD scanning |
|
|
|
|
|
View and manage agents |
|
|
|
|
|
View benchmark compliance check results |
|
|
|
|
|
Start benchmark compliance check |
|
|
|
|
|
View scanner policies |
|
|
|
|
|
Manage scanner policies |
|
|
|
|
|
View assurance policies |
|
|
|
|
|
Manage assurance policies |
|
|
|
|
|
View response policies |
|
|
|
|
|
Manage response policies |
|
|
|
|
|
View runtime policies |
|
|
|
|
|
Manage runtime policies |
|
|
|
|
|
Manage autoprofile settings |
|
|
|
|
|
View the File Threat Protection settings |
|
|
|
|
|
Manage the File Threat Protection settings |
|
|
|
|
|
View the list of users |
|
|
|
|
|
Manage users |
|
|
|
|
|
View roles and permission sets |
|
|
|
|
|
Manage roles and permission sets |
|
|
|
|
|
View scopes |
|
|
|
|
|
Manage scopes |
|
|
|
|
|
View the default scope |
|
|
|
|
|
Manage the default scope |
|
|
|
|
|
View the event log |
|
|
|
|
|
View licensing information |
|
|
|
|
|
Manage licensing settings |
|
|
|
|
|
View image registry integrations |
|
|
|
|
|
View image registry integrations |
|
|
|
|
|
View integrations with image signature validators |
|
|
|
|
|
Manage integrations with image signature validators |
|
|
|
|
|
View integrations with notification systems |
|
|
|
|
|
Manage integrations with notification systems |
|
|
|
|
|
View reports |
|
|
|
|
|
Manage reports |
|
|
|
|
|
View and manage integration with LDAP server |
|
|
|
|
|
View and manage authentication settings |
|
|
|
|
|
View information about the state of the core components |
|
|
|
|
|

Displaying list of roles
Kaspersky Container Security displays the list of active roles in the Administration → Access management → Roles section.
The table presents all active system roles and user roles and indicates ID, name, and number of users assigned to the specific role. If you have configured integration with LDAP, the table also shows Active Directory user groups that correspond to the user roles in Kaspersky Container Security.
Page top
About scopes
In Kaspersky Container Security, a scope is a resource list of reasons why the solution is being used (e.g. specific cluster, multiple external registries, or specific namespaces).
Scopes are used for the following purposes:
- To differentiate access to resources, for example, in order to monitor the operation of clusters, registries, or namespaces.
This access control is performed by assigning a scope when creating a scope or editing its settings.
- To distinguish the objects that policies and scans are applied to.
These objects are differentiated by assigning a scope when creating security policies or editing their settings.
In Kaspersky Container Security, you can add your own scopes or assign the default global scope to users.
The default scope includes access to all solution resources. This scope is added by default during installation of Kaspersky Container Security.
You cannot change the settings of the default scope or delete it.
Only a user with the appropriate rights can access the default scope. To assign default scope to other users and roles, you need to have permission to manage the default scope.
If you assign the default scope to a policy, the policy will be applied to all resources and applied in all environments.
Page top
Scopes and enforcement of security policies
In Kaspersky Container Security, scopes are specified for all security policies. To ensure that all necessary resources are scanned, each policy can be assigned one or more scopes. Moreover, the same scope can be specified in multiple policies.
Regardless of the number of policies implemented in a scope (for example, when scanning an image or scanning a cluster in a runtime), all security policies are applied.
When multiple security policies and multiple scopes are applied simultaneously, the following rules apply:
- For scanner policies: scanning is performed using a cumulative list of settings that is obtained by combining all scanner policies in force within the scope.
- For assurance policies: when scanning images, all policies applicable to the scanned resources are applied, in line with specified scopes.
- For response policies: when events occur, the user is notified using the notification tools specified in all response policies applicable to resources specified in the assigned scopes.
- For runtime policies: containers are monitored and, if necessary, blocked from running in the runtime in accordance with all applicable policies assigned to the scope.
If a scope includes an object subject to a runtime policy in Audit mode and a runtime policy in Enforce mode, all actions specified in the runtime policies are applied in Enforce mode.
Switching between scopes
In Kaspersky Container Security, several scopes can be assigned to a role. You can view the list of available scopes or switch scopes in order to access resources available in a different scope.
When switching between scopes, bear in mind the following:
- If you select the scope with resources by registry, in the Resources → Clusters section, Kaspersky Container Security does not display a list of clusters, namespaces, and pods. A full visual representation of the links between resources is displayed, but you cannot view information about an object that is outside of the available scope.
- Select the scope with resources by cluster, in the Resources → Registries section. Kaspersky Container Security then displays a list of the images used to start the containers in clusters.
- In the Scanners section, you can view lists of all scanners and scan tasks. However, you will not be able to view information about a scanned object if it is not within a scope that is available to you.
- In the Compliance → Kubernetes benchmarks section, Kaspersky Container Security displays a list of all nodes within clusters in the scope, regardless of the level of cluster detail in the scope. However, you cannot view information about a cluster node if it is not within a scope that is available to you.
- In the Policies section, Kaspersky Container Security shows the following:
- All policies in which at least one of the author's roles matches your role.
- All policies in which at least one scope matches the scope you selected.
- All policies that are linked to scopes assigned to your roles. However, you cannot delete these policies or edit their settings.
To switch the scope:
- Go to one of the following sections:
- Resources → Clusters.
- Resources → Registries.
- Compliance → Kubernetes benchmarks.
- Subsections of the Policies section: Scanner policies, Assurance policies, Response policies, or Runtime policies.
- In the drop-down list of available scopes in the upper right part of the window, select the required scope.
You can also activate all the scopes by selecting All in the list.
Adding users, roles, and scopes
To add a user account:
- In the Administration → Access management → Users section, click the Add user button above the list of users.
- In the window that opens, specify the following settings:
- User name is a unique value that must be assigned to a user for identification within Kaspersky Container Security.
A user name can include only letters of the English alphabet and numerals. The minimum user name length is 4 characters, and the maximum user name length is 254 characters.
- Display name (optional) is the value that is displayed in the solution web interface. If this parameter is not specified, the user name is displayed in the web interface.
- Email (optional).
- User name is a unique value that must be assigned to a user for identification within Kaspersky Container Security.
- Enter the password in the Password field.
Passwords have the following requirements:
- The password must contain numerals, special characters, and uppercase and lowercase letters.
- The minimum password length is 6 characters, and the maximum password length is 72 characters. The default password length is 8 characters.
- Confirm the entered password in the Confirm password field.
- Select the check box if the user should change the password the next time the solution starts.
- Assign a role to the user by selecting from the list of available roles.
While you are not required to assign a role when creating a user, a new user without an assigned role will not be able to interact with Kaspersky Container Security.
- Click Add.
To add a user, permission to view and configure settings is required. If you do not have this permission, any user you add will only be able to view the main page of the solution.
To add a user role:
- In the Administration → Access management → Roles section, click the Add role button above the list of roles.
- In the window that opens, specify the following values:
- Role ID is a unique value that must be assigned to a role for identification within Kaspersky Container Security.
The role ID can include uppercase Latin letters and numbers. A role ID cannot contain special characters or spaces.
- Role name is the value displayed in the solution web interface.
- Description (optional).
- Scope is a setting that is used to differentiate access to resources.
- Role ID is a unique value that must be assigned to a role for identification within Kaspersky Container Security.
- In the Active Directory mapping field, specify the Active Directory groups that the user belongs to.
- Select the check boxes next to the permissions that will be available for the role being added.
- Click Add.
To add a scope:
- In the Administration → Access management → Scopes section, click the Add scope button above the table with the list of scopes.
- In the window that opens, specify the scope name and, if necessary, a scope description.
- In the Resources section, select the resources for the scope:
- Click the Add resources by registry button, and in the drop-down list, select the registries for the scope. You can define a more specific scope by selecting specific repositories and images from these repositories in the drop-down list.
- Click the Add resources by cluster button and select the orchestrators for the scope from the drop-down list. You can define a more specific scope by selecting specific clusters, namespaces, and images from the orchestrators used to deploy the containers in the clusters.
You must specify at least one resource for which access is granted for monitoring.
- Click Set objects to scope.
- Save the scope by clicking the Save button.
Resetting password for user accounts
To reset the password for a user account,
- Go to the Administration → Access management → Users section.
- Do one of the following:
- In the user list, select the row of the specific user account, then click the Reset password link above the table.
- In the user account row, open the menu () and select Reset password.
Changing settings for users, roles, and scopes
To edit a user account:
- In the Administration → Access management → Users section, click the user name in the list of users.
- In the opened window, make the necessary changes.
If you make changes to a user account with the administrator privileges, do not delete all roles, since doing so results in the loss of administrator access to the solution.
- Click Save.
To edit a user role:
- In the Administration → Access management → Roles section, click the role identifier in the Role ID column in the list of roles.
- In the opened window, make the necessary changes.
- Click Save.
After a role is modified, all users with the assigned role must be reauthorized.
You cannot edit a role if it is the last active system role with rights to manage user accounts, user roles, or the default scope.
To edit a scope:
- In the Administration → Access management → Scopes section, click on the scope name in the Scope name column of the table with the list of scopes.
- In the opened window, make the necessary changes.
- Click Save.
Removing users, roles, and scopes
To delete a user account:
- In the Administration → Access management → Users section, do one of the following:
- Select the user from the row of the specific user account, then click the Delete link above the table containing the list of users.
You can select one or more user accounts.
- In the row with the user account, open the menu () and select Delete user.
- Select the user from the row of the specific user account, then click the Delete link above the table containing the list of users.
- In the window that opens, confirm deletion by clicking Delete.
The user account used for authorization in Kaspersky Container Security cannot be deleted.
To delete a user role:
- In the Administration → Access management → Roles section, in the role row in the list of roles, click the deletion icon ().
- In the window that opens, confirm deletion by clicking Delete.
You cannot delete the last active system role with rights to manage other user accounts, user roles, or the default scope.
You also cannot delete a role if it is assigned to any user.
To delete a scope:
- In the Administration → Access management → Scopes section, in the role row in the list of scopes, click the delete icon ().
- In the window that opens, confirm deletion by clicking Delete.
You cannot delete the default scope.
You also cannot delete a scope if it is assigned to a different active user role.
Using Kaspersky Container Security OpenAPI
Kaspersky Container Security implements an Open Application Programming Interface (OpenAPI) that provides access to the functionality of the solution. For example, you can use Kaspersky Container Security OpenAPI to get information about solution components, create, modify, and delete objects, generate reports, and perform other actions.
For a full list of actions that you can perform using Kaspersky Container Security OpenAPI, please refer to the documentation describing OpenAPI requests.
The documentation for OpenAPI requests is available under Technical documentation in the Settings → About section. The documentation is a developer's guide in English. The developer's guide also provides code examples and detailed descriptions of callable items that are available in requests to the API server.
JSON is used to represent data in requests and responses.
Security event log
In the Administration → Events section, Kaspersky Container Security displays the occurred events that can be used for informational purposes, to track ongoing processes, to analyze security threats, and to determine what caused the solution failures.
Kaspersky Container Security displays the following types of events:
- Audit events. This group of events includes user activity audit data, such as information about configured settings of the solution, user authentications, changes in groups, and modifications or deletion of information within the solution.
- Solution operating results. These events include alerts about a triggered response policy.
- Records of the internal operations of solution applications.
Kaspersky Container Security shows the following security event categories:
- Administration—all events related to solution administration are logged.
- Policies (scanner policies, assurance policies, response policies, runtime policies) — events related to compliance or non-compliance of an image with applicable policies.
- Malware — events that occur when malware is detected during a scan of images and nodes.
- Sensitive data — events related to the detection of exposed sensitive data during a scan (for example, scanned images, functions, and nodes).
- Non-compliance — the following events are recorded:
- Detection of non-compliant images.
- Functions that do not comply with requirements, and runtime implementation of these functions.
- Nodes that do not comply with requirements, and runtime actions of these nodes.
A list of security events is displayed for a specific period. You can select one of the provided options or define your own time period. For any period you select, the time count begins from the current day. Events for the last week are displayed by default.
Kaspersky Container Security displays the events that occurred during scans. The events are displayed as a table for the following components:
- Administration.
- Alerts.
- CI/CD.
- Policies.
- Resources.
- Runtime.
- Scanners.
- API.
For each event, the table indicates the date and time of the event, IP address of the user, description, and status. The user name is listed for some events, such as those involving Administration, Malware, and Sensitive data categories. The security threat level is also indicated for Alerts. For events related to the Scanners component, the identifiers generated by the solution and the status of the scan jobs are also logged. For Runtime, the mode (Audit or Block), cluster, and deployed pod are indicated.
The security event log of Kaspersky Container Security is maintained and stored in PostgreSQL and does not have data protection mechanisms.
Information about the status of solution components
Kaspersky Container Security lets you view information about the status of components and integrations to diagnose and improve the operation of solution components and integrated third-party services. Status monitoring with the provision of performance data is conducted for the following components:
- Core components. Information is provided in the Components → Core section.
- Agents. The data is displayed in the Components → Agents section.
- Active integrations. Information is provided in the Administration → Integrations section.
Up-to-date data on the status of Kaspersky Container Security components is also recorded in the security event log.
You can view information about the status of solution components regardless of the status of the license (a license can be valid or expired).
Core status
Information on the status of the core components of Kaspersky Container Security is displayed in a table in the Components → Core section.
The following data is provided for each core component:
- Component name. The solution displays the components included in the distribution kit.
- Pod name (for example, kcs-postgres-0, kcs-scanner-xxx, or kcs-ih-xxx).
- Status. The solution assigns one of the following statuses:
- Good—the component is operating normally.
- Warning—the component detected malfunctions that do not impede the overall implementation of the component.
- Error—the component cannot be implemented due to its incorrect operation.
If the solution assigns the Warning or Error status to a kernel component, Kaspersky Container Security displays a brief description of the component failure.
The status is assigned in accordance with the data of the last heartbeat message for the component, according to the entry in the security event log.
- A log with a record of component events (for example, errors). You can download the log in text document format by clicking the Download log button in the Pod log column.
To view data on the status of kernel components, you must have rights to view the Core component. By default, these permissions are granted to the IS Administrator role.
Agent status
Information on the status of Kaspersky Container Security agents is presented as a table in the Components → Agents section; it is also expanded in the sidebar for the selected agent.
The table displays the following information for each agent within an agent group:
- Agent name.
- Status. The solution assigns one of the following connection statuses:
- Connected means the agent is connected and is functioning normally.
- Disconnected means the agent is disconnected.
- Pending means the solution is in the process of connecting the agent.
The status is assigned in accordance with the data of the last heartbeat message for the agent, according to the entry in the security event log.
- Version. The solution displays the current version of the agent. If a new version of the agent is available for the installed version of Kaspersky Container Security, the latest available agent version is displayed.
- Pod. The solution displays the name of the pod in which the agent is deployed.
- Information received as part of node status monitoring. The solution provides information about network activity monitoring and analysis actions, processes in containers, and File Threat Protection. For each action (Container processes, Network connections, and File Threat Protection), its status is displayed—Enabled or Disabled. If an agent is disconnected, all node status monitoring actions have the Disabled status.
If the agent is connected, the last status of the agent is also displayed for each action—Success, Not available, or Error. If Error is displayed, the solution displays a brief description of the error and associated details.
The statuses of the agent components responsible for monitoring network connections, processes inside containers, and file operations, as well as File Threat Protection, are available only for connected node-agent agents. For kube-agent agents, the status of these components is always Not available.
The solution displays this information based on the security event log records.
- SIEM status The solution displays the name of the SIEM system and one of the following connection statuses:
- Success if the agent is connected to a specific SIEM system, and event messages are being correctly sent to that SIEM system.
- Warning if the agent is connected to a specific SIEM system, and event messages are being correctly sent to that SIEM system. However, the linked SIEM of the agent differs from the SIEM system specified in the agent group settings.
- Error if an error occurred while connecting the agent to the SIEM system or sending messages. It is also considered an error if exported runtime events are not defined for the integration linked with the agent.
If the agent is not linked to a SIEM system, the solution indicates no connection.
For the kube_agent, the connection status is never indicated because the SIEM system communicates only with node-agent agents.
- Date and time of last connection.
You can view information about the status of a specific agent in the sidebar. To open the sidebar, click the agent name in the table. Kaspersky Container Security displays the following information about the selected agent:
- Agent name.
- IP address of the node where the agent is deployed.
- Name of the node where the agent is deployed.
- Pod name.
- Agent type.
- Agent version.
- The agent connection status—Connected, Disconnected, or Pending.
- Date and time when the agent last connected
- Under Node monitoring statuses, the solution displays information about the last registered state of the agent (Success, Not available, or Error) for each node monitoring action (Container processes, Network connections, and File Threat Protection). If an action is disabled to avoid unnecessary workload on nodes, the Disabled status is displayed.
- Under Agent group, the solution displays the following information about the agent group to which the selected agent belongs:
- Group name
- Namespace
- Orchestrator
To view information about the status of agents, you need permissions to view and manage the Agents component. By default, these permissions are granted to the IS Administrator role.
Page top
Integrations status
Information about the status of active Kaspersky Container Security integrations is displayed in the Administration → Integrations section. The solution displays status information for the following types of integrations:
To view information about the integration status, you need the following permissions:
- Permissions to view integrations with image registries. By default, these permissions are granted to the IS Administrator, IS Auditor, and IS Officer roles.
- Rights to view integrations with outputs. By default, these permissions are granted to the IS Administrator and IS Auditor roles.
- Permissions to view and manage the LDAP server integration. By default, these permissions are granted to the IS Administrator role.
Ensuring safety and reliability of components
To ensure safety and reliability of components, the following Auto Care mechanisms are implemented in Kaspersky Container Security:
- Automatic deletion of image scan history and system events. If data is kept for more than 90 days, it is considered obsolete and deleted.
Obsolete entries are checked once an hour.
- Automatic reconnection in case of a connection failure. Kaspersky Container Security conducts reconnection attempts every 30 seconds until the connection is restored.
Automatic reconnection is not performed for integrations with external registries and the LDAP server. They are connected when the solution sends a connection request.
- Image rescanning after a failed scan attempt. The scanner re-scans images until they are scanned or the number of scan attempts is exceeded.
Managing the dynamics of data accumulation
The operation of the Kaspersky Container Security components results in accumulation of a large amount of data, which require considerable disk space resources for storage. You can manage the dynamics of data accumulation by limiting the storage period and cleaning the database.
The following components of the solution carry the greatest load on the disk space:
- PostgreSQL DBMS
- S3 compatible file storage
- ClickHouse DBMS
PostgreSQL DBMS
We recommend that you contact the solution deployment engineer or Technical Support to connect to the PostgreSQL DBMS using the port forward option and the vacuum command.
You can reduce the risk of full database filling by adjusting the storage period of the most resource-intensive data: scan results and event logs. For this purpose, during the middleware (kcs-middleware) deployment you must specify the values of the following variables:
EVENT_LIFETIME_HOURSis a variable that defines the storage time for records in the event log.SCAN_LIFETIME_HOURSis a variable that determines the storage period for scan results.
Variable values are indicated in hours, the minimum allowable value is 1 hour. The default value is 2160 hours (90 days).
Before the middleware deployment with the adjusted values of the specified variables, you must stop the operation of the middleware (kcs-middleware) and the agent broker (kcs-ab). Otherwise, these components continue to process data while cleaning is conducted and may block this process.
In test (pilot) infrastructures where data integrity and consistency is not required or data can even be lost, you can use a faster cleaning method. To do this, you must delete PostgreSQL PV and create PostgreSQL PV again without data. The created Persistent Volume can be of the same size or larger.
S3-compatible file storage
The solution uses s3-compatible file storage only to store report files.
To clean up the storage when it is full, the cluster administrator must perform the following:
- Connect to the Minio file storage component (kcs-s3) using the port forward option.
- Download all reports and, if necessary, save them in another place for further storage.
- Delete data.
If necessary, you can increase Persistent Volume by using standard cluster tools.
ClickHouse DBMS
The settings of the tables in the Clickhouse database of the solution require their constant clearing. If the load in the infrastructure is very high, resources may not have time to be cleaned. In this case, you can increase Persistent Volume by using standard cluster tools.
You must organize monitoring of free disk space and the dynamics of its use independently using third-party tools approved within the framework of the solution infrastructure.
Page top
Backing up and restoring data
PostgreSQL mechanisms can be used for PostgreSQL database backup and data recovery. You can use these for the PostgreSQL database in Kaspersky Container Security or an existing PostgreSQL database you may have.
Database backup copies are created using the pg_dump utility. The backup copy includes all main settings and PostgreSQL database objects, even if the database is used in parallel. If you have a backup copy, you can quickly restore the database.
Without a backup copy, a malfunction may lead to an irrecoverable loss of the information stored in the PostgreSQL database.
The pg_dump utility lets you export a PostgreSQL database as a script or in an archive format such as .TAR.
Example of using the pg_dump utility
To restore a PostgreSQL database from a backup copy, you can use the pg_restore utility. This allows you to restore a PostgreSQL database from an archive file created by the pg_dump utility. The pg_restore utility executes commands that restore the database to the state that existed when the database was saved.
Example of using the pg_restore utility
Page top
Contacting Technical Support
If you cannot find a solution to your problem in the application documentation or in other sources of information about the application, you should contact Technical Support. Technical Support experts will answer your questions about installing and using the application.
Kaspersky provides technical support for this application throughout its lifecycle (please refer to the product support lifecycle page). Before contacting Technical Support, please read the technical support rules.
You can contact Technical Support experts in one of the following ways:
- Visit the Technical Support website.
- Submit a request to Kaspersky Technical Support through the Kaspersky CompanyAccount portal.
Sources of information about the application
Kaspersky Container Security page on the Kaspersky website
On the Kaspersky Container Security page, you can view general information about the application, its functions and features.
Discussing Kaspersky applications on the Forum
If your question does not require an immediate answer, you can discuss it with Kaspersky experts and other users on our Forum.
On this Forum, you can view existing threads, leave your own comments, and create new discussion threads.
Page top
Limitations and warnings
Kaspersky Container Security 2.0 has a number of limitations that are not critical to the operation of the solution:
- When working with PostgreSQL 11.* or later, you need to use the uuid-ossp and pgcrypto extensions with the Kaspersky Container Security database.
- The duration of the Kaspersky Container Security update depends on the volume of available databases. If your database contains a many records of tables with image scanning results, vulnerability descriptions, and accepted risks, the update may take up to several hours.
We recommend updating Kaspersky Container Security outside of active hours.
- If you need to run many image vulnerability scans, we advise you to disable the misconfiguration scan option in the scanner policy because this operation may consume substantially more resources, especially when working with large-sized images.
- If the misconfiguration control is enabled in the scanner policy for the scanner operation, scanning time significantly increases. Images containing up to 1000 configuration files in the YAML, YML and JSON formats were successfully tested, but the correct operation of the scanner on images containing over 1000 configuration files may not be guaranteed.
- You are not recommended to scan images for sensitive data, if the image size is over 10 GB.
- In cases where an attempt is made to run the solution simultaneously with other container security applications, Kaspersky Container Security has been noted to operate incorrectly. If another application in use is interfering and / or integrating with the operation of containers, the File Threat Protection component may not function correctly. You can temporarily disable the File Threat Protection component in scanner policies.
We recommend that you do not use Kaspersky Container Security simultaneously with other container security applications.
- To use network policies supplied with Kaspersky Container Security, ensure the following:
- In the Helm Chart used to deploy and install the solution, the
networkPolicies.createparameter is set totrue(the default value). - The network plug-in in the cluster, where the solution is deployed, supports Kubernetes network policies. If network policies are not supported, Kaspersky Container Security will create
NetworkPoliciesobjects, but they will not be applied and will not filter traffic.If the
NetworkPoliciesobjects are missing or not applied, the security level of the solution is lower.
- In the Helm Chart used to deploy and install the solution, the
- Kaspersky Container Security supports correct scanning only of images for the linux/amd64 architecture. When scanning multi-platform images, the scanner automatically attempts to apply the linux/amd64 architecture option.
- To ensure maximum compatibility of BPF programs used by Kaspersky Container Security with numerous Linux distributions and Linux kernel versions, the solution uses eBPF CO-RE technology. Kaspersky Container Security works directly with the kernel of the Linux host server (node), thus the following requirements and restrictions must be observed:
- To use eBPF CO-RE, the Linux kernel must be compiled with configuration value
CONFIG_DEBUG_INFO_BTF = y. Most Linux distributions have this configuration value enabled when building the kernel that is supplied with the distribution. - If kernel versions are updated manually, you must check the availability of the above mentioned configuration value.
For earlier versions of Linux distributions and Linux kernels that do not have built-in support for eBPF CO-RE, backward compatibility is ensured by Kaspersky Container Security.
- To use eBPF CO-RE, the Linux kernel must be compiled with configuration value
- If a manually compiled Linux kernel is used on a host server (node), the following settings must be enabled during the kernel configuration to ensure runtime monitoring using container runtime profiles:
CONFIG_BPF=yCONFIG_BPF_SYSCALL=yCONFIG_BPF_EVENTS=yCONFIG_NET_CLS_BPF=mCONFIG_NET_ACT_BPF=m
To ensure better BPF code performance, we recommend enabling the following settings:
CONFIG_BPF_JIT = y
CONFIG_HAVE_BPF_JIT = y - If runtime monitoring using Kaspersky Container Security container runtime profiles is to be conducted simultaneously with CNI Cilium (node-agent pods are deployed on the same host servers with cilium-agent), the following actions must be performed:
- In the cluster with the deployed node-agent, specify the value of the
data.bpf-filter-priorityparameter forConfigMap cilium-configgreater than 1.We recommend to specify 5 for the
data.bpf-filter-priorityparameter. - Restart the cilium-agent pods to apply the specified setting.
- In the cluster with the deployed node-agent, specify the value of the
- To access Kubernetes, Kaspersky Container Security uses the functionality of the dynamic admission controller provided in Kubernetes. The security of your cluster can be hardened by configuring authorization between the Kubernetes API and kube-agent, which ensures the operation of the solution's dynamic admission controller. Authorization must be configured in accordance with the Kubernetes instructions.
Vulnerabilities in third-party services
Kaspersky Container Security operates using third-party services that are included in the solution's distribution kit. The table below shows information about critical vulnerabilities identified in the Kaspersky Container Security components and the solution versions in which the vulnerabilities are planned to be fixed.
Critical vulnerabilities identified in third-party services and versions of the solution in which vulnerabilities are planned to be fixed
Vulnerability |
Solution version |
|---|---|
Kaspersky Container Security 2.0.1 |
Glossary
CEF
The Common Event Format is a standardized structured data format for logging events in the security event log. CEF is based on the Syslog format, which is a message logging standard supported by most network devices and operating systems.
CI/CD
Continuous Integration/Continuous Delivery is the combination of continuous software integration and continuous delivery in the development process.
CISA
The Cybersecurity and Infrastructure Security Agency (CISA) is a federal agency in the USA tasked with enhancing national cybersecurity at all levels of government, developing and coordinating the implementation of cybersecurity programs in the USA, and improving the protection of the information infrastructure from hacker attacks.
CNI
Container Networking Interface is a project dedicated to standardized management of network interfaces in Linux containers and flexible extension of their network capabilities. CNI plug-ins ensure that the network interface is included in the container namespace and performs all necessary configuration on the host node.
CRI
The Container Runtime Interface (CRI) is used by the orchestrator to work with various container runtimes, without the need to recompile cluster components. The CRI defines the main protocol used for communication between cluster components and the container runtime.
CSI
Container Storage Interface is a specification that defines API parameters for adding and configuring storage in clusters.
CVE
Common Vulnerabilities and Exposures is the database for generally known information security vulnerabilities. Each vulnerability is given an identifier in the CVE-year-number format, description and several open links with descriptions.
CVSS
Common Vulnerability Scoring System is an open standard for scoring vulnerabilities. CVSS specifies a set of metrics and formulas for scoring vulnerability severity, with values from 0 (minimum) to 10 (maximum). CVSS makes it possible to allocate vulnerability response efforts based on vulnerability severity.
CycloneDX
CycloneDX is an SBOM standard that was developed for application security contexts and analysis of application components by assessing the availability and state of all software components.
Dynamic admission controller
A configurable Kubernetes admission controller that helps enforce policies and supports management and control.
Exploit
Program code that takes advantage of some vulnerability in the system or in application software. Exploits are frequently used to install malware on a computer without the user's knowledge.
FSTEC
The Russian Federal Service for Technical and Export Control.
IaC
Infrastructure as a Code is an approach to managing and describing infrastructure through configuration files instead of manually editing server configurations.
Init container
A special container that is started when the pod is initialized before the main containers are started. Init containers prepare the environment for operation (for example, they access secrets or redirect network traffic) and may contain utilities that are not necessary or desirable in the main container.
Kaspersky OpenTIP
The publicly available Kaspersky Threat Intelligence Portal information system. Contains information about cyberthreats, safe objects, and the relationships between them.
Kaspersky TIP
The Kaspersky Threat Intelligence Portal information system that is available with premium access. Provides additional tools for analyzing cyberthreats, including threat lookup and Kaspersky Cloud Sandbox, as well as analytical reports about APTs, financial crime software, industrial cybersecurity threats, and the digital activity of a specific organization.
LDAP
Lightweight Directory Access Protocol is a lightweight client-server protocol for accessing directory services.
MITRE
The MITRE ATT&CK matrix, developed by the MITRE Corporation, describes the techniques and tactics used in attacks on information systems. It helps ensure the necessary level of protection, identify attacks on infrastructure, determine their purpose and detection method.
Namespace
A virtual cluster inside a Kubernetes cluster which isolates cluster resources. Each namespace has its resources: services, pods, and deployments. The Resource names must be unique to operate in one namespace, although you can use the same names in other namespaces.
Node
A physical or virtual machine on which containers with applications are deployed and run. A Kubernetes cluster consists of several nodes. The cluster has a master node which manages the cluster and worker nodes where containers operate.
NSA
The National Security Agency (NSA) is a division of the US Department of Defense that (among other things) is responsible for cyber intelligence and protecting US government information systems from cyber attacks.
NVD
The National Vulnerability Database is the United States Government repository of standards-based vulnerability management data represented using the Security Content Automation Protocol.
PCI SSC
PCI Security Standards Council is a global forum dedicated to the ongoing development, enhancement, storage, dissemination, and implementation of security standards for payment card data protection.
Pipeline
Continuous software integration and continuous delivery (CI/CD) is performed in sequence one by one.
Pod
An abstract Kubernetes object, a group of one or more application containers, including shared storage (volumes), network settings, and information about application launch. Pod is the Kubernetes management unit.
RED OS
Russian general-purpose operating system RED OS supports scanning for vulnerabilities that can threaten the functioning of services and workstations.
SBOM
A Software Bill of Materials (SBOM) is a list of all object components. It also describes component dependencies and ways to validate and confirm source authenticity.
SIEM
Security information and event management is a class of software solutions that obtain and analyze data about security events.
Sigstore
It is a project aimed at developing and providing tools and services for the verification of software through the use of digital signatures. Sigstore also maintains a public registry to confirm the authenticity of changes to an image.
SPDX
Software Package Data Exchange (SPDX) is an international open standard for security, license compliance, and other artifacts of the software supply chain that is used to provide information about the origin, licensing, and security of software packages and their dependencies.
Syslog
A standard for sending and logging system event messages used for the UNIX and GNU/Linux platforms.
VDB (DSTD)
The Data Security Threats Database (DSTD or VDB) is a national vulnerability database maintained by the Russian Federal Service for Technical and Export Control (FSTEC).
Page top
Third party code information
Information about third-party code is provided under Settings → About platform. It can be found in the following files:
- legal_notices.txt, which can be downloaded in the Management console by clicking Third party code information in Kaspersky Container Security
- ftp_legal_notices.txt, which can be downloaded in the management console by clicking Third party code information in the File Threat Protection component
- kuu_legal_notices.txt, which can be downloaded in the Management console by clicking Third party code information in Kaspersky Update Utility
Trademark notices
Registered trademarks and service marks are the property of their respective owners.
Adobe is either a registered trademark or a trademark of Adobe in the United States and/or other countries.
Amazon, Amazon Web Services, and AWS are trademarks of Amazon.com, Inc. or its affiliates.
Apache is either registered trademark or trademark of the Apache Software Foundation.
Apple, Safari and SWIFT are trademarks of Apple Inc.
Ubuntu is a registered trademark of Canonical Ltd.
CHAINGUARD and Wolfi are trademarks of Chainguard, Inc.
ClamAV is a registered trademark or trademark of Cisco Systems, Inc. and/or its affiliates in the United States and certain other countries.
The Grafana Word Mark and Grafana Logo are either registered trademarks/service marks or trademarks/service marks of Coding Instinct AB, in the United States and other countries and are used with Coding Instinct’s permission. We are not affiliated with, endorsed or sponsored by Coding Instinct, or the Grafana community.
Docker and the Docker logo are trademarks or registered trademarks of Docker, Inc. in the United States and/or other countries. Docker, Inc. and other parties may also have trademark rights in other terms used herein.
Dropbox is a trademark of Dropbox, Inc.
Elasticsearch is a trademark of Elasticsearch BV, registered in the U.S. and in other countries.
Google, Google Chrome, Chromium, Dart, and Nexus are trademarks of Google LLC.
Terraform is a trademark of HashiCorp.
S3 is a trademark of International Business Machines Corporation registered in many jurisdictions around the world.
Node.js is a trademark of Joyent, Inc.
LinkedIn is a registered trademark or trademark of LinkedIn Corporation and its affiliates in the United States and/or other countries.
Linux is the registered trademark of Linus Torvalds in the U.S. and other countries.
Microsoft, Active Directory, Azure, Excel, Microsoft Edge, Windows, and Windows Server are trademarks of the Microsoft group of companies.
Mozilla and Firefox are trademarks of the Mozilla Foundation in the U.S. and other countries.
OpenStack is a registered trademark of the OpenStack Foundation in the United States and other countries.
Oracle, Java are registered trademarks of Oracle and/or its affiliates.
Python is a trademark or registered trademark of the Python Software Foundation.
Red Hat, Red Hat Enterprise Linux, and CentOS are trademarks or registered trademarks of Red Hat, Inc. or its subsidiaries in the United States and other countries.
OpenShift is a registered trademark of Red Hat, Inc. in the United States and other countries.
Sonatype Nexus is a trademark of Sonatype, Inc.
SUSE is a registered trademark of SUSE LLC in the United States and other countries.
OpenAPI is a trademark of The Linux Foundation.
Helm, Kubernetes, and GRPC are registered trademarks of The Linux Foundation in the United States and other countries.
Rocky Linux is a trademark of The Rocky Enterprise Software Foundation.
TWITCH is a trademark of Twitch Interactive, Inc. or its affiliates.
UNIX is a registered trademark in the United States and other countries, licensed exclusively through X/Open Company Limited.
ClickHouse is a trademark of YANDEX LLC.
Page top
ATT&CK MITRE Terms of Use
The following are the Terms of Use of MITRE ATT&CK (Adversarial Tactics, Techniques, and Common Knowledge).
The MITRE Corporation Terms of Use
LICENSE
The MITRE Corporation (MITRE) hereby grants you a non-exclusive, royalty-free license to use ATT&CK for research, development, and commercial purposes. Any copy you make for such purposes is authorized provided that you reproduce MITRE's copyright designation and this license in any such copy.
"© 2024 The MITRE Corporation. This work is reproduced and distributed with the permission of The MITRE Corporation."
DISCLAIMERS
MITRE does not claim ATT&CK enumerates all possibilities for the types of actions and behaviors documented as part of its adversary model and framework of techniques. Using the information contained within ATT&CK to address or cover full categories of techniques will not guarantee full defensive coverage as there may be undisclosed techniques or variations on existing techniques not documented by ATT&CK.
ALL DOCUMENTS AND THE INFORMATION CONTAINED THEREIN ARE PROVIDED ON AN "AS IS" BASIS AND THE CONTRIBUTOR, THE ORGANIZATION HE/SHE REPRESENTS OR IS SPONSORED BY (IF ANY), THE MITRE CORPORATION, ITS BOARD OF TRUSTEES, OFFICERS, AGENTS, AND EMPLOYEES, DISCLAIM ALL WARRANTIES, EXPRESS OR IMPLIED, INCLUDING BUT NOT LIMITED TO ANY WARRANTY THAT THE USE OF THE INFORMATION THEREIN WILL NOT INFRINGE ANY RIGHTS OR ANY IMPLIED WARRANTIES OF MERCHANTABILITY OR FITNESS FOR A PARTICULAR PURPOSE.
Page top