Contents
- Remote diagnostics of client devices. Kaspersky Security Center remote diagnostics utility
- Connecting the remote diagnostics utility to a client device
- Enabling and disabling tracing, downloading the trace file
- Downloading application settings
- Downloading event logs
- Downloading multiple diagnostic information items
- Starting diagnostics and downloading the results
- Starting, stopping, and restarting applications
Remote diagnostics of client devices. Kaspersky Security Center remote diagnostics utility
The utility for remote diagnostics of Kaspersky Security Center (hereinafter referred to as the remote diagnostics utility) is designed for remote execution of the following operations on client devices:
- Enabling and disabling tracing, changing the tracing level, downloading the trace file.
- Downloading system information and application settings.
- Downloading event logs.
- Generating a dump file for an application.
- Starting diagnostics and downloading diagnostics reports.
- Starting and stopping applications.
You can use event logs and diagnostics reports downloaded from a client device to troubleshoot problems on your own. Also, a Kaspersky Technical Support specialist might ask you to download trace files, dump files, event logs, and diagnostics reports from a client device for further analysis at Kaspersky.
The remote diagnostics utility is automatically installed on the device together with Administration Console.
Connecting the remote diagnostics utility to a client device
To connect the remote diagnostics utility to a client device:
- Select any administration group in the console tree.
- In the workspace, on the Devices tab, in the context menu of any device, select Custom tools → Remote diagnostics.
The main window of the remote diagnostics utility opens.
- In the first field of the main window of the remote diagnostics utility, specify which tools you intend to use to connect to the device:
- Access using Microsoft Windows network.
- Access using Administration Server.
- If you have selected Access using Microsoft Windows network in the first field of the main utility window, perform the following actions:
- In the Device field, specify the address of the device to which you need to connect
You can use an IP address, NetBIOS name, or DNS name as the device address.
The default value is the address of the device from whose context menu the utility was started.
- Specify an account for connecting to the device:
- Connect as current user (selected by default). Connect by using the current user account.
- Use provided user name and password to connect. Connect by using a provided user account. Specify the User name and the Password of the required account.
Connection to a device is possible only under the account of the local administrator of the device.
- In the Device field, specify the address of the device to which you need to connect
- If you have selected Access using Administration Server in the first field of the main utility window, perform the following actions:
- In the Administration Server field, specify the address of the Administration Server from which you intend to connect to the device.
You can use an IP address, NetBIOS name, or DNS name as the server address.
The default value is the address of the Administration Server from which the utility has been run.
- If required, select the Use SSL, Compress traffic, and Device belongs to secondary Administration Server check boxes.
If the Device belongs to secondary Administration Server check box is selected, you can fill in the Device belongs to secondary Administration Server field with the name of the secondary Administration Server that manages the device by clicking the Browse button.
- In the Administration Server field, specify the address of the Administration Server from which you intend to connect to the device.
- To connect to the device, click the Sign in button.
You have to authorize by using two-step verification if two-step verification is enabled for your account.
This opens the window intended for remote diagnostics of the device (see the figure below). The left part of the window contains links to operations of device diagnostics. The right part of the window contains the object tree of the device with which the utility can operate. The lower part of the window displays the progress of the utility operations.
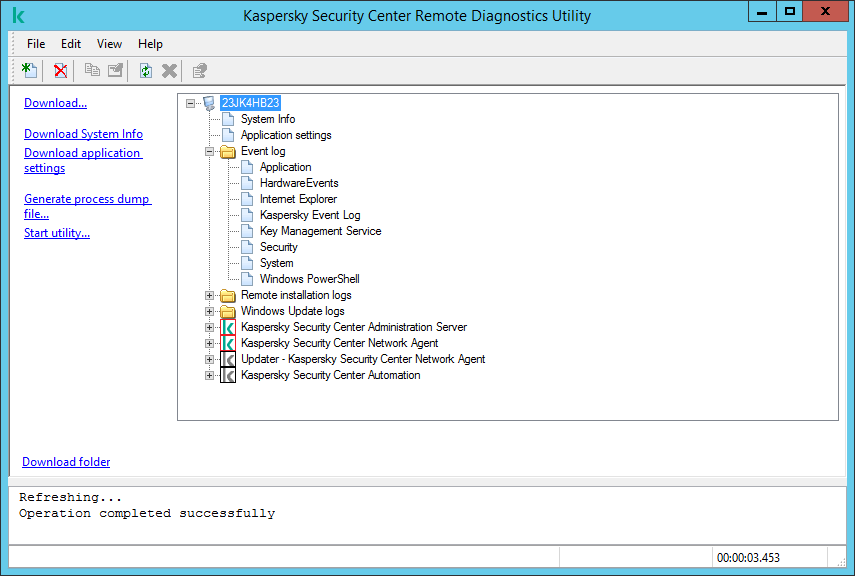
Remote diagnostics utility. Remote device diagnostics window
The remote diagnostics utility saves files downloaded from devices on the desktop of the device from which it was started.
Enabling and disabling tracing, downloading the trace file
To enable tracing on a remote device:
- Run the remote diagnostics utility and connect to the necessary device.
- In the objects tree of the device, select the application for which you want to enable tracing.
Tracing can be enabled and disabled for applications with self-defense only if the device is connected using Administration Server tools.
If you want to enable tracing for Network Agent, you can also do it while creating the Install required updates and fix vulnerabilities task. In this case, Network Agent will write the tracing information even if tracing is disabled for Network Agent in the remote diagnostics utility.
- To enable tracing:
- In the left part of the remote diagnostics utility window, click Enable tracing.
- In the Select tracing level window that opens, we recommend that you keep the default values of the settings. When required, a Technical Support specialist will guide you through the configuration process. The following settings are available:
- Tracing level
- Rotation-based tracing (available for Kaspersky Endpoint Security only)
- Click OK.
- For Kaspersky Endpoint Security, a Technical Support specialist may ask you to enable Xperf tracing for information about the system performance.
To enable Xperf tracing:
- In the left part of the remote diagnostics utility window, click Enable Xperf tracing.
- In the Select tracing level window that opens, depending on the request from the Technical Support specialist, select one of the following tracing levels:
- Select one of the following tracing types:
- You may also be asked to enable the Rotation-based tracing option to prevent excessive increase in the size of the trace file. Then specify the maximum size of the trace file. When the file reaches the maximum size, the oldest tracing information is overwritten with new information.
- Click OK.
In some cases, the security application and its task must be restarted in order to enable tracing.
The remote diagnostics utility enables tracing for the selected application.
To download a trace file of an application:
- Run the remote diagnostics utility and connect to the necessary device, as described in "Connecting the remote diagnostics utility to a client device".
- In the node of the application, in the Trace files folder, select the required file.
- In the left part of the remote diagnostics utility window, click Download entire file.
For large files the most recent trace parts can be downloaded.
You can delete the highlighted trace file. The file can be deleted after tracing is disabled.
The selected file is downloaded to the location specified in the lower part of the window.
To disable tracing on a remote device:
- Run the remote diagnostics utility and connect to the necessary device, as described in "Connecting the remote diagnostics utility to a client device".
- In the device object tree, select the application for which you want to disable tracing.
Tracing can be enabled and disabled for applications with self-defense only if the device is connected using Administration Server tools.
- In the left part of the remote diagnostics utility window, click Disable tracing.
The remote diagnostics utility disables tracing for the selected application.
Page topDownloading application settings
To download application settings from a remote device:
- Run the remote diagnostics utility and connect to the necessary device, as described in "Connecting the remote diagnostics utility to a client device".
- In the objects tree of the remote diagnostics utility window, select the top node with the name of the device.
- In the left part of the remote diagnostics utility window, select the action you need from the following options:
- Download System Info
- Download application settings
- Generate process dump file
In the window that opens after you click this link, specify the executable file of the application for which you want to generate a dump file.
- Start utility
In the window that opens after you click this link, specify the executable file of the utility that you want to start, and its run settings.
The selected utility is downloaded and launched on the device.
Page topDownloading event logs
To download an event log from a remote device:
- Run the remote diagnostics utility and connect to the necessary device, as described in "Connecting the remote diagnostics utility to a client device".
- In the Event log folder of the device object tree, select the relevant log.
- Download the selected log by clicking the Download event log <Event log name> link in the left part of the remote diagnostics utility window.
The selected event log is downloaded to the location specified in the lower pane.
Downloading multiple diagnostic information items
Kaspersky Security Center remote diagnostics utility allows you to download multiple items of diagnostic information including event logs, system information, trace files, and dump files.
To download diagnostic information from a remote device:
- Run the remote diagnostics utility and connect to the necessary device, as described in "Connecting the remote diagnostics utility to a client device".
- In the left part of the remote diagnostics utility window, click Download.
- Select the check boxes next to the items that you want to download.
- Click Start.
Every selected item is downloaded to the location specified in the lower pane.
Page topStarting diagnostics and downloading the results
To start diagnostics for an application on a remote device and download the results:
- Run the remote diagnostics utility and connect to the necessary device, as described in "Connecting the remote diagnostics utility to a client device".
- In the object tree of the device, select the necessary application.
- Start diagnostics by clicking the Run diagnostics link in the left part of the remote diagnostics utility window.
A diagnostics report appears in the node of the selected application in the object tree.
- Select the newly generated diagnostics report in the objects tree and download it by clicking the Download folder link.
The selected report is downloaded to the location specified in the lower pane.
Page topStarting, stopping, and restarting applications
You can start, stop, and restart applications only if you have connected the device using Administration Server tools.
To start, stop, or restart an application:
- Run the remote diagnostics utility and connect to the necessary device, as described in "Connecting the remote diagnostics utility to a client device".
- In the object tree of the device, select the necessary application.
- Select an action in the left part of the remote diagnostics utility window:
- Stop application
- Restart application
- Start application
Depending on the action that you have selected, the application is started, stopped, or restarted.
Page top